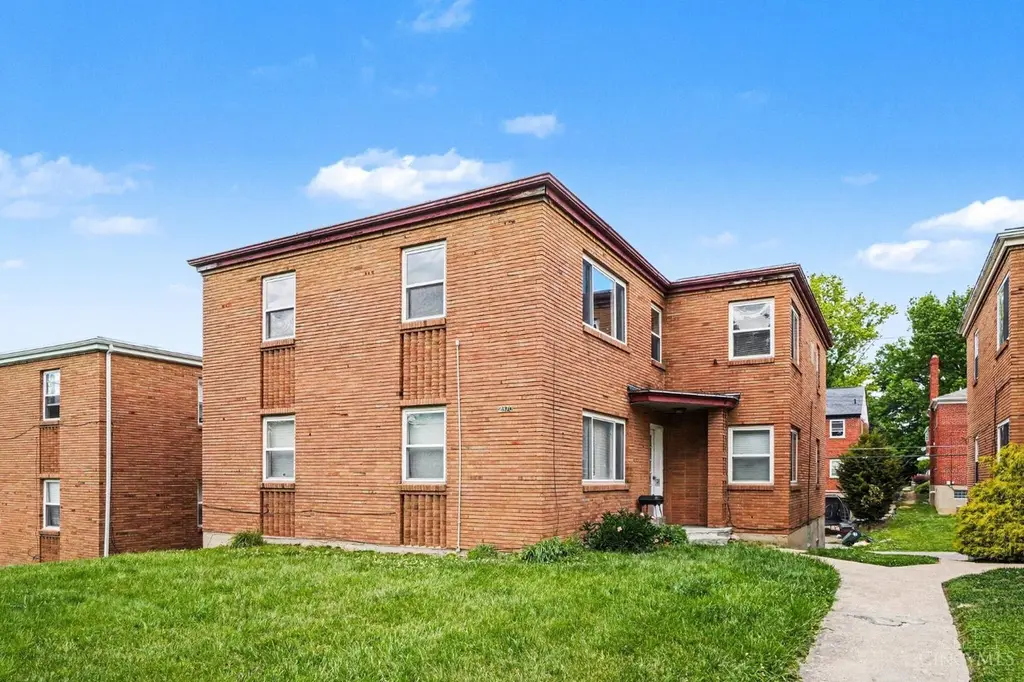
 Fourplex
2370 Losantiville Ave · Golf Manor, OH
Flood risk 1/10 · Minimal
- FEMA flood zone
- X (unshaded)
- Chance of flooding over 30 yrs
- 0.0%
- Est. flood insurance / yr
- $507 – $1,088
Fire risk 1/10 · Minimal
- Est. fire insurance / yr
- $713 – $1,323
Heat risk 5/10 · Moderate
- Hot days now (above 103°F)
- 7 days/yr
- Hot days in 30 yrs
- 19 days/yr
Wind risk 2/10 · Minimal
- Chance of severe wind over 30 yrs
- 1.0%
Air-quality risk 4/10 · Minor
- Unhealthy air days now
- 4 days/yr
- Unhealthy air days in 30 yrs
- 5 days/yr
Risk factors via First Street. Map © Google.
Why this score? — see what drove the B grade
The composite is a weighted blend of 9 inputs, each scored 0–100. Each bar is that input's sub-score; the figure is the points it added to the 100-point composite (weight × sub-score).
- Cash flow +30.0/30.0
- 1% rule +10.0/10.0
- DSCR +10.0/10.0
- ARV discount +7.5/15.0
- Rent growth +4.2/5.0
- Livability +4.0/5.0
- Schools +2.5/10.0
- Condition / age +2.5/5.0
- Appreciation +0.0/10.0
$250,000
🖨 Deal sheet 📄 Offer letter ✓ Due diligence
Multi-family units
County records classify this as Multi-Family (5+ Unit). Listing-text estimate: 4 units. estimate disagrees with records
5+ unit building — per-unit beds/baths from public records are typically unavailable; the breakdown below (if shown) is an estimate from the listing text.
Listing remarks MLS
Lender owned sold as is.No Ohio Disclosures. Seller Addenda applies. Copy of earnest money, satisfactory pre-qual letter/proof of funds required with all offers. Sale is subect to seller obtaining Sheriff's Deed and Corporate approval.
Key facts
- Separate furnaces
- Solid condition roof
- Newer water heater
Tags
Property features AI
Finance
- Other: Property listed as auction; Parcel number available
- Financial info: This is a four-unit investment property; Unit rents provided: Unit 2 listed at $800, Unit 3 listed at $600, Unit 4 listed at $700
Exterior
- Parking: Attached garage with 4 garage spaces; 4 additional open parking spaces
- Utilities: Public water; Public sewer; Natural gas
- Home design: Quad-style multi-unit building; Two levels; Single building containing all units
- Construction: Brick construction; Shingle roof; Poured foundation; Built on two levels
- Exterior features: Vinyl windows; No fireplace
Interior
- Bedrooms: Four total units: two 1-bedroom units and two 2-bedroom units; Unit 1: 1 bedroom; Unit 2: 2 bedrooms; Unit 3: 1 bedroom; Unit 4: 2 bedrooms
- Bathrooms: Each unit has one full bathroom
- Heating & cooling: Central air conditioning; Electric heating; Hot water heating
- Interior features: Full basement
Neighborhood map
What this means for you Summary
Snapshot
- This is a 2×2bd/1ba + 2×1bd/1ba units multifamily listed at $250k.
Deal economics
- At list price, monthly cash flow is $1k ($18k/yr) — positive. Per door: $367/mo.
- The deal already cash-flows at list — no discount required.
- Meets the 1% rule at list price ($4k rent vs $250k).
- Recommended offer: $242k (3.0% below list) — sets the bar for market timing.
Location & tenants
- Location reads 80/100 on livability (#108 in OH, #1,631 nationally) — a professional / high-income tenant draw. Strengths: commute A+, cost of living A+, housing A+; Watch: amenities F.
- Cincinnati Public Schools (urban): math 25% / reading 36% proficiency, ranked #581 of 656 in OH (top 89%) — families likely to look elsewhere, expect single-tenant / working-renter base with shorter leases; 70% free/reduced lunch — lower-income household profile, screen leases tightly.
- Market conditions: Rents rising fast (+6.6%/yr); 44 active listings in the ZIP; lower-income renter base — watch delinquency; 801 units permitted in Hamilton County in 2024 (190 in 5+ unit buildings).
- At $4,377/mo this rent would consume 117% of the median local household income ($45k/yr) (locally 1467% of renters already pay >50% of income on rent) — very limited rent-growth headroom before tenants either downsize or default.
Forward outlook
- Local home prices are declining (-3.0%/yr); year-one equity from $2k of loan paydown is wiped out by about $8k of value loss. Plan a longer hold.
- At projected returns (-3.0% appreciation + 6.6% rent growth), your $70k cash investment doubles in ~5 years — after that, you're playing with house money.
Negotiation context
- It's been on market 32 days — a 3% lower offer ($242k) is reasonable based on typical stale-listing flexibility.
- 5 sale attempts since 30y ago with the ask held roughly flat each time — persistent listings suggest the price (not the market) is what's stuck; bring a comps-based counter.
- Current owner paid $100k; list at $250k implies a 150% gain — meaningful room to come down on a strong offer.
Risks & watch-outs
- Watch-outs: property tax is 2.8% of price; built in 1949 — expect roof / HVAC / electrical / plumbing capex.
- Climate carrying-cost: extreme-heat days projected 7→19/yr by 2055 (HVAC capex compounding) — expect insurance premiums to compound above CPI over the hold.
Questions for the listing agent
- It's been on market 32 days. Have you received any prior offers? Is the seller open to a 3% concession, seller financing, or rate buy-down credit?
- Can we see the unit-by-unit rent roll, current vacancy, and any below-market leases? What's the average tenancy length?
- What capital expenditures (roof, boiler, parking lot, exteriors) have been made in the last 5 years, and what's planned in the next 2?
- Built in 1949 — when were the roof, HVAC, electrical panel, plumbing, and water heater last replaced?
- Property tax is high relative to price — has the assessment been appealed recently, and will the sale trigger a re-assessment?
- Is there a deadline driving the sale (1031 exchange, divorce, estate, relocation)? That informs how much negotiation room exists.
- Schools are B-rated — typically a magnet for longer-tenancy family renters. What's the average tenant stay here, and is there a school-zone premium baked into asking?
- What's the average days-on-market for RENTAL listings here right now (not sales)? A rising rental-DOM trend means longer vacancies and softer asking-rent achievability than the comps imply.
- What's the recent tenant-quality profile in this submarket — average credit score on applications, eviction rate, late-payment / NSF rate, and stable-employment percentage? A property-management company in the area should have these aggregated.
- How much new apartment / multifamily construction is in the pipeline within 1–3 miles? Heavy new supply (>2% of stock underway) typically softens rents 12–24 months out; light construction supports rent growth.
Investment metrics
- 1% rule
- 1.75% ✓
- Cap rate
- 13.34%
- Cash-on-cash
- 25.18%
- DSCR
- 2.12
- GRM
- 4.8
CMA / ARV
No comps found within radius.
Projected returns pro-forma
-3.0% appreciation · 6.62% rent growth · sell at horizon
- IRR
- 23.1%
- Equity multiple
- 2.00×
- Total profit
- $69,777
- Equity at exit
- $37,276
- IRR
- 33.5%
- Equity multiple
- 4.65×
- Total profit
- $255,172
- Equity at exit
- $21,615
Cash invested: $70,000 (down + closing). Projections, not guarantees.
Landlord ↔ Tenant lean methodology
- Overall (STATE)
- 73 Landlord-Friendly
- State Ohio
- 73 Landlord-Friendly · R+6
- County
- — inherits STATE
- City
- — inherits STATE
ZIP-level market 45237
- Home prices YoY
- -33.0%
- Rents YoY
- 6.6%
- Active inventory
- 44
- Price-to-rent
- 18.3×
Monthly cashflow live
- Estimated rent
- $4,377 high interval (Pro) →
- Mortgage (P&I)
- −$1,311
- Tax from tax record
- −$574 /mo · $6,888/yr
- Insurance
- −$104
- HOA
- −$0
- Vacancy / Maint / Mgmt
- −$919
- Net cashflow
- $1,469
Break-even live
4-unit breakdown (identical units grouped — click to expand)
| Units | Beds | Baths | Est. rent |
|---|---|---|---|
| 2× units | 2 | 1 | $2,270 |
| #1 | 2 | 1 | $1,135 |
| #2 | 2 | 1 | $1,135 |
| 2× units | 1 | 1 | $2,106 |
| #3 | 1 | 1 | $1,053 |
| #4 | 1 | 1 | $1,053 |
| Total (4 units) | $4,377 | ||
UW: 25.0% down · 7.5% · 30yr · 1.5% tax · 5.0% vac · 8.0% maint · 8.0% mgmt
Financing live
Cash to close
- Down payment
- $62,500
- Closing costs
- $7,500
- Reserves months
- —
- Total cash needed
- —
Loan-product check · same deal, 3 products live
Conventional
25% down · 7.5% · 30yr
- Down + closing
- —
- Monthly P&I
- —
- Monthly cashflow
- —
- DSCR
- —
- Eligible?
- —
Personal DTI + credit; lowest rate.
DSCR
20% down · 8.5% · 30yr
- Down + closing
- —
- Monthly P&I
- —
- Monthly cashflow
- —
- DSCR
- —
- Eligible?
- —
No personal income docs; deal must DSCR.
Hard money
10% down · 12.0% · 12mo
- Down + closing
- —
- Monthly P&I
- —
- Monthly cashflow
- —
- DSCR
- —
- Eligible?
- —
Short-term bridge; refi at stabilization.
Listing history 25 events
-
2026-06-16days on market $250,000 Active 32 DOM
-
2026-06-15days on market $250,000 Active 31 DOM
-
2026-06-13days on market $250,000 Active 29 DOM
-
2026-06-13days on market $250,000 Active 28 DOM
-
2026-06-09days on market $250,000 Active 25 DOM
-
2026-06-08days on market $250,000 Active 24 DOM
-
2026-06-07days on market $250,000 Active 23 DOM
-
2026-06-03days on market $250,000 Active 19 DOM
-
2026-06-02days on market $250,000 Active 18 DOM
-
2026-06-01days on market $250,000 Active 17 DOM
-
2026-05-31days on market $250,000 Active 16 DOM
-
2026-05-15$250,000 Active
-
2006-12-26soldstatus $99,900
-
2006-12-19soldstatus $90,000
-
2006-10-06soldstatus $90,000 235-char remark
Show marketing remark (235 chars)
Lender owned sold as is.No Ohio Disclosures. Seller Addenda applies. Copy of earnest money, satisfactory pre-qual letter/proof of funds required with all offers. Sale is subect to seller obtaining Sheriff's Deed and Corporate approval.
-
2006-06-09$105,000 235-char remark
Show marketing remark (235 chars)
Lender owned sold as is.No Ohio Disclosures. Seller Addenda applies. Copy of earnest money, satisfactory pre-qual letter/proof of funds required with all offers. Sale is subect to seller obtaining Sheriff's Deed and Corporate approval.
-
2005-09-02historical
-
2005-03-05$149,900
-
2003-06-25soldstatus $137,200
-
2003-04-30soldstatus $137,200
-
2003-03-12$132,500
-
1996-08-06soldstatus $108,500
-
1996-07-30soldstatus $108,500
-
1996-07-03$114,500
-
1986-12-30soldstatus $67,500
ⓘ Source: listings_history table (triggers on properties + properties_extension) + one-shot
backfill from property_details.listing_events for pre-trigger history.
Tax reassessment forecast OH · Partial reset (capped growth)
- Current annual tax
- $6,888 · $574/mo
- Projected year-2 tax
- $6,888 · $574/mo
- Expected delta
- $0/yr ($0/mo · 0.0%)
ⓘ Screening estimate from a state-policy table — verify with the county assessor before closing.
Climate risk First Street
- Flood 1/10 Low FEMA zone X (unshaded) · 0% chance over 30 yrs
- Wildfire 1/10 Low
- Heat 5/10 Major 7 d/yr ≥103°F today · 19 d/yr by 30 yrs out
- Wind 2/10 Low 100% chance of damaging wind over 30 yrs
- Air quality 4/10 Moderate 4 unhealthy d/yr today · 5 by 30 yrs out
Nearby sold comps map
Loading sold comps map…
Walkable amenities ~0.75 mi
Loading nearby amenities…
Taxation est. · year 1
- Rental income
- $52,524
- − Mortgage interest
- −$14,004
- − Property taxes
- −$6,888
- − Insurance
- −$1,250
- − Repairs & maintenance
- −$4,202
- − Management
- −$4,202
- − Depreciation
- −$7,273
- Taxable income
- $14,706
- Est. tax owed @ 24.0%
- −$3,529
- After-tax cash flow
- $14,094/yr
For passive investors: Depreciation is non-cash, so a rental often shows a tax loss while cash-flowing — sheltering income. Rental losses are passive: they offset passive income freely, and up to $25,000/yr can offset ordinary (W-2) income if you actively participate and your MAGI is under $100k (phasing out to $0 by $150k); unused losses carry forward. On sale, claimed depreciation is recaptured at up to 25%, and gains may owe capital-gains tax (a 1031 exchange can defer both). Figures are a year-1 estimate at your 24.0% rate — not tax advice; consult a CPA.
Schools (NCES district)
- District
- Cincinnati Public Schools
- NCES district ID
- 3904375
- Math proficiency
- 25% ▼ -19.00%
- Reading proficiency
- 36% ▼ -14.00%
- Median HH income
- $35,743
- Composite
- 25.21/100
- National rank
- #7508
- State rank
- #581 of 656 in OH
Livability — Golf Manor
- Score
- 80/100
- State rank
- #108
- US rank
- #1631
Category grades
Schools grade is shown separately in the Schools card above.
Census & demographics
- Census place
- Golf Manor, OH
- County
- Hamilton County · 701,295 people
- Metro
- Cincinnati, OH-KY-IN
- Population (ZIP)
- 20,903
- Household income
- $44,913
- Rent vs Own
- Severe rent burden
- 1467.0
Population outlook (Hamilton County) Hauer SSP2
- Today (2025)
- 826,054 people
- By 2030
- 830,947 · +0.6%
- By 2040
- 832,319 · +0.8%
- By 2050
- 822,428 · -0.4%
- By 2075
- 788,688 · -4.5%
- By 2100
- 710,674 · -14.0%
Race, ethnicity, and origin ACS 2023
- Neighborhood character
- Predominantly Black (71%)
- Race & ethnicity
- Black 71% White 22% Two or more races 4% Hispanic / Latino 2%
- Common ancestry
- Romanian 2% Italian 1% Scotch-Irish 1%
- Foreign-born
- 3% · Canada
- Languages at home
- 96% English-only · Spanish 2%
Political lean MEDSL · Hamilton
- 2024 margin
- D (+14.9) · D 57.0% · R 42.1%
- 2008→2024 swing
- +7.9pp toward D · 2008: 7.0pp · 2024: 14.9pp
- All cycles
- 2024: D+14.9 2020: D+15.9 2016: D+9.5 2012: D+4.9 2008: D+7.0
Not yet ingested
- Civics
- —
Market trends
- HPI YoY
- ▼ -110.54%
- Current HPI
- 224.4728
- Rent YoY
- ▲ 6.62%
- Metro
- Cincinnati, OH-KY-IN
- State GDP YoY
- ▲ 1.98%
- F500 in state
- 48
Industry mix (Fortune 500 HQ in OH)
| Industry | F500 HQs | Revenue |
|---|---|---|
| Insurance | 3 | $145B |
|
||
| Industrial Machinery | 3 | $49B |
|
||
| Financial Services | 3 | $24B |
|
||
| Consumer Goods | 2 | $93B |
|
||
| Aerospace / Defense | 2 | $47B |
|
||
| Utilities | 2 | $33B |
|
||
Price history
+270.4% since first listed14 events — show timeline
- 2026-05-15 Listed $250,000 Cincy MLS
- 2006-12-26 Sold (Public Records) $99,900 Public Records
- 2006-12-19 Sold (Public Records) $90,000 Public Records
- 2006-10-06 Sold (MLS) $90,000 Cincy MLS
- 2006-06-09 Listed $105,000 Cincy MLS
- 2005-09-02 Listing Removed — Cincy MLS
- 2005-03-05 Listed $149,900 Cincy MLS
- 2003-06-25 Sold (Public Records) $137,200 Public Records
- 2003-04-30 Sold (MLS) $137,200 Cincy MLS
- 2003-03-12 Listed $132,500 Cincy MLS
- 1996-08-06 Sold (Public Records) $108,500 Public Records
- 1996-07-30 Sold (MLS) $108,500 Cincy MLS
- 1996-07-03 Listed $114,500 Cincy MLS
- 1986-12-30 Sold (Public Records) $67,500 Public Records
Property tax history
+6.1%/yrLatest (2025): $6,888 · +0.6% YoY. Source: county tax records.
Cash-flow waterfall
monthlySold comps — $/sqft
last 12 mo · ≤1 miLoading sold comps…