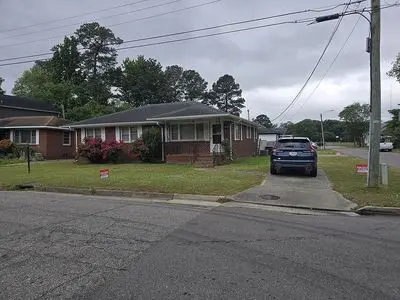
1608 Jackson Ave · Chesapeake, VA
Flood risk 6/10 · Moderate
- FEMA flood zone
- X (shaded)
- Chance of flooding over 30 yrs
- 0.69%
- Est. flood insurance / yr
- $507 – $1,088
Fire risk 1/10 · Minimal
- Est. fire insurance / yr
- $666 – $1,236
Heat risk 9/10 · Severe
- Hot days now (above 106°F)
- 7 days/yr
- Hot days in 30 yrs
- 16 days/yr
Wind risk 8/10 · Major
- Chance of severe wind over 30 yrs
- 80.0%
Air-quality risk 5/10 · Moderate
- Unhealthy air days now
- 6 days/yr
- Unhealthy air days in 30 yrs
- 7 days/yr
Risk factors via First Street. Map © Google.
Why this score? — see what drove the D grade
The composite is a weighted blend of 9 inputs, each scored 0–100. Each bar is that input's sub-score; the figure is the points it added to the 100-point composite (weight × sub-score).
- Cash flow +12.3/30.0
- ARV discount +7.6/15.0
- Schools +5.8/10.0
- DSCR +3.7/10.0
- Livability +3.5/5.0
- 1% rule +3.0/10.0
- Rent growth +2.5/5.0
- Condition / age +2.5/5.0
- Appreciation +0.0/10.0
$255,000
🖨 Deal sheet 📄 Offer letter ✓ Due diligence
Listing remarks
Corner lot with 2 driveways (6 cars) and detached 2-car garage. Partially fenced with a deck. Located next to Lakeside park and large field. Additionally, has larger utility room for W/ D and storage. New kitchen cabinets.
Key facts
- Next to park
- New kitchen cabinets
- Corner lot
Tags
Property features AI
Exterior
- Home design: Built in 1963
- Exterior features: Located in the South Norfolk subdivision
Neighborhood map
What this means for you Summary
Snapshot
- This is a 3-bed/2.0-bath single-family listed at $255k.
Deal economics
- At list price, monthly cash flow is $-47 ($-560/yr) — negative.
- To cash-flow at today's rent, offer at most $247k (3.2% below list).
- To meet the 1% rule (rent ≥ 1% of price), the offer needs to be $203k (20.4% below list).
- Recommended offer: $203k (20.4% below list) — sets the bar for 1% rule.
- Cap rate 6.1% vs local median 3.7% in Chesapeake — top-decile yield for the area; either an underpriced asset or a hidden risk that comps aren't pricing in. Stress-test before assuming the spread holds.
Location & tenants
- Location reads 70/100 on livability (#236 in VA) — a middle-class / working-renter tenant base. Strengths: employment A+, housing A+, schools A; Watch: crime C-, cost of living C-, amenities F.
- Chesapeake City Public School District (suburban): math 58% / reading 74% proficiency, ranked #31 of 131 in VA (top 24%) — acceptable for families but not a draw, mixed tenant base, ~2y average lease.
- Market conditions: 116 active listings in the ZIP; 24 comparable units currently listed for rent nearby; rentals at typical pace (median 24d on market — plan ~3-4 weeks tenant-placement turnaround); 597 units permitted in Chesapeake city in 2024 (0 in 5+ unit buildings).
- This rent runs 43% of the median local income ($57k/yr) — at the standard rent-burdened threshold; future hikes will face affordability resistance.
Forward outlook
- Local home prices are declining (-3.0%/yr); year-one equity from $2k of loan paydown is wiped out by about $8k of value loss. Plan a longer hold.
- Chesapeake County population projected at +21% by 2050 — long-run rental-demand tailwind backs the buy-and-hold thesis.
Negotiation context
- It's been on market 37 days — a 3% lower offer ($247k) is reasonable based on typical stale-listing flexibility.
- Current owner paid $18k; list at $255k implies a 1278% gain — meaningful room to come down on a strong offer.
Risks & watch-outs
- Climate carrying-cost: major flood risk; severe wind risk, 80% chance of damaging wind over 30y; extreme-heat days projected 7→16/yr by 2055 (HVAC capex compounding) — expect insurance premiums to compound above CPI over the hold.
Questions for the listing agent
- What do current leases actually rent for vs. the listed asking? Can we see a recent rent roll and the last 12 months of T-12 income?
- It's been on market 37 days. Have you received any prior offers? Is the seller open to a 20% concession, seller financing, or rate buy-down credit?
- Built in 1963 — when were the roof, HVAC, electrical panel, plumbing, and water heater last replaced?
- Is there a deadline driving the sale (1031 exchange, divorce, estate, relocation)? That informs how much negotiation room exists.
- Schools are A-rated — typically a magnet for longer-tenancy family renters. What's the average tenant stay here, and is there a school-zone premium baked into asking?
- The area grade is low — what's the realistic commute time and amenity access for the typical tenant pool here? Any planned neighborhood developments (good or bad) we should know about?
- What's the average days-on-market for RENTAL listings here right now (not sales)? A rising rental-DOM trend means longer vacancies and softer asking-rent achievability than the comps imply.
- What's the recent tenant-quality profile in this submarket — average credit score on applications, eviction rate, late-payment / NSF rate, and stable-employment percentage? A property-management company in the area should have these aggregated.
- How much new for-sale + rental construction is in the pipeline within 1–3 miles? Heavy new supply typically softens prices + rents 12–24 months out; constrained supply supports both.
Investment metrics
- 1% rule
- 0.80% ✗
- Cap rate
- 6.07%
- Cash-on-cash
- -0.78%
- DSCR
- 0.97
- GRM
- 10.5
CMA / ARV
- ARV (on-the-fly)
- $255,392
- Comps found
- 12
Show comp detail 12 sales within ~0.75 mi
| Address | Dist | Beds/Ba | Sqft | Sold | Price | $/sf | Match |
|---|---|---|---|---|---|---|---|
| 1531 Rodgers St | 0.07mi | 2/1.0 (-1) | 1,273 (-8%) | 1mo | $241,500 | $190 | 73 |
| 838 Wilbur Ave | 0.21mi | 4/2.0 (+1) | 1,500 (+8%) | 2mo | $325,500 | $217 | 70 |
| 1322 Hoover Ave | 0.38mi | 3/1.5 | 1,300 (-6%) | 3mo | $224,000 | $172 | 67 |
| 1239 Seaboard Ave | 0.37mi | 3/1.0 | 1,276 (-8%) | 2mo | $115,000 | $90 | 64 |
| 1906 Chesapeake Ave | 0.22mi | 3/1.5 | 1,567 (+13%) | 3mo | $360,000 | $230 | 64 |
| 1007 Holly Ave | 0.22mi | 3/2.0 | 1,586 (+14%) | 3mo | $282,000 | $178 | 64 |
| 1714 Seaboard Ave | 0.18mi | 3/1.0 | 1,581 (+14%) | 3mo | $243,000 | $154 | 62 |
| 1536 Bainbridge Blvd | 0.31mi | 3/1.0 | 1,233 (-11%) | 2mo | $268,000 | $217 | 61 |
| 1314 Perry St | 0.45mi | 3/2.5 | 1,524 (+10%) | 1mo | $280,000 | $184 | 60 |
| 1905 Chesapeake Ave | 0.23mi | 4/2.0 (+1) | 1,580 (+14%) | 3mo | $236,000 | $149 | 59 |
| 1232 Stewart St | 0.39mi | 3/2.0 | 1,188 (-14%) | 2mo | $190,000 | $160 | 57 |
| 2114 Mclain St | 0.46mi | 3/1.5 | 1,196 (-14%) | 4mo | $238,000 | $199 | 50 |
Match score weights: distance 35% · size 25% · config 20% · recency 20%. Top-matched comps best support the ARV.
Projected returns pro-forma
-3.0% appreciation · 3.0% rent growth · sell at horizon
- IRR
- -17.6%
- Equity multiple
- 0.38×
- Total profit
- $-44,331
- Equity at exit
- $38,021
- IRR
- -9.7%
- Equity multiple
- 0.40×
- Total profit
- $-42,587
- Equity at exit
- $22,048
Cash invested: $71,400 (down + closing). Projections, not guarantees.
Landlord ↔ Tenant lean methodology
- Overall (STATE)
- 55 Moderately Landlord-Leaning
- State Virginia
- 55 Moderately Landlord-Leaning · D+2
- County
- — inherits STATE
- City
- — inherits STATE
ZIP-level market 23324
- Home prices YoY
- -17.3%
- Active inventory
- 116
- Price-to-rent
- 10.5×
Monthly cashflow live
- Estimated rent
- $2,029 high interval (Pro) →
- Mortgage (P&I)
- −$1,337
- Tax from tax record
- −$206 /mo · $2,469/yr
- Insurance
- −$106
- HOA
- −$0
- Vacancy / Maint / Mgmt
- −$426
- Net cashflow
- $-47
Break-even live
UW: 25.0% down · 7.5% · 30yr · 1.5% tax · 5.0% vac · 8.0% maint · 8.0% mgmt
Financing live
Cash to close
- Down payment
- $63,750
- Closing costs
- $7,650
- Reserves months
- —
- Total cash needed
- —
Loan-product check · same deal, 3 products live
Conventional
25% down · 7.5% · 30yr
- Down + closing
- —
- Monthly P&I
- —
- Monthly cashflow
- —
- DSCR
- —
- Eligible?
- —
Personal DTI + credit; lowest rate.
DSCR
20% down · 8.5% · 30yr
- Down + closing
- —
- Monthly P&I
- —
- Monthly cashflow
- —
- DSCR
- —
- Eligible?
- —
No personal income docs; deal must DSCR.
Hard money
10% down · 12.0% · 12mo
- Down + closing
- —
- Monthly P&I
- —
- Monthly cashflow
- —
- DSCR
- —
- Eligible?
- —
Short-term bridge; refi at stabilization.
Rent comps 24 comps
| Address | Beds | Baths | Sqft | Rent | $/sqft | DOM | Units | Dist |
|---|---|---|---|---|---|---|---|---|
| 1110 Park Ave Chesapeake, VA | 3.0 | 2.0 | 1749 | $2,100 | $1.20 | 14d | 1 | 0.21mi |
| 1110 Park Ave Unit 23324 Chesapeake, VA | 3.0 | 2.0 | 1749 | $2,200 | $1.26 | 23d | 1 | 0.21mi |
| 1321 Chesapeake Ave Unit B Chesapeake, VA | 3.0 | 1.0 | 1000 | $1,695 | $1.70 | 23d | 1 | 0.26mi |
| 1333 Perry St Chesapeake, VA | 2.0 | 1.0 | 1048 | $1,525 | $1.46 | 23d | 1 | 0.40mi |
| 1333 Perry St Chesapeake, VA | 2.0 | 1.0 | 1048 | $1,495 | $1.43 | 14d | 1 | 0.41mi |
| 1108 Jackson Ave Chesapeake, VA | 3.0 | 2.0 | 1784 | $2,100 | $1.18 | 4d | 1 | 0.48mi |
| 1151 Perry St Chesapeake, VA | 3.0 | 1.0 | 1296 | $2,000 | $1.54 | 17d | 1 | 0.53mi |
| 900 Partridge Ave Chesapeake, VA | 3.0 | 1.5 | 1000 | $1,900 | $1.90 | 4d | 1 | 0.77mi |
| 2620 Sunrise Ave Chesapeake, VA | 3.0 | 1.5 | 1462 | $1,850 | $1.27 | 23d | 1 | 0.94mi |
| 2638 King Ct Chesapeake, VA | 3.0 | 1.5 | 1462 | $2,000 | $1.37 | 20d | 1 | 0.96mi |
| 903 Sherman Ln Norfolk, VA | 3.0 | 1.0 | 1031 | $1,850 | $1.79 | 44d | 1 | 1.13mi |
| 1535 Vine St Norfolk, VA | 3.0 | 1.5 | 992 | $2,100 | $2.12 | 44d | 1 | 1.14mi |
| 2540 Holly Point Blvd Chesapeake, VA | 1.0–3.0 | 1.0–2.0 | 1250 | $2,680 | $2.14 | 1d | 20 | 1.15mi |
| 1407 Kay Ave Chesapeake, VA | 3.0 | 1.0 | 1200 | $2,250 | $1.88 | 23d | 1 | 1.16mi |
| 1407 Kay Ave Chesapeake, VA | 3.0 | 1.0 | 1200 | $2,250 | $1.88 | 2d | 1 | 1.16mi |
| 909 E Liberty St Norfolk, VA | 3.0 | 1.0 | 1030 | $1,495 | $1.45 | 44d | 1 | 1.24mi |
| 1510 Wilson Rd Unit 1 Norfolk, VA | 3.0 | 1.0 | 1100 | $1,325 | $1.20 | 23d | 1 | 1.27mi |
| 1510 Wilson Rd Unit 3 Norfolk, VA | 3.0 | 1.0 | 1273 | $1,200 | $0.94 | 44d | 1 | 1.27mi |
| 1510 Wilson Rd #5 Norfolk, VA | 2.0 | 1.0 | 900 | $1,200 | $1.33 | 23d | 1 | 1.27mi |
| 1510 Wilson Rd #4 Norfolk, VA | 3.0 | 1.0 | 1273 | $1,400 | $1.10 | 20d | 1 | 1.27mi |
| 1512 Marsh St Norfolk, VA | 3.0 | 2.5 | 1727 | $2,195 | $1.27 | 44d | 1 | 1.31mi |
| 3406 Bainbridge Blvd Chesapeake, VA | 4.0 | 2.5 | 1792 | $2,700 | $1.51 | 23d | 1 | 1.41mi |
| 1100 Wilson Rd Norfolk, VA | 3.0 | 1.0 | 900 | $1,550 | $1.72 | 4d | 1 | 1.48mi |
| 1100 Wilson Rd Unit 7 Norfolk, VA | 3.0 | 1.5 | 900 | $1,550 | $1.72 | 7d | 1 | 1.48mi |
Listing history 15 events
-
2026-06-18days on market $255,000 Active 37 DOM
-
2026-06-17days on market $255,000 Active 36 DOM
-
2026-06-16days on market $255,000 Active 35 DOM
-
2026-06-15days on market $255,000 Active 34 DOM
-
2026-06-13days on market $255,000 Active 32 DOM
-
2026-06-09days on market $255,000 Active 28 DOM
-
2026-06-08days on market $255,000 Active 27 DOM
-
2026-06-07days on market $255,000 Active 26 DOM
-
2026-06-03days on market $255,000 Active 22 DOM
-
2026-06-02days on market $255,000 Active 21 DOM
-
2026-06-01days on market $255,000 Active 20 DOM
-
2026-05-31days on market $255,000 Active 19 DOM
-
2026-05-13price $255,000
-
2026-05-12$284,900 Active
-
1968-09-25soldstatus $18,500
ⓘ Source: listings_history table (triggers on properties + properties_extension) + one-shot
backfill from property_details.listing_events for pre-trigger history.
Tax reassessment forecast VA · Resets to sale price
- Current annual tax
- $2,469 · $206/mo
- Projected year-2 tax
- $2,469 · $206/mo
- Expected delta
- $0/yr ($0/mo · 0.0%)
ⓘ Screening estimate from a state-policy table — verify with the county assessor before closing.
Climate risk First Street
- Flood 6/10 Major FEMA zone X (shaded) · 69% chance over 30 yrs
- Wildfire 1/10 Low
- Heat 9/10 Extreme 7 d/yr ≥106°F today · 16 d/yr by 30 yrs out
- Wind 8/10 Severe 80% chance of damaging wind over 30 yrs
- Air quality 5/10 Major 6 unhealthy d/yr today · 7 by 30 yrs out
Nearby sold comps map
Loading sold comps map…
Walkable amenities ~0.75 mi
Loading nearby amenities…
Taxation est. · year 1
- Rental income
- $24,344
- − Mortgage interest
- −$14,284
- − Property taxes
- −$2,469
- − Insurance
- −$1,275
- − Repairs & maintenance
- −$1,947
- − Management
- −$1,947
- − Depreciation
- −$7,418
- Taxable loss
- −$4,998
- Est. tax savings @ 24.0%
- +$1,199
- After-tax cash flow
- $640/yr
For passive investors: Depreciation is non-cash, so a rental often shows a tax loss while cash-flowing — sheltering income. Rental losses are passive: they offset passive income freely, and up to $25,000/yr can offset ordinary (W-2) income if you actively participate and your MAGI is under $100k (phasing out to $0 by $150k); unused losses carry forward. On sale, claimed depreciation is recaptured at up to 25%, and gains may owe capital-gains tax (a 1031 exchange can defer both). Figures are a year-1 estimate at your 24.0% rate — not tax advice; consult a CPA.
Schools (NCES district)
- District
- Chesapeake City Public School District
- NCES district ID
- 5100810
- Math proficiency
- 58% ▼ -29.00%
- Reading proficiency
- 74% ▼ -7.00%
- Median HH income
- $69,356
- Composite
- 57.84/100
- National rank
- #1047
- State rank
- #31 of 131 in VA
Livability — Chesapeake
- Score
- 70/100
- State rank
- #236
- US rank
- #7942
Category grades
Schools grade is shown separately in the Schools card above.
Census & demographics
- Census place
- Chesapeake, VA
- County
- Chesapeake City · 253,091 people
- City population
- 253,091
- Metro
- Virginia Beach-Norfolk-Newport News, VA-NC
- Population (ZIP)
- 24,670
- Household income
- $57,045
- Rent vs Own
- Severe rent burden
- 1301.0
Population outlook (Chesapeake County) Hauer SSP2
- Today (2025)
- 263,804 people
- By 2030
- 276,798 · +4.9%
- By 2040
- 299,906 · +13.7%
- By 2050
- 318,284 · +20.7%
- By 2075
- 362,137 · +37.3%
- By 2100
- 372,225 · +41.1%
Race, ethnicity, and origin ACS 2023
- Neighborhood character
- Diverse neighborhood (Simpson 0.59)
- Race & ethnicity
- Black 58% White 27% Two or more races 9% Hispanic / Latino 9% Asian 1%
- Hispanic origin (detail)
- Mexican 3% Puerto Rican 4%
- Common ancestry
- Slovak 2% Italian 2% Romanian 1%
- Foreign-born
- 4% · Canada
- Languages at home
- 92% English-only · Spanish 6% French/Haitian/Cajun 1% Other Indo-European 1%
Political lean MEDSL · Chesapeake
- 2024 margin
- Toss-up / Even · D 51.3% · R 47.5% · Other 1.2%
- 2008→2024 swing
- +2.5pp toward D · 2008: 1.3pp · 2024: 3.8pp
- All cycles
- 2024: D+3.8 2020: D+6.5 2016: R+1.3 2012: D+1.1 2008: D+1.3
Not yet ingested
- Civics
- —
Market trends
- HPI YoY
- ▼ -66.73%
- Current HPI
- 319.2653
- Rent YoY
- —
- Metro
- Virginia Beach-Norfolk-Newport News, VA-NC
- State GDP YoY
- ▲ 2.40%
- F500 in state
- 50
Industry mix (Fortune 500 HQ in VA)
| Industry | F500 HQs | Revenue |
|---|---|---|
| Aerospace / Defense | 4 | $236B |
|
||
| Technology / Defense | 3 | $32B |
|
||
| Financial Services | 2 | $176B |
|
||
| Utilities | 2 | $27B |
|
||
| Insurance | 2 | $25B |
|
||
| Technology | 2 | $15B |
|
||
Price history
+1278.4% since first listed3 events — show timeline
- 2026-05-13 Price Changed $255,000 FSBO.com
- 2026-05-12 Listed $284,900 FSBO.com
- 1968-09-25 Sold (Public Records) $18,500 Public Records
Property tax history
+3.6%/yrLatest (2025): $2,469 · +10.5% YoY. Source: county tax records.
Cash-flow waterfall
monthlySold comps — $/sqft
last 12 mo · ≤1 miLoading sold comps…