 Multi-family
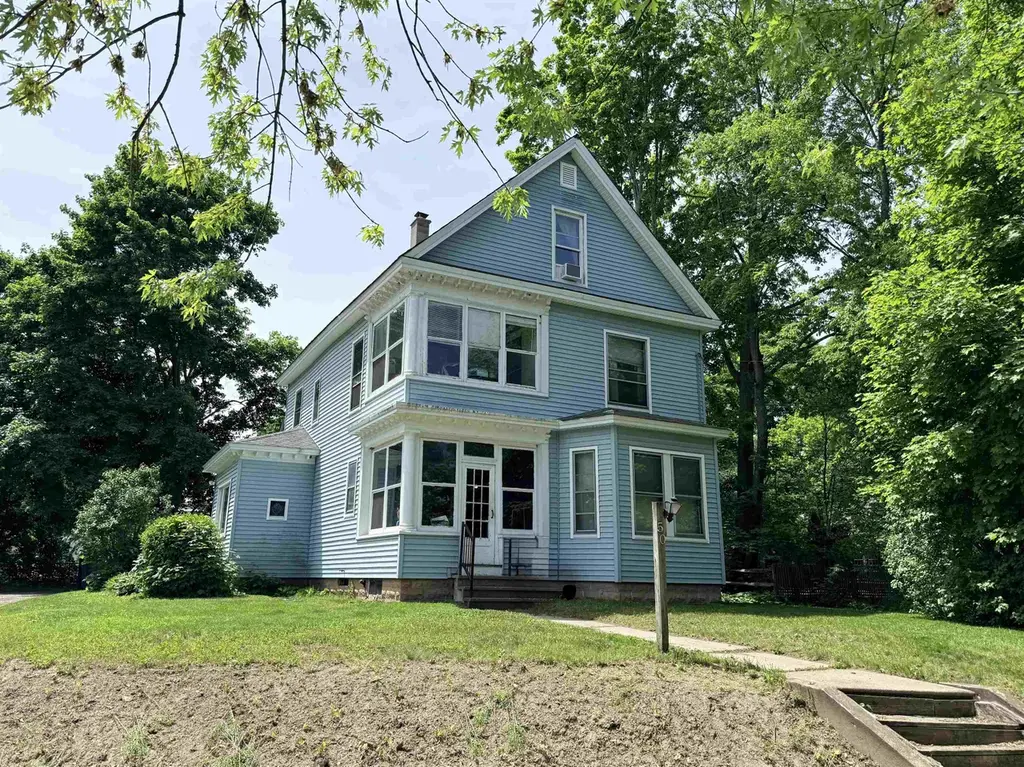
50 Oak Grove Ave · Brattleboro, VT
Flood risk 1/10 · Minimal
- FEMA flood zone
- X (unshaded)
- Chance of flooding over 30 yrs
- 0.0%
- Est. flood insurance / yr
- $473 – $860
Fire risk 1/10 · Minimal
- Est. fire insurance / yr
- $480 – $892
Heat risk 3/10 · Minor
- Hot days now (above 96°F)
- 7 days/yr
- Hot days in 30 yrs
- 18 days/yr
Wind risk 4/10 · Minor
- Chance of severe wind over 30 yrs
- 11.0%
Air-quality risk 2/10 · Minimal
- Unhealthy air days now
- 0 days/yr
- Unhealthy air days in 30 yrs
- 1 days/yr
Risk factors via First Street. Map © Google.
Why this score? — see what drove the C+ grade
The composite is a weighted blend of 9 inputs, each scored 0–100. Each bar is that input's sub-score; the figure is the points it added to the 100-point composite (weight × sub-score).
- Cash flow +29.3/30.0
- DSCR +10.0/10.0
- 1% rule +7.7/10.0
- Schools +5.0/10.0
- Livability +3.4/5.0
- ARV discount +3.0/15.0
- Rent growth +2.5/5.0
- Condition / age +2.5/5.0
- Appreciation +0.0/10.0
$350,000
🖨 Deal sheet 📄 Offer letter ✓ Due diligence
Multi-family units
County records classify this as Multi-Family (2-4 Unit). Listing-text estimate: 1 unit. estimate disagrees with records
Listing remarks
Excellent opportunity to own a three-unit investment property in a fabulous location. Enjoy being near the well-known Little League field — grab a hot dog and catch a game. Conveniently located near public transportation, the hospital, shopping, restaurants, schools, and other local amenities. The property offers a great yard set back from the road, providing both privacy and usable outdoor space. A large barn accommodates up to two vehicles and offers excellent additional storage potential. The home features low-maintenance vinyl siding, plenty of off-street parking, and strong investment potential for both owner-occupants and investors alike. Each unit has its own private entrance a
Key facts
- Near schools
- Near shopping
- Great yard
Tags
Property features AI
Finance
- Financial info: Net income reported: $22,930; Operating expenses include heat, insurance, maintenance, snow removal, and water/sewer
Exterior
- Parking: Detached or on-site parking with 2-car garage capacity
- Utilities: Public water; Public sewer; Circuit breaker electrical service; Cable internet available
- Home design: Multi-family property; Existing structure built in 1915; Blue exterior
- Construction: Wood frame construction with vinyl siding; Shingle and slate roof; Originally built in 1915
- Exterior features: City lot that is level to sloping with sidewalks; Near shopping, public transportation, hospital and schools; In-town neighborhood location; Gravel driveway
Interior
- Kitchen: Unit 1: Gas range, Refrigerator; Unit 2: Electric range, Refrigerator; Unit 3: Electric range, Refrigerator
- Bedrooms: Two-bedroom unit on level 1; One-bedroom unit on level 2; One-bedroom studio unit on level 3
- Flooring: Carpet, Vinyl, Wood
- Bathrooms: Three full bathrooms total (one in each unit)
- Heating & cooling: Oil-fired radiator heat; No central air
- Interior features: Basement with interior access, bulkhead, concrete floor, interior stairs and unfinished space
- Laundry & utility: Oil heating with radiator system
Neighborhood map
What this means for you Summary
Snapshot
- This is a 4-bed/3.0-bath multifamily listed at $350k.
Deal economics
- At list price, monthly cash flow is $1k ($15k/yr) — positive.
- The deal already cash-flows at list — no discount required.
- Meets the 1% rule at list price ($4k rent vs $350k).
- Cap rate 10.5% vs local median 4.5% in Brattleboro — top-decile yield for the area; either an underpriced asset or a hidden risk that comps aren't pricing in. Stress-test before assuming the spread holds.
Location & tenants
- Location reads 67/100 on livability (#42 in VT) — a middle-class / working-renter tenant base. Strengths: schools A+, health & safety A+, cost of living B; Watch: crime F, amenities D-, commute F.
- Market conditions: 82 active listings in the ZIP; 188 units permitted in Windham County in 2024 (0 in 5+ unit buildings).
- At $4,432/mo this rent would consume 81% of the median local household income ($66k/yr) (locally 594% of renters already pay >50% of income on rent) — very limited rent-growth headroom before tenants either downsize or default.
Forward outlook
- Local home prices are declining (-3.0%/yr); year-one equity from $2k of loan paydown is wiped out by about $10k of value loss. Plan a longer hold.
- Windham County population projected at -26% by 2050 — secular population decline; favor cash flow + early exit over multi-decade hold.
- At projected returns (-3.0% appreciation + 3.0% rent growth), your $98k cash investment doubles in ~8 years — after that, you're playing with house money.
Negotiation context
- Only 8 days on market — expect competitive offers; lowballing is unlikely to land.
- Current owner paid $245k; 43% above their basis — modest negotiation headroom, anchor on the comps not their cost.
Risks & watch-outs
- Watch-outs: built in 1915 — expect roof / HVAC / electrical / plumbing capex.
Questions for the listing agent
- Built in 1915 — when were the roof, HVAC, electrical panel, plumbing, and water heater last replaced?
- Is there a deadline driving the sale (1031 exchange, divorce, estate, relocation)? That informs how much negotiation room exists.
- Schools are A-rated — typically a magnet for longer-tenancy family renters. What's the average tenant stay here, and is there a school-zone premium baked into asking?
- Crime grade is F in this area — have there been break-ins, vandalism, or insurance claims at this property in the last 3 years? What carrier currently insures it and at what premium?
- What's the average days-on-market for RENTAL listings here right now (not sales)? A rising rental-DOM trend means longer vacancies and softer asking-rent achievability than the comps imply.
- What's the recent tenant-quality profile in this submarket — average credit score on applications, eviction rate, late-payment / NSF rate, and stable-employment percentage? A property-management company in the area should have these aggregated.
- How much new apartment / multifamily construction is in the pipeline within 1–3 miles? Heavy new supply (>2% of stock underway) typically softens rents 12–24 months out; light construction supports rent growth.
Investment metrics
- 1% rule
- 1.27% ✓
- Cap rate
- 10.52%
- Cash-on-cash
- 15.09%
- DSCR
- 1.67
- GRM
- 6.6
CMA / ARV
- ARV (on-the-fly)
- $318,388
- Comps found
- 1
Show comp detail 1 sale within ~0.75 mi
| Address | Dist | Beds/Ba | Sqft | Sold | Price | $/sf | Match |
|---|---|---|---|---|---|---|---|
| 240 S Main St | 0.20mi | 4/2.0 | 1,948 (+2%) | 20mo | $323,000 | $166 | 68 |
Match score weights: distance 35% · size 25% · config 20% · recency 20%. Top-matched comps best support the ARV.
Projected returns pro-forma
-3.0% appreciation · 3.0% rent growth · sell at horizon
- IRR
- 5.7%
- Equity multiple
- 1.22×
- Total profit
- $21,765
- Equity at exit
- $52,186
- IRR
- 15.1%
- Equity multiple
- 2.22×
- Total profit
- $119,938
- Equity at exit
- $30,262
Cash invested: $98,000 (down + closing). Projections, not guarantees.
Landlord ↔ Tenant lean methodology
- Overall (STATE)
- 41 Moderately Tenant-Leaning
- State Vermont
- 41 Moderately Tenant-Leaning · D+15
- County
- — inherits STATE
- City
- — inherits STATE
ZIP-level market 05301
- Home prices YoY
- -19.2%
- Active inventory
- 82
- Price-to-rent
- 19.7×
Monthly cashflow live
- Estimated rent
- $4,432 medium interval (Pro) →
- Mortgage (P&I)
- −$1,835
- Tax from tax record
- −$287 /mo · $3,449/yr
- Insurance
- −$146
- HOA
- −$0
- Vacancy / Maint / Mgmt
- −$931
- Net cashflow
- $1,233
Break-even live
3-unit breakdown (identical units grouped — click to expand)
| Units | Beds | Baths | Est. rent |
|---|---|---|---|
| 3× units | 2 | 1 | $4,431 |
| #1 | 2 | 1 | $1,477 |
| #2 | 2 | 1 | $1,477 |
| #3 | 2 | 1 | $1,477 |
| Total (3 units) | $4,432 | ||
UW: 25.0% down · 7.5% · 30yr · 1.5% tax · 5.0% vac · 8.0% maint · 8.0% mgmt
Financing live
Cash to close
- Down payment
- $87,500
- Closing costs
- $10,500
- Reserves months
- —
- Total cash needed
- —
Loan-product check · same deal, 3 products live
Conventional
25% down · 7.5% · 30yr
- Down + closing
- —
- Monthly P&I
- —
- Monthly cashflow
- —
- DSCR
- —
- Eligible?
- —
Personal DTI + credit; lowest rate.
DSCR
20% down · 8.5% · 30yr
- Down + closing
- —
- Monthly P&I
- —
- Monthly cashflow
- —
- DSCR
- —
- Eligible?
- —
No personal income docs; deal must DSCR.
Hard money
10% down · 12.0% · 12mo
- Down + closing
- —
- Monthly P&I
- —
- Monthly cashflow
- —
- DSCR
- —
- Eligible?
- —
Short-term bridge; refi at stabilization.
Listing history 6 events
-
2026-06-09statusdays on market $350,000 Pending 8 DOM
-
2026-06-08days on market $350,000 Active 7 DOM
-
2026-06-07days on market $350,000 Active 6 DOM
-
2026-06-03days on market $350,000 Active 2 DOM
-
2026-06-01remarks 693-char remark
-
2026-06-01$350,000 Active 1 DOM
ⓘ Source: listings_history table (triggers on properties + properties_extension) + one-shot
backfill from property_details.listing_events for pre-trigger history.
Tax reassessment forecast VT · Partial reset (capped growth)
- Current annual tax
- $3,449 · $287/mo
- Projected year-2 tax
- $5,049 · $421/mo
- Expected delta
- +$1,601/yr (+$133/mo · 46.4%)
ⓘ Screening estimate from a state-policy table — verify with the county assessor before closing.
Climate risk First Street
- Flood 1/10 Low FEMA zone X (unshaded) · 0% chance over 30 yrs
- Wildfire 1/10 Low
- Heat 3/10 Moderate 7 d/yr ≥96°F today · 18 d/yr by 30 yrs out
- Wind 4/10 Moderate 11% chance of damaging wind over 30 yrs
- Air quality 2/10 Low 0 unhealthy d/yr today · 1 by 30 yrs out
Nearby sold comps map
Loading sold comps map…
Walkable amenities ~0.75 mi
Loading nearby amenities…
Taxation est. · year 1
- Rental income
- $53,184
- − Mortgage interest
- −$19,605
- − Property taxes
- −$3,449
- − Insurance
- −$1,750
- − Repairs & maintenance
- −$4,255
- − Management
- −$4,255
- − Depreciation
- −$10,182
- Taxable income
- $9,688
- Est. tax owed @ 24.0%
- −$2,325
- After-tax cash flow
- $12,466/yr
For passive investors: Depreciation is non-cash, so a rental often shows a tax loss while cash-flowing — sheltering income. Rental losses are passive: they offset passive income freely, and up to $25,000/yr can offset ordinary (W-2) income if you actively participate and your MAGI is under $100k (phasing out to $0 by $150k); unused losses carry forward. On sale, claimed depreciation is recaptured at up to 25%, and gains may owe capital-gains tax (a 1031 exchange can defer both). Figures are a year-1 estimate at your 24.0% rate — not tax advice; consult a CPA.
Schools (NCES district)
No district data.
Livability — Brattleboro
- Score
- 67/100
- State rank
- #42
- US rank
- #10223
Category grades
Schools grade is shown separately in the Schools card above.
Census & demographics
- Census place
- Brattleboro, VT
- County
- Windham County · 16,955 people
- City population
- 16,955
- Metro
- nan
- Population (ZIP)
- 16,955
- Household income
- $65,910
- Rent vs Own
- Severe rent burden
- 594.0
Population outlook (Windham County) Hauer SSP2
- Today (2025)
- 40,432 people
- By 2030
- 38,472 · -4.8%
- By 2040
- 33,954 · -16.0%
- By 2050
- 29,774 · -26.4%
- By 2075
- 22,351 · -44.7%
- By 2100
- 15,961 · -60.5%
Race, ethnicity, and origin ACS 2023
- Neighborhood character
- Predominantly White (90%)
- Race & ethnicity
- White 90% Two or more races 6% Hispanic / Latino 3% Asian 2%
- Common ancestry
- Lithuanian 7% Romanian 5% Italian 4%
- Foreign-born
- 2% · Canada
- Languages at home
- 97% English-only · Spanish 2% Other Asian/Pacific 1%
Political lean MEDSL · Windham
- 2024 margin
- Solid D (+42.7) · D 69.6% · R 26.9% · Other 3.5%
- 2008→2024 swing
- -5.4pp toward R · 2008: 48.1pp · 2024: 42.7pp
- All cycles
- 2024: D+42.7 2020: D+47.3 2016: D+42.0 2012: D+49.2 2008: D+48.1
Not yet ingested
- Civics
- —
Market trends
- HPI YoY
- ▼ -67.19%
- Current HPI
- 283.2338
- Rent YoY
- —
- Metro
- nan
- State GDP YoY
- —
- F500 in state
- 0
Price history
+174.5% since first listed4 events — show timeline
- 2026-06-01 Listed $350,000 PrimeMLS
- 2006-06-21 Sold (Public Records) $245,000 Public Records
- 1999-08-05 Sold (Public Records) $135,000 Public Records
- 1989-01-03 Sold (Public Records) $127,500 Public Records
Property tax history
-3.9%/yrLatest (2024): $3,449 · +11.7% YoY. Source: county tax records.
Cash-flow waterfall
monthlySold comps — $/sqft
last 12 mo · ≤1 miLoading sold comps…