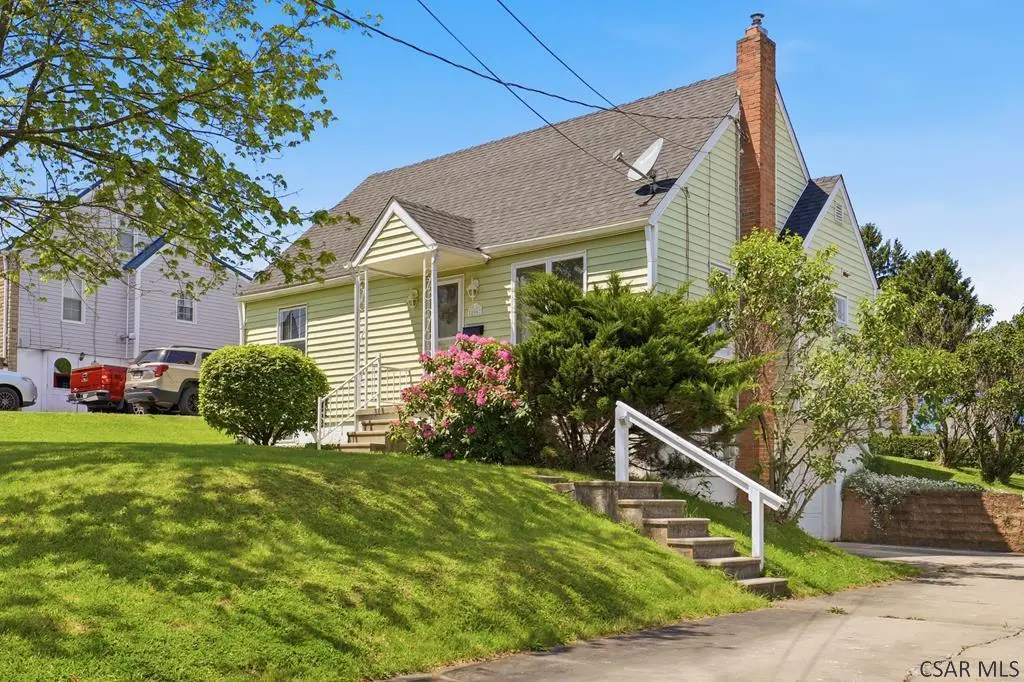
806 Freedom Ave · Belmont, PA
Flood risk 1/10 · Minimal
- FEMA flood zone
- X (unshaded)
- Chance of flooding over 30 yrs
- 0.0%
- Est. flood insurance / yr
- $473 – $860
Fire risk 1/10 · Minimal
- Est. fire insurance / yr
- $511 – $949
Heat risk 3/10 · Minor
- Hot days now (above 93°F)
- 7 days/yr
- Hot days in 30 yrs
- 17 days/yr
Wind risk 2/10 · Minimal
- Chance of severe wind over 30 yrs
- —
Air-quality risk 2/10 · Minimal
- Unhealthy air days now
- 1 days/yr
- Unhealthy air days in 30 yrs
- 2 days/yr
Risk factors via First Street. Map © Google.
Why this score? — see what drove the B- grade
The composite is a weighted blend of 9 inputs, each scored 0–100. Each bar is that input's sub-score; the figure is the points it added to the 100-point composite (weight × sub-score).
- Cash flow +25.6/30.0
- ARV discount +15.0/15.0
- DSCR +8.5/10.0
- 1% rule +6.6/10.0
- Livability +3.6/5.0
- Rent growth +2.5/5.0
- Condition / age +2.5/5.0
- Schools +1.3/10.0
- Appreciation +0.0/10.0
$84,900
🖨 Deal sheet 📄 Offer letter ✓ Due diligence
Listing remarks MLS
BELMONT AVE. THRU INTERSECTION AT BELMONT & OHIO FOLLOW BELMONT ST. RIGHT ON KRINGS TO STOP SIGN, LEFT ONTO FREEDOM AVE. , HOME ON RIGHT. VERY NICE HOME. ALL PLASTER INTERIOR, HARDWOOD FLOORS THROUGHOUT, NEW IN 1997: CONCRETE FRONT PORCH & STEPS, GARAGE DOOR, HOT WATER TANK. NEWER VINYL SIDING- NICE AREA AND YARD.
Key facts
- Shed
- Laundry area
- Full bathroom
Tags
Property features AI
Exterior
- Parking: Garage (1 car); Concrete parking surfaces
- Utilities: Public water; Public sewer / sewer available
- Home design: Single-family residence; One and one-half levels; Residential zoning; Vinyl siding
- Construction: Shingle roof
- Exterior features: Covered porch; Patio; Porch
Interior
- Kitchen: Dishwasher; Range / Oven; Refrigerator
- Bedrooms: Master on main level
- Flooring: Carpet; Vinyl
- Bathrooms: 1 full bathroom; 1 half bathroom
- Heating & cooling: Forced air heating; Natural gas heating
- Interior features: Eat-in kitchen; Master bedroom on main level; Double-pane windows
- Laundry & utility: Washer; Dryer; Laundry in basement with utility sink; Partial, unfinished basement
Neighborhood map
What this means for you Summary
Snapshot
- This is a 4-bed/1.5-bath single-family listed at $85k.
Deal economics
- At list price, monthly cash flow is $201 ($2k/yr) — positive.
- The deal already cash-flows at list — no discount required.
- Meets the 1% rule at list price ($984 rent vs $85k).
Location & tenants
- Location reads 71/100 on livability (#725 in PA) — a middle-class / working-renter tenant base. Strengths: crime A+, cost of living A+, housing A+; Watch: schools D-, amenities F, commute F.
- Greater Johnstown SD (urban): math 9% / reading 25% proficiency, ranked #509 of 539 in PA (top 94%) — low school quality limits family demand, transient renter base, plan for 1-2y turnover; 80% free/reduced lunch — lower-income household profile, screen leases tightly.
- Market conditions: 50 active listings in the ZIP; 3 comparable units currently listed for rent nearby; rentals lingering (median 44d on market — plan ~5-8 weeks vacancy on turnover, expect pricing pressure); 100% of comp listings sitting > 30 days — soft ceiling on asking rent; 64 units permitted in Cambria County in 2024 (0 in 5+ unit buildings).
Forward outlook
- Local home prices are declining (-3.0%/yr); year-one equity from $587 of loan paydown is wiped out by about $3k of value loss. Plan a longer hold.
- Cambria County population projected at -28% by 2050 — secular population decline; favor cash flow + early exit over multi-decade hold.
Negotiation context
- Only 5 days on market — expect competitive offers; lowballing is unlikely to land.
- 2 sale attempts since 26y ago with the ask held roughly flat each time — persistent listings suggest the price (not the market) is what's stuck; bring a comps-based counter.
- Current owner paid $50k; list at $85k implies a 70% gain — meaningful room to come down on a strong offer.
Risks & watch-outs
- Watch-outs: built in 1952 — expect roof / HVAC / electrical / plumbing capex.
Questions for the listing agent
- Built in 1952 — when were the roof, HVAC, electrical panel, plumbing, and water heater last replaced?
- Is there a deadline driving the sale (1031 exchange, divorce, estate, relocation)? That informs how much negotiation room exists.
- Schools are D-rated, which usually means shorter tenancies and higher turnover. Who's the typical renter profile here, and what's been the actual vacancy rate?
- What's the average days-on-market for RENTAL listings here right now (not sales)? A rising rental-DOM trend means longer vacancies and softer asking-rent achievability than the comps imply.
- What's the recent tenant-quality profile in this submarket — average credit score on applications, eviction rate, late-payment / NSF rate, and stable-employment percentage? A property-management company in the area should have these aggregated.
- How much new for-sale + rental construction is in the pipeline within 1–3 miles? Heavy new supply typically softens prices + rents 12–24 months out; constrained supply supports both.
Investment metrics
- 1% rule
- 1.16% ✓
- Cap rate
- 9.13%
- Cash-on-cash
- 10.12%
- DSCR
- 1.45
- GRM
- 7.2
CMA / ARV
- ARV (on-the-fly)
- $102,060
- Comps found
- 12
Show comp detail 12 sales within ~0.75 mi
| Address | Dist | Beds/Ba | Sqft | Sold | Price | $/sf | Match |
|---|---|---|---|---|---|---|---|
| 806 Freedom Ave | 0.00mi | 4/1.5 | 1,260 (0%) | 0mo | $105,000 | $83 | 100 |
| 824 Freedom Ave | 0.04mi | 4/1.5 | 1,271 (+1%) | 16mo | $75,000 | $59 | 84 |
| 802 Belmont St | 0.07mi | 3/1.5 (-1) | 1,227 (-3%) | 11mo | $100,100 | $82 | 79 |
| 835 Freedom Ave | 0.10mi | 3/1.5 (-1) | 1,108 (-12%) | 2mo | $126,000 | $114 | 69 |
| 217 Coldren St | 0.21mi | 4/1.0 | 1,098 (-13%) | 8mo | $89,000 | $81 | 60 |
| 157 Lohr Pl | 0.60mi | 4/1.0 | 1,183 (-6%) | 1mo | $54,250 | $46 | 59 |
| 116 Sann St | 0.63mi | 3/1.0 (-1) | 1,216 (-4%) | 1mo | $136,000 | $112 | 57 |
| 630 Belmont St | 0.23mi | 3/1.0 (-1) | 1,140 (-10%) | 20mo | $139,900 | $123 | 50 |
| 394 Ohio St | 0.62mi | 3/2.0 (-1) | 1,176 (-7%) | 7mo | $39,000 | $33 | 47 |
| 525 Woodland Ave | 0.73mi | 3/1.0 (-1) | 1,324 (+5%) | 6mo | $15,500 | $12 | 45 |
| 1226 Penrod St | 0.72mi | 3/1.5 (-1) | 1,238 (-2%) | 16mo | $79,900 | $65 | 45 |
| 328 Ohio St | 0.72mi | 3/1.0 (-1) | 1,130 (-10%) | 14mo | $47,000 | $42 | 31 |
Match score weights: distance 35% · size 25% · config 20% · recency 20%. Top-matched comps best support the ARV.
Projected returns pro-forma
-3.0% appreciation · 3.0% rent growth · sell at horizon
- IRR
- -1.1%
- Equity multiple
- 0.96×
- Total profit
- $-976
- Equity at exit
- $12,659
- IRR
- 8.6%
- Equity multiple
- 1.66×
- Total profit
- $15,634
- Equity at exit
- $7,341
Cash invested: $23,772 (down + closing). Projections, not guarantees.
Landlord ↔ Tenant lean methodology
- Overall (STATE)
- 62 Landlord-Friendly
- State Pennsylvania
- 62 Landlord-Friendly · EVEN
- County
- — inherits STATE
- City
- — inherits STATE
ZIP-level market 15904
- Active inventory
- 50
- Price-to-rent
- 7.2×
Monthly cashflow live
- Estimated rent
- $984 medium interval (Pro) →
- Mortgage (P&I)
- −$445
- Tax from tax record
- −$96 /mo · $1,157/yr
- Insurance
- −$35
- HOA
- −$0
- Vacancy / Maint / Mgmt
- −$207
- Net cashflow
- $201
Break-even live
UW: 25.0% down · 7.5% · 30yr · 1.5% tax · 5.0% vac · 8.0% maint · 8.0% mgmt
Financing live
Cash to close
- Down payment
- $21,225
- Closing costs
- $2,547
- Reserves months
- —
- Total cash needed
- —
Loan-product check · same deal, 3 products live
Conventional
25% down · 7.5% · 30yr
- Down + closing
- —
- Monthly P&I
- —
- Monthly cashflow
- —
- DSCR
- —
- Eligible?
- —
Personal DTI + credit; lowest rate.
DSCR
20% down · 8.5% · 30yr
- Down + closing
- —
- Monthly P&I
- —
- Monthly cashflow
- —
- DSCR
- —
- Eligible?
- —
No personal income docs; deal must DSCR.
Hard money
10% down · 12.0% · 12mo
- Down + closing
- —
- Monthly P&I
- —
- Monthly cashflow
- —
- DSCR
- —
- Eligible?
- —
Short-term bridge; refi at stabilization.
Rent comps 3 comps
| Address | Beds | Baths | Sqft | Rent | $/sqft | DOM | Units | Dist |
|---|---|---|---|---|---|---|---|---|
| 550 Ferndale Ave Johnstown, PA | 3.0 | 1.0 | 1300 | $1,100 | $0.85 | 43d | 1 | 1.21mi |
| 553 Vickroy Ave #555 Johnstown, PA | 3.0 | 1.0 | 1300 | $985 | $0.76 | 43d | 1 | 1.22mi |
| 522 Vickroy Ave Johnstown, PA | 3.0 | 1.0 | 1125 | $850 | $0.76 | 43d | 1 | 1.28mi |
Listing history 4 events
-
2026-05-18$84,900 Active
-
2000-05-23soldstatus $50,000 327-char remark
Show marketing remark (327 chars)
BELMONT AVE. THRU INTERSECTION AT BELMONT & OHIO FOLLOW BELMONT ST. RIGHT ON KRINGS TO STOP SIGN, LEFT ONTO FREEDOM AVE. , HOME ON RIGHT. VERY NICE HOME. ALL PLASTER INTERIOR, HARDWOOD FLOORS THROUGHOUT, NEW IN 1997: CONCRETE FRONT PORCH & STEPS, GARAGE DOOR, HOT WATER TANK. NEWER VINYL SIDING- NICE AREA AND YARD.
-
2000-05-19soldstatus $50,000
-
2000-02-22$54,000 327-char remark
Show marketing remark (327 chars)
BELMONT AVE. THRU INTERSECTION AT BELMONT & OHIO FOLLOW BELMONT ST. RIGHT ON KRINGS TO STOP SIGN, LEFT ONTO FREEDOM AVE. , HOME ON RIGHT. VERY NICE HOME. ALL PLASTER INTERIOR, HARDWOOD FLOORS THROUGHOUT, NEW IN 1997: CONCRETE FRONT PORCH & STEPS, GARAGE DOOR, HOT WATER TANK. NEWER VINYL SIDING- NICE AREA AND YARD.
ⓘ Source: listings_history table (triggers on properties + properties_extension) + one-shot
backfill from property_details.listing_events for pre-trigger history.
Tax reassessment forecast PA · Partial reset (capped growth)
- Current annual tax
- $1,157 · $96/mo
- Projected year-2 tax
- $1,249 · $104/mo
- Expected delta
- +$92/yr (+$8/mo · 8.0%)
ⓘ Screening estimate from a state-policy table — verify with the county assessor before closing.
Climate risk First Street
- Flood 1/10 Low FEMA zone X (unshaded) · 0% chance over 30 yrs
- Wildfire 1/10 Low
- Heat 3/10 Moderate 7 d/yr ≥93°F today · 17 d/yr by 30 yrs out
- Wind 2/10 Low
- Air quality 2/10 Low 1 unhealthy d/yr today · 2 by 30 yrs out
Nearby sold comps map
Loading sold comps map…
Walkable amenities ~0.75 mi
Loading nearby amenities…
Taxation est. · year 1
- Rental income
- $11,811
- − Mortgage interest
- −$4,756
- − Property taxes
- −$1,157
- − Insurance
- −$424
- − Repairs & maintenance
- −$945
- − Management
- −$945
- − Depreciation
- −$2,470
- Taxable income
- $1,114
- Est. tax owed @ 24.0%
- −$267
- After-tax cash flow
- $2,139/yr
For passive investors: Depreciation is non-cash, so a rental often shows a tax loss while cash-flowing — sheltering income. Rental losses are passive: they offset passive income freely, and up to $25,000/yr can offset ordinary (W-2) income if you actively participate and your MAGI is under $100k (phasing out to $0 by $150k); unused losses carry forward. On sale, claimed depreciation is recaptured at up to 25%, and gains may owe capital-gains tax (a 1031 exchange can defer both). Figures are a year-1 estimate at your 24.0% rate — not tax advice; consult a CPA.
Schools (NCES district)
- District
- Greater Johnstown SD
- NCES district ID
- 4210950
- Math proficiency
- 9% ▼ -6.00%
- Reading proficiency
- 25% ▼ -6.00%
- Median HH income
- $27,890
- Composite
- 13.25/100
- National rank
- #9550
- State rank
- #509 of 539 in PA
Livability — Belmont
- Score
- 71/100
- State rank
- #725
- US rank
- #7198
Category grades
Schools grade is shown separately in the Schools card above.
Census & demographics
- Census place
- Belmont, PA
- Population (ZIP)
- 16,283
Population outlook (Cambria County) Hauer SSP2
- Today (2025)
- 122,754 people
- By 2030
- 115,827 · -5.6%
- By 2040
- 101,309 · -17.5%
- By 2050
- 88,379 · -28.0%
- By 2075
- 65,237 · -46.9%
- By 2100
- 46,909 · -61.8%
Race, ethnicity, and origin ACS 2023
- Neighborhood character
- Predominantly White (93%)
- Race & ethnicity
- White 93% Two or more races 3% Hispanic / Latino 2% Black 2% Asian 1%
- Common ancestry
- Romanian 10% Slovak 2% Lithuanian 2%
- Foreign-born
- 2% · Canada
- Languages at home
- 97% English-only · Spanish 1% Other Indo-European 1%
Political lean MEDSL · Cambria
- 2024 margin
- Solid R (+39.7) · D 29.8% · R 69.5%
- 2008→2024 swing
- -40.4pp toward R · 2008: 0.7pp · 2024: -39.7pp
- All cycles
- 2024: R+39.7 2020: R+37.3 2016: R+37.8 2012: R+17.8 2008: D+0.7
Not yet ingested
- Civics
- —
Market trends
- HPI YoY
- ▼ -96.96%
- Current HPI
- 151.6715
- Rent YoY
- —
- Metro
- —
- State GDP YoY
- ▲ 1.68%
- F500 in state
- 34
Industry mix (Fortune 500 HQ in PA)
| Industry | F500 HQs | Revenue |
|---|---|---|
| Healthcare | 2 | $309B |
|
||
| Insurance | 2 | $27B |
|
||
| Telecommunications / Media | 1 | $124B |
|
||
| Industrial Distribution | 1 | $22B |
|
||
| Financial Services | 1 | $20B |
|
||
| Chemicals / Materials | 1 | $18B |
|
||
Price history
+57.2% since first listed4 events — show timeline
- 2026-05-18 Listed $84,900 CSMLS
- 2000-05-23 Sold (MLS) $50,000 CSMLS
- 2000-05-19 Sold (Public Records) $50,000 Public Records
- 2000-02-22 Listed $54,000 CSMLS
Property tax history
+0.9%/yrLatest (2026): $1,157 · +0.0% YoY. Source: county tax records.
Cash-flow waterfall
monthlySold comps — $/sqft
last 12 mo · ≤1 miLoading sold comps…