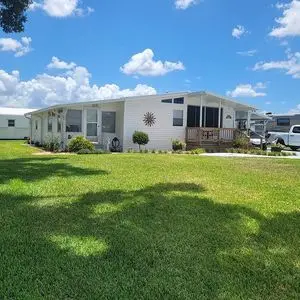
17 Century Blvd · Avon Park, FL
Flood risk 1/10 · Minimal
- FEMA flood zone
- X (unshaded)
- Chance of flooding over 30 yrs
- 0.0%
- Est. flood insurance / yr
- $507 – $1,088
Fire risk 6/10 · Moderate
- Est. fire insurance / yr
- $947 – $1,759
Heat risk 8/10 · Major
- Hot days now (above 107°F)
- 7 days/yr
- Hot days in 30 yrs
- 23 days/yr
Wind risk 9/10 · Severe
- Chance of severe wind over 30 yrs
- 99.0%
Air-quality risk 2/10 · Minimal
- Unhealthy air days now
- 2 days/yr
- Unhealthy air days in 30 yrs
- 2 days/yr
Risk factors via First Street. Map © Google.
Why this score? — see what drove the D grade
The composite is a weighted blend of 9 inputs, each scored 0–100. Each bar is that input's sub-score; the figure is the points it added to the 100-point composite (weight × sub-score).
- Cash flow +14.5/30.0
- ARV discount +7.5/15.0
- DSCR +4.4/10.0
- Schools +3.6/10.0
- Livability +3.6/5.0
- 1% rule +3.4/10.0
- Rent growth +2.5/5.0
- Condition / age +2.5/5.0
- Appreciation +0.0/10.0
$169,900
🖨 Deal sheet (PDF) 📄 Offer letter ✓ Due diligence
Listing remarks MLS
The Knoll-Century Hill is a 55+ Mobile Home Community located in Avon Park, Florida, The City of Charm. The park is quiet, with no through traffic. This home, on . 25 acre of land, has generous square footage, Metal Roof with Carport new in 2022, Generac Guardian Series whole house Generator, 11' X 24" Shed with Overhead and side door, workshop, utility area in carport, and more! 3 Ton Comfort Maker A/C System installed 2016. Central Water, Septic Sewer. 1 1/2 HP Pump for irrigation well. Front entry has convenient ramp, fully enclosed porch room, Sliding glass doors to large Living/Dining area. The Main Bedroom has a vanity/dressing area with closet, and Bathroom with Garden Tub. The guest bath off the hall is new, with a spacious walk-in shower. Across from this bath is the Washer/Dryer with folding area and plenty of cabinets! A third bedroom, or office, is just off the kitchen. There is an exterior door, offering a separate entrance to this room. Home is sold including various personal property items in home-chest freezer, misc. household items, etc. Come take a look!
Key facts
- City water
- Vinyl siding
- New roof
Tags
Neighborhood map
What this means for you Summary
Snapshot
- This is a 3-bed/2.0-bath manufactured listed at $170k.
Deal economics
- At list price, monthly cash flow is $36 ($430/yr) — positive.
- The deal already cash-flows at list — no discount required.
- To meet the 1% rule (rent ≥ 1% of price), the offer needs to be $144k (15.5% below list).
- Recommended offer: $144k (15.5% below list) — sets the bar for 1% rule.
- Cap rate 6.5% vs local median 3.8% in Avon Park — top-decile yield for the area; either an underpriced asset or a hidden risk that comps aren't pricing in. Stress-test before assuming the spread holds.
Location & tenants
- Location reads 71/100 on livability (#407 in FL) — a middle-class / working-renter tenant base. Strengths: cost of living A+, housing A+, health & safety A+; Watch: crime D+, amenities F, commute F.
- Highlands (other): math 45% / reading 43% proficiency, ranked #54 of 73 in FL (top 74%) — families likely to look elsewhere, expect single-tenant / working-renter base with shorter leases; 68% free/reduced lunch — lower-income household profile, screen leases tightly.
- Zoned schools: Sun 'N Lake Elementary School (math 63% / reading 59%, grade B, #653 of 2,144 statewide, top 31%, 618 students, 67% FRL); Avon Park Middle School (math 37% / reading 35%, grade F, #410 of 571 statewide, top 72%, 638 students, 77% FRL); Avon Park High School (math 35% / reading 39%, grade F, #340 of 667 statewide, top 52%, 928 students, 67% FRL) — zoned schools at 70% FRL track the district average.
- Market conditions: 478 active listings in the ZIP; 1 comparable units currently listed for rent nearby; 980 units permitted in Highlands County in 2024 (80 in 5+ unit buildings).
- This rent runs 37% of the median local income ($47k/yr) — at the standard rent-burdened threshold; future hikes will face affordability resistance.
Forward outlook
- Local home prices are declining (-3.0%/yr); year-one equity from $1k of loan paydown is wiped out by about $5k of value loss. Plan a longer hold.
Negotiation context
- It's been on market 18 days — a 2% lower offer ($167k) is reasonable based on typical stale-listing flexibility.
- 3 sale attempts since 2y ago with the ask held roughly flat each time — persistent listings suggest the price (not the market) is what's stuck; bring a comps-based counter.
- Current owner paid $95k; list at $170k implies a 79% gain — meaningful room to come down on a strong offer.
Risks & watch-outs
- Climate carrying-cost: severe wind risk, 99% chance of damaging wind over 30y; major wildfire risk; extreme-heat days projected 7→23/yr by 2055 (HVAC capex compounding) — expect insurance premiums to compound above CPI over the hold.
Questions for the listing agent
- Is there a deadline driving the sale (1031 exchange, divorce, estate, relocation)? That informs how much negotiation room exists.
- Schools are F-rated, which usually means shorter tenancies and higher turnover. Who's the typical renter profile here, and what's been the actual vacancy rate?
- Crime grade is D in this area — have there been break-ins, vandalism, or insurance claims at this property in the last 3 years? What carrier currently insures it and at what premium?
- The area grade is low — what's the realistic commute time and amenity access for the typical tenant pool here? Any planned neighborhood developments (good or bad) we should know about?
- What's the average days-on-market for RENTAL listings here right now (not sales)? A rising rental-DOM trend means longer vacancies and softer asking-rent achievability than the comps imply.
- What's the recent tenant-quality profile in this submarket — average credit score on applications, eviction rate, late-payment / NSF rate, and stable-employment percentage? A property-management company in the area should have these aggregated.
- How much new for-sale + rental construction is in the pipeline within 1–3 miles? Heavy new supply typically softens prices + rents 12–24 months out; constrained supply supports both.
Investment metrics
- 1% rule
- 0.84% ✗
- Cap rate
- 6.55%
- Cash-on-cash
- 0.90%
- DSCR
- 1.04
- GRM
- 9.9
CMA / ARV
- ARV (on-the-fly)
- $100,584
- Comps found
- 6
Show comp detail 6 sales within ~0.75 mi
| Address | Dist | Beds/Ba | Sqft | Sold | Price | $/sf | Match |
|---|---|---|---|---|---|---|---|
| 17 Century Blvd | 0.00mi | 3/2.0 | 1,524 (0%) | 18mo | $95,000 | $62 | 85 |
| 102 S Rally Rd | 0.15mi | 2/2.0 (-1) | 1,520 (-0%) | 14mo | $100,000 | $66 | 76 |
| 128 S Winter Cir | 0.10mi | 3/2.0 | 1,497 (-2%) | 21mo | $198,888 | $133 | 75 |
| 93 S Rally Rd | 0.14mi | 2/2.0 (-1) | 1,381 (-9%) | 2mo | $260,000 | $188 | 71 |
| 37438 Barbara Dr | 0.62mi | 2/2.0 (-1) | 1,600 (+5%) | 3mo | $65,000 | $41 | 55 |
| 1215 W Hall St | 0.69mi | 3/2.0 | 1,560 (+2%) | 14mo | $80,000 | $51 | 52 |
Match score weights: distance 35% · size 25% · config 20% · recency 20%. Top-matched comps best support the ARV.
Projected returns pro-forma
-3.0% appreciation · 3.0% rent growth · sell at horizon
- IRR
- -14.9%
- Equity multiple
- 0.47×
- Total profit
- $-25,273
- Equity at exit
- $25,333
- IRR
- -6.3%
- Equity multiple
- 0.60×
- Total profit
- $-19,170
- Equity at exit
- $14,690
Cash invested: $47,572 (down + closing). Projections, not guarantees.
Landlord ↔ Tenant lean methodology
- Overall (STATE)
- 87 Strongly Landlord-Friendly
- State Florida
- 87 Strongly Landlord-Friendly · R+3
- County
- — inherits STATE
- City
- — inherits STATE
ZIP-level market 33825
- Home prices YoY
- -25.9%
- Active inventory
- 478
- Price-to-rent
- 9.9×
Monthly cashflow live
- Estimated rent
- $1,435 medium interval (Pro) →
- Mortgage (P&I)
- −$891
- Tax from tax record
- −$136 /mo · $1,637/yr
- Insurance
- −$71
- HOA
- −$0
- Vacancy / Maint / Mgmt
- −$301
- Net cashflow
- $36
Break-even live
Sensitivity live
| Price | -10% $132 | -5% $84 | +0% $36 | +5% $-12 | +10% $-60 |
|---|---|---|---|---|---|
| Rent | -10% $-78 | -5% $-21 | +0% $36 | +5% $93 | +10% $149 |
| Rate | -1.0pp $121 | -0.5pp $79 | base $36 | +0.5pp $-8 | +1.0pp $-53 |
UW: 25.0% down · 7.5% · 30yr · 1.5% tax · 5.0% vac · 8.0% maint · 8.0% mgmt
Financing live
Cash to close
- Down payment
- $42,475
- Closing costs
- $5,097
- Reserves months
- —
- Total cash needed
- —
Loan-product check · same deal, 3 products live
Conventional
25% down · 7.5% · 30yr
- Down + closing
- —
- Monthly P&I
- —
- Monthly cashflow
- —
- DSCR
- —
- Eligible?
- —
Personal DTI + credit; lowest rate.
DSCR
20% down · 8.5% · 30yr
- Down + closing
- —
- Monthly P&I
- —
- Monthly cashflow
- —
- DSCR
- —
- Eligible?
- —
No personal income docs; deal must DSCR.
Hard money
10% down · 12.0% · 12mo
- Down + closing
- —
- Monthly P&I
- —
- Monthly cashflow
- —
- DSCR
- —
- Eligible?
- —
Short-term bridge; refi at stabilization.
Rent comps 1 comps
| Address | Beds | Baths | Sqft | Rent | $/sqft | DOM | Units | Dist |
|---|---|---|---|---|---|---|---|---|
| 565 Luminary LOOP Avon Park, FL | 2.0–3.0 | 1.5–2.0 | 1142 | $1,140 | $1.00 | 25d | 6 | 1.40mi |
Listing history 12 events
-
2026-06-21days on market $169,900 Active 18 DOM
-
2026-06-19days on market $169,900 Active 16 DOM
-
2026-06-18days on market $169,900 Active 15 DOM
-
2026-06-17days on market $169,900 Active 14 DOM
-
2026-06-16days on market $169,900 Active 13 DOM
-
2026-06-15days on market $169,900 Active 12 DOM
-
2026-06-14days on market $169,900 Active 10 DOM
-
2026-06-10days on market $169,900 Active 7 DOM
-
2026-06-09days on market $169,900 Active 6 DOM
-
2026-06-08days on market $169,900 Active 5 DOM
-
2026-06-07remarks 387-char remark
-
2026-06-07$169,900 Active 4 DOM
ⓘ Source: listings_history table (triggers on properties + properties_extension) + one-shot
backfill from property_details.listing_events for pre-trigger history.
Tax reassessment forecast FL · Resets to sale price
- Current annual tax
- $1,637 · $136/mo
- Projected year-2 tax
- $1,637 · $136/mo
- Expected delta
- $0/yr ($0/mo · 0.0%)
ⓘ Screening estimate from a state-policy table — verify with the county assessor before closing.
Climate risk First Street
- Flood 1/10 Low FEMA zone X (unshaded) · 0% chance over 30 yrs
- Wildfire 6/10 Major
- Heat 8/10 Severe 7 d/yr ≥107°F today · 23 d/yr by 30 yrs out
- Wind 9/10 Extreme 99% chance of damaging wind over 30 yrs
- Air quality 2/10 Low 2 unhealthy d/yr today · 2 by 30 yrs out
Nearby sold comps map
Loading sold comps map…
Walkable amenities ~0.75 mi
Loading nearby amenities…
Taxation est. · year 1
- Rental income
- $17,226
- − Mortgage interest
- −$9,517
- − Property taxes
- −$1,637
- − Insurance
- −$850
- − Repairs & maintenance
- −$1,378
- − Management
- −$1,378
- − Depreciation
- −$4,943
- Taxable loss
- −$2,477
- Est. tax savings @ 24.0%
- +$594
- After-tax cash flow
- $1,024/yr
For passive investors: Depreciation is non-cash, so a rental often shows a tax loss while cash-flowing — sheltering income. Rental losses are passive: they offset passive income freely, and up to $25,000/yr can offset ordinary (W-2) income if you actively participate and your MAGI is under $100k (phasing out to $0 by $150k); unused losses carry forward. On sale, claimed depreciation is recaptured at up to 25%, and gains may owe capital-gains tax (a 1031 exchange can defer both). Figures are a year-1 estimate at your 24.0% rate — not tax advice; consult a CPA.
Schools (NCES district)
- District
- Highlands
- NCES district ID
- 1200840
- Math proficiency
- 45% ▼ -7.00%
- Reading proficiency
- 43% ▼ -3.00%
- Median HH income
- $35,276
- Composite
- 36.42/100
- National rank
- #4672
- State rank
- #54 of 73 in FL
Livability — Avon Park
- Score
- 71/100
- State rank
- #407
- US rank
- #7205
Category grades
Schools grade is shown separately in the Schools card above.
Census & demographics
- County
- Highlands County · 98,898 people
- City population
- 25,501
- Metro
- Sebring-Avon Park, FL
- Population (ZIP)
- 25,501
- Household income
- $46,949
- Rent vs Own
- Severe rent burden
- 691.0
Population outlook (Highlands County) Hauer SSP2
- Today (2025)
- 99,674 people
- By 2030
- 99,615 · -0.1%
- By 2040
- 99,342 · -0.3%
- By 2050
- 98,242 · -1.4%
- By 2075
- 93,291 · -6.4%
- By 2100
- 79,894 · -19.8%
Race, ethnicity, and origin ACS 2023
- Neighborhood character
- Diverse neighborhood (Simpson 0.64)
- Race & ethnicity
- White 51% Hispanic / Latino 27% Black 17% Two or more races 11% Asian 1%
- Hispanic origin (detail)
- Mexican 8% Puerto Rican 13% Cuban 2%
- Common ancestry
- Slovak 2% Lithuanian 2% Iranian 1%
- Foreign-born
- 10% · Canada, Vietnam, Guatemala
- Languages at home
- 74% English-only · Spanish 24% Tagalog/Filipino 1%
Political lean MEDSL · Highlands
- 2024 margin
- Solid R (+40.8) · D 29.3% · R 70.1%
- 2008→2024 swing
- -22.7pp toward R · 2008: -18.1pp · 2024: -40.8pp
- All cycles
- 2024: R+40.8 2020: R+34.4 2016: R+32.0 2012: R+23.0 2008: R+18.1
Not yet ingested
- Civics
- —
Market trends
- HPI YoY
- ▼ -98.54%
- Current HPI
- 281.8067
- Rent YoY
- —
- Metro
- Sebring-Avon Park, FL
- State GDP YoY
- ▲ 3.28%
- F500 in state
- 36
Industry mix (Fortune 500 HQ in FL)
| Industry | F500 HQs | Revenue |
|---|---|---|
| Industrial Technology | 2 | $29B |
|
||
| Insurance | 2 | $17B |
|
||
| Retail | 1 | $60B |
|
||
| Technology Distribution | 1 | $58B |
|
||
| Homebuilding | 1 | $35B |
|
||
| Technology Manufacturing | 1 | $35B |
|
||
Price history
+3.0% since first listed11 events — show timeline
- 2026-06-04 Listed $169,900 FSBO.com
- 2024-12-19 Sold (Public Records) $95,000 Public Records
- 2024-12-10 Sold (MLS) $95,000 HAOR as distributed by MLS GRID
- 2024-11-11 Contingent — HAOR as distributed by MLS GRID
- 2024-09-16 Price Changed $115,000 HAOR as distributed by MLS GRID
- 2024-07-23 Relisted — HAOR as distributed by MLS GRID
- 2024-07-11 Contingent — HAOR as distributed by MLS GRID
- 2024-07-11 Price Changed $125,000 HAOR as distributed by MLS GRID
- 2024-06-26 Price Changed $139,900 HAOR as distributed by MLS GRID
- 2024-05-23 Price Changed $154,900 HAOR as distributed by MLS GRID
- 2024-05-11 Listed $165,000 HAOR as distributed by MLS GRID
Property tax history
+19.7%/yrLatest (2025): $1,637 · -2.1% YoY. Source: county tax records.
Cash-flow waterfall
monthlySold comps — $/sqft
last 12 mo · ≤1 miLoading sold comps…