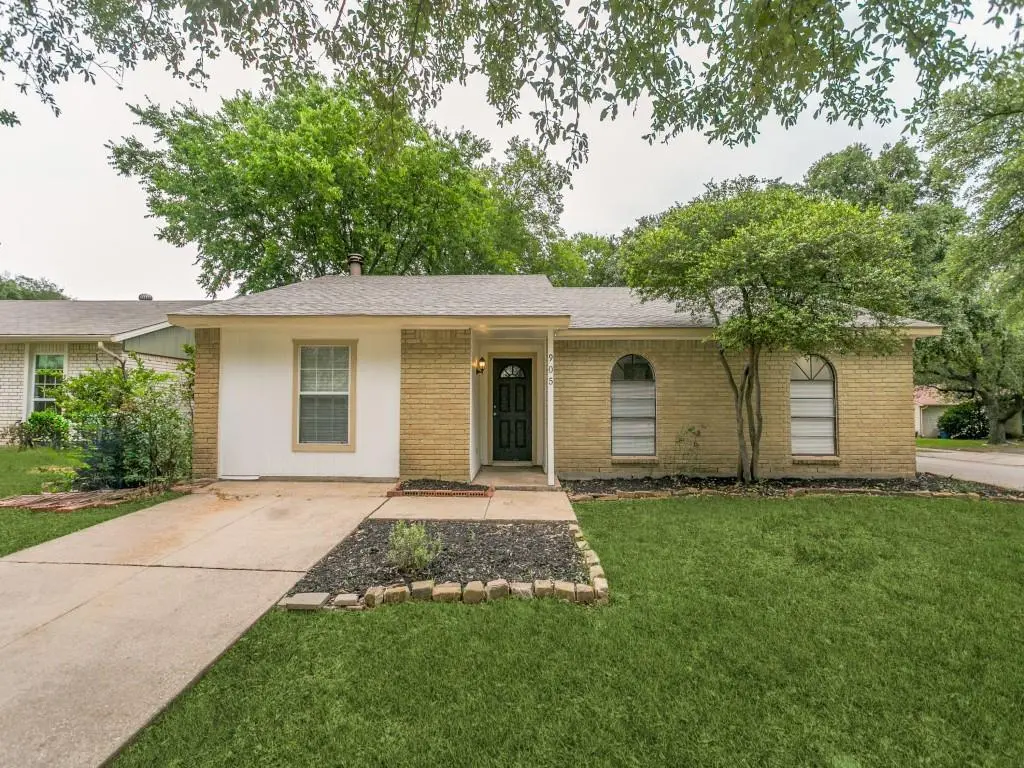
905 Hawthorne Dr · Allen, TX
Flood risk 1/10 · Minimal
- FEMA flood zone
- X (unshaded)
- Chance of flooding over 30 yrs
- 0.0%
- Est. flood insurance / yr
- $507 – $1,088
Fire risk 4/10 · Minor
- Est. fire insurance / yr
- $1,222 – $2,270
Heat risk 7/10 · Major
- Hot days now (above 110°F)
- 7 days/yr
- Hot days in 30 yrs
- 23 days/yr
Wind risk 6/10 · Moderate
- Chance of severe wind over 30 yrs
- 27.0%
Air-quality risk 4/10 · Minor
- Unhealthy air days now
- 4 days/yr
- Unhealthy air days in 30 yrs
- 5 days/yr
Risk factors via First Street. Map © Google.
Why this score? — see what drove the D grade
The composite is a weighted blend of 9 inputs, each scored 0–100. Each bar is that input's sub-score; the figure is the points it added to the 100-point composite (weight × sub-score).
- Cash flow +11.0/30.0
- ARV discount +9.2/15.0
- Schools +5.8/10.0
- Livability +4.0/5.0
- 1% rule +3.4/10.0
- DSCR +3.2/10.0
- Condition / age +2.5/5.0
- Rent growth +1.5/5.0
- Appreciation +0.0/10.0
$279,900
🖨 Deal sheet 📄 Offer letter ✓ Due diligence
Listing remarks MLS
Reduced again! $1000 buyers agency bonus so bring your offers, this property is a great value, improved, upgrades to the kitchen, fresh paind and carpet. Garage converted to large family room. On tax roles at 1288sqft, actual according to owner is 1588sqft, buyer must verify. corner lot.
Key facts
- 6,534 sq ft lot
- Built 1975
- Listed 48 days
Property features AI
Finance
- Financial info: Listing accepted cash, conventional, and FHA financing
- HOA & community: No homeowners association
Exterior
- Parking: Driveway
- Utilities: City water; City sewer; Electricity available; Cable available
- Home design: Single-family residence; Residential property; Built in 1975; Preowned; Not attached to another property
- Construction: Brick and siding exterior; Composition roof; Slab foundation
- Exterior features: Corner lot; Interior lot; Few trees; Chain link fencing; No dock permitted
Interior
- Kitchen: Dishwasher; Disposal; Electric cooktop; Electric oven
- Bedrooms: 4 bedrooms (all on main level); primary bedroom on main level
- Flooring: Luxury vinyl plank
- Bathrooms: 2 full bathrooms
- Heating & cooling: Central heating; Central air conditioning; Wood-burning fireplace
- Interior features: Open floorplan; Cable TV available; High-speed internet available; Walk-in closet(s); 7 total rooms; 1 living area; 1 dining area; One-level layout
- Laundry & utility: Electric dryer hookup
Neighborhood map
What this means for you Summary
Snapshot
- This is a 4-bed/2.0-bath single-family listed at $280k.
Deal economics
- At list price, monthly cash flow is $-117 ($-1k/yr) — negative.
- To cash-flow at today's rent, offer at most $259k (7.4% below list).
- To meet the 1% rule (rent ≥ 1% of price), the offer needs to be $236k (15.7% below list).
- Recommended offer: $236k (15.7% below list) — sets the bar for 1% rule.
- Cap rate 5.8% vs local median 2.6% in Allen — top-decile yield for the area; either an underpriced asset or a hidden risk that comps aren't pricing in. Stress-test before assuming the spread holds.
Location & tenants
- Location reads 80/100 on livability (#34 in TX, #1,678 nationally) — a professional / high-income tenant draw. Strengths: crime A+, employment A+, housing A+; Watch: cost of living C-, commute F.
- Allen ISD (suburban): math 64% / reading 63% proficiency, ranked #22 of 826 in TX (top 3%) — acceptable for families but not a draw, mixed tenant base, ~2y average lease; only 16% free/reduced lunch — higher-income household profile.
- Zoned schools: Alton Boyd El (math 32% / reading 31%, grade F, #2,396 of 4,322 statewide, top 56%, 572 students, 69% FRL) — zoned schools average 69% FRL vs 16% district-wide (53 pts higher); higher-poverty schools than district average — tighter screening recommended.
- Zoned-school proficiency averages 32% at this address vs 64% district-wide (-32 pts) — the specific schools serving this property underperform the Allen ISD average; the district grade overstates school quality for this exact location.
- Market conditions: Rents falling (-3.9%/yr); 509 active listings in the ZIP; 40 comparable units currently listed for rent nearby; rentals at typical pace (median 21d on market — plan ~3-4 weeks tenant-placement turnaround); high-income renter base; 19,194 units permitted in Collin County in 2024 (3,988 in 5+ unit buildings).
Forward outlook
- Local home prices are declining (-3.0%/yr); year-one equity from $2k of loan paydown is wiped out by about $8k of value loss. Plan a longer hold.
- Collin County population projected at +60% by 2050 — long-run rental-demand tailwind backs the buy-and-hold thesis.
Negotiation context
- It's been on market 49 days — a 3% lower offer ($272k) is reasonable based on typical stale-listing flexibility.
- 6 sale attempts since 20y ago with the ask held roughly flat each time — persistent listings suggest the price (not the market) is what's stuck; bring a comps-based counter.
Risks & watch-outs
- Climate carrying-cost: major wind risk, 27% chance of damaging wind over 30y; extreme-heat days projected 7→23/yr by 2055 (HVAC capex compounding) — expect insurance premiums to compound above CPI over the hold.
Questions for the listing agent
- What do current leases actually rent for vs. the listed asking? Can we see a recent rent roll and the last 12 months of T-12 income?
- It's been on market 49 days. Have you received any prior offers? Is the seller open to a 16% concession, seller financing, or rate buy-down credit?
- Built in 1975 — when were the roof, HVAC, electrical panel, plumbing, and water heater last replaced?
- Is there a deadline driving the sale (1031 exchange, divorce, estate, relocation)? That informs how much negotiation room exists.
- Schools are A-rated — typically a magnet for longer-tenancy family renters. What's the average tenant stay here, and is there a school-zone premium baked into asking?
- The area grade is low — what's the realistic commute time and amenity access for the typical tenant pool here? Any planned neighborhood developments (good or bad) we should know about?
- What's the average days-on-market for RENTAL listings here right now (not sales)? A rising rental-DOM trend means longer vacancies and softer asking-rent achievability than the comps imply.
- What's the recent tenant-quality profile in this submarket — average credit score on applications, eviction rate, late-payment / NSF rate, and stable-employment percentage? A property-management company in the area should have these aggregated.
- How much new for-sale + rental construction is in the pipeline within 1–3 miles? Heavy new supply typically softens prices + rents 12–24 months out; constrained supply supports both.
Investment metrics
- 1% rule
- 0.84% ✗
- Cap rate
- 5.79%
- Cash-on-cash
- -1.80%
- DSCR
- 0.92
- GRM
- 9.9
CMA / ARV
- ARV (median comp)
- $290,781
- List price
- $279,900
- Delta
- -3.74%
- Verdict
- FAIR
- Comps
- 20 within 1.0 mi
Show comp detail 12 sales within ~0.75 mi
| Address | Dist | Beds/Ba | Sqft | Sold | Price | $/sf | Match |
|---|---|---|---|---|---|---|---|
| 524 Oldbridge Dr | 0.14mi | 3/2.0 (-1) | 1,304 (+1%) | 1mo | $289,900 | $222 | 85 |
| 534 Windsor Dr | 0.20mi | 3/2.0 (-1) | 1,303 (+1%) | 2mo | $279,990 | $215 | 82 |
| 509 Hanover Dr | 0.25mi | 3/2.0 (-1) | 1,303 (+1%) | 1mo | $330,000 | $253 | 81 |
| 566 Cumberland Dr | 0.28mi | 3/2.0 (-1) | 1,304 (+1%) | 1mo | $299,000 | $229 | 79 |
| 543 Hightrail Dr | 0.22mi | 3/2.0 (-1) | 1,260 (-2%) | 5mo | $339,000 | $269 | 77 |
| 551 Hanover Dr | 0.32mi | 3/2.0 (-1) | 1,380 (+7%) | 2mo | $300,000 | $217 | 66 |
| 31 Brewster Ct | 0.47mi | 3/1.5 (-1) | 1,260 (-2%) | 3mo | $295,000 | $234 | 65 |
| 516 Ridgemont Dr | 0.34mi | 3/2.0 (-1) | 1,380 (+7%) | 3mo | $329,900 | $239 | 65 |
| 527 English Oak Dr | 0.42mi | 3/1.0 (-1) | 1,338 (+4%) | 3mo | $289,000 | $216 | 63 |
| 506 Scarlet Oak Dr | 0.33mi | 4/2.0 | 1,461 (+13%) | 2mo | $329,000 | $225 | 61 |
| 1214 Collin Dr | 0.48mi | 3/2.0 (-1) | 1,160 (-10%) | 2mo | $300,000 | $259 | 54 |
| 560 Guadalupe Dr | 0.55mi | 3/2.0 (-1) | 1,426 (+11%) | 0mo | $274,999 | $193 | 51 |
Match score weights: distance 35% · size 25% · config 20% · recency 20%. Top-matched comps best support the ARV.
Projected returns pro-forma
-3.0% appreciation · 0.0% rent growth · sell at horizon
- IRR
- -22.7%
- Equity multiple
- 0.24×
- Total profit
- $-59,675
- Equity at exit
- $41,734
- IRR
- -27.8%
- Equity multiple
- -0.12×
- Total profit
- $-88,035
- Equity at exit
- $24,201
Cash invested: $78,372 (down + closing). Projections, not guarantees.
Landlord ↔ Tenant lean methodology
- Overall (STATE)
- 87 Strongly Landlord-Friendly
- State Texas
- 87 Strongly Landlord-Friendly · R+5
- County
- — inherits STATE
- City
- — inherits STATE
ZIP-level market 75002
- Home prices YoY
- -26.5%
- Rents YoY
- -3.9%
- Active inventory
- 509
- Price-to-rent
- 9.9×
Monthly cashflow live
- Estimated rent
- $2,358 high interval (Pro) →
- Mortgage (P&I)
- −$1,468
- Tax from tax record
- −$396 /mo · $4,750/yr
- Insurance
- −$117
- HOA
- −$0
- Vacancy / Maint / Mgmt
- −$495
- Net cashflow
- $-117
Break-even live
UW: 25.0% down · 7.5% · 30yr · 1.5% tax · 5.0% vac · 8.0% maint · 8.0% mgmt
Financing live
Cash to close
- Down payment
- $69,975
- Closing costs
- $8,397
- Reserves months
- —
- Total cash needed
- —
Loan-product check · same deal, 3 products live
Conventional
25% down · 7.5% · 30yr
- Down + closing
- —
- Monthly P&I
- —
- Monthly cashflow
- —
- DSCR
- —
- Eligible?
- —
Personal DTI + credit; lowest rate.
DSCR
20% down · 8.5% · 30yr
- Down + closing
- —
- Monthly P&I
- —
- Monthly cashflow
- —
- DSCR
- —
- Eligible?
- —
No personal income docs; deal must DSCR.
Hard money
10% down · 12.0% · 12mo
- Down + closing
- —
- Monthly P&I
- —
- Monthly cashflow
- —
- DSCR
- —
- Eligible?
- —
Short-term bridge; refi at stabilization.
Rent comps 40 comps
| Address | Beds | Baths | Sqft | Rent | $/sqft | DOM | Units | Dist |
|---|---|---|---|---|---|---|---|---|
| 507 Cumberland Dr Allen, TX | 3.0 | 2.0 | 1340 | $2,000 | $1.49 | 24d | 1 | 0.02mi |
| 516 Northridge Dr Allen, TX | 3.0 | 2.0 | 1304 | $2,150 | $1.65 | 20d | 1 | 0.04mi |
| 516 Northridge Dr Allen, TX | 3.0 | 2.0 | 1304 | $2,150 | $1.65 | 24d | 1 | 0.04mi |
| 510 Cumberland Dr Allen, TX | 3.0 | 2.0 | 1259 | $2,050 | $1.63 | 43d | 1 | 0.05mi |
| 522 Hawthorne Dr Allen, TX | 4.0 | 2.0 | 1625 | $1,995 | $1.23 | 11d | 1 | 0.14mi |
| 534 Oldbridge Dr Allen, TX | 3.0 | 2.0 | 1304 | $2,000 | $1.53 | 7d | 1 | 0.15mi |
| 530 Hightrail Dr Allen, TX | 3.0 | 2.0 | 1259 | $1,900 | $1.51 | 20d | 1 | 0.16mi |
| 546 Cumberland Dr Allen, TX | 3.0 | 2.0 | 1304 | $1,950 | $1.50 | 43d | 1 | 0.19mi |
| 551 Hightrail Dr Allen, TX | 3.0 | 2.0 | 1549 | $2,100 | $1.36 | 24d | 1 | 0.28mi |
| 563 Cumberland Dr Allen, TX | 3.0 | 2.0 | 1293 | $2,000 | $1.55 | 5d | 1 | 0.30mi |
| 556 Hawthorne Dr Allen, TX | 3.0 | 2.0 | 1292 | $1,995 | $1.54 | 24d | 1 | 0.31mi |
| 500 Scarlet Oak Dr Allen, TX | 3.0 | 2.0 | 1421 | $2,200 | $1.55 | 43d | 1 | 0.32mi |
| 556 Hanover Dr Allen, TX | 3.0 | 2.0 | 1380 | $2,049 | $1.48 | 5d | 1 | 0.34mi |
| 565 Bell Dr Allen, TX | 3.0 | 2.0 | 1360 | $4,900 | $3.60 | 1d | 1 | 0.36mi |
| 558 Ridgemont Dr Allen, TX | 3.0 | 2.0 | 1708 | $2,500 | $1.46 | 7d | 1 | 0.38mi |
| 1108 Collin Dr Allen, TX | 3.0 | 2.0 | 1642 | $5,700 | $3.47 | 1d | 1 | 0.38mi |
| 556 Freestone Dr Allen, TX | 3.0 | 2.0 | 1521 | $2,150 | $1.41 | 24d | 1 | 0.45mi |
| 547 Guadalupe Dr Allen, TX | 3.0 | 2.0 | 1861 | $2,340 | $1.26 | 24d | 1 | 0.47mi |
| 547 Guadalupe Dr Allen, TX | 3.0 | 2.0 | 1861 | $2,340 | $1.26 | 12d | 1 | 0.47mi |
| 810 Fairlawn St Allen, TX | 3.0 | 2.0 | 1651 | $2,145 | $1.30 | 43d | 1 | 0.51mi |
| 524 White Oak St Allen, TX | 3.0 | 2.0 | 1717 | $2,195 | $1.28 | 44d | 1 | 0.51mi |
| 610 Willow Oak St Allen, TX | 3.0 | 2.0 | 1480 | $2,350 | $1.59 | 43d | 1 | 0.57mi |
| 738 Ridgemont Dr Allen, TX | 3.0 | 2.0 | 1840 | $2,300 | $1.25 | 2d | 1 | 0.65mi |
| 563 Eiseley Dr Allen, TX | 3.0 | 2.5 | 1844 | $2,600 | $1.41 | 20d | 1 | 0.65mi |
| 1541 Collin Dr Allen, TX | 3.0 | 2.5 | 1342 | $2,275 | $1.70 | 43d | 1 | 0.65mi |
| 1648 Jude Dr Allen, TX | 3.0 | 2.5 | 1844 | $3,000 | $1.63 | 18d | 1 | 0.67mi |
| 1655 Chasen Dr Allen, TX | 3.0 | 2.5 | 1844 | $2,550 | $1.38 | 3d | 1 | 0.68mi |
| 1621 Collin Dr Allen, TX | 3.0 | 2.5 | 1476 | $2,100 | $1.42 | 18d | 1 | 0.69mi |
| 1280 Montgomery Blvd Allen, TX | 1.0–3.0 | 1.0–2.0 | 1059 | $2,876 | $2.71 | 2d | 25 | 0.74mi |
| 935 Garden Park Dr Allen, TX | 1.0–3.0 | 1.0–2.0 | 1095 | $2,890 | $2.64 | 2d | 34 | 0.77mi |
| 1175 Montgomery Blvd Allen, TX | 1.0–3.0 | 1.0–2.0 | 1063 | $2,434 | $2.29 | 1d | 35 | 0.88mi |
| 1165 Montgomery Blvd Allen, TX | 3.0 | 2.0 | 1380 | $3,254 | $2.36 | 24d | 1 | 0.97mi |
| 1165 Montgomery Blvd Unit 1198 Allen, TX | 3.0 | 2.0 | 1380 | $3,017 | $2.19 | 43d | 1 | 0.97mi |
| 1165 Montgomery Blvd Unit 3118 Allen, TX | 3.0 | 2.0 | 1380 | $2,989 | $2.17 | 3d | 1 | 0.97mi |
| 1160 Montgomery Blvd Allen, TX | 1.0–3.0 | 1.0–3.0 | 1064 | $2,550 | $2.40 | 1d | 24 | 0.98mi |
| 629 Park Place Dr Allen, TX | 3.0 | 2.5 | 1783 | $2,245 | $1.26 | 22d | 1 | 1.14mi |
| 606 Valley View Dr Allen, TX | 3.0 | 2.0 | 1424 | $2,000 | $1.40 | 43d | 1 | 1.15mi |
| 302 Young Dr Allen, TX | 3.0 | 1.5 | 958 | $1,975 | $2.06 | 20d | 1 | 1.20mi |
| 325 S Jupiter Rd Allen, TX | 1.0–3.0 | 1.0–2.0 | 986 | $2,140 | $2.17 | 1d | 26 | 1.21mi |
| 600 Bel Air Dr Allen, TX | 3.0 | 2.0 | 1814 | $2,550 | $1.41 | 43d | 1 | 1.27mi |
Listing history 33 events
-
2026-06-18days on market $279,900 Active 49 DOM
-
2026-06-17days on market $279,900 Active 48 DOM
-
2026-06-16days on market $279,900 Active 47 DOM
-
2026-06-15days on market $279,900 Active 46 DOM
-
2026-06-13days on market $279,900 Active 44 DOM
-
2026-06-13days on market $279,900 Active 43 DOM
-
2026-06-09days on market $279,900 Active 40 DOM
-
2026-06-08days on market $279,900 Active 39 DOM
-
2026-06-07days on market $279,900 Active 38 DOM
-
2026-06-04days on market $279,900 Active 35 DOM
-
2026-06-03days on market $279,900 Active 34 DOM
-
2026-06-02days on market $279,900 Active 33 DOM
-
2026-06-01days on market $279,900 Active 32 DOM
-
2026-05-31days on market $279,900 Active 31 DOM
-
2026-04-30$279,900 Active 388-char remark
-
2012-07-18soldstatus
-
2012-06-27status Pending 288-char remark
Show marketing remark (288 chars)
Reduced again! $1000 buyers agency bonus so bring your offers, this property is a great value, improved, upgrades to the kitchen, fresh paind and carpet. Garage converted to large family room. On tax roles at 1288sqft, actual according to owner is 1588sqft, buyer must verify. corner lot.
-
2012-06-12soldstatus Closed 288-char remark
Show marketing remark (288 chars)
Reduced again! $1000 buyers agency bonus so bring your offers, this property is a great value, improved, upgrades to the kitchen, fresh paind and carpet. Garage converted to large family room. On tax roles at 1288sqft, actual according to owner is 1588sqft, buyer must verify. corner lot.
-
2012-05-22price $93,600 288-char remark
Show marketing remark (288 chars)
Reduced again! $1000 buyers agency bonus so bring your offers, this property is a great value, improved, upgrades to the kitchen, fresh paind and carpet. Garage converted to large family room. On tax roles at 1288sqft, actual according to owner is 1588sqft, buyer must verify. corner lot.
-
2012-05-02status Active 288-char remark
Show marketing remark (288 chars)
Reduced again! $1000 buyers agency bonus so bring your offers, this property is a great value, improved, upgrades to the kitchen, fresh paind and carpet. Garage converted to large family room. On tax roles at 1288sqft, actual according to owner is 1588sqft, buyer must verify. corner lot.
-
2012-04-30historical 288-char remark
Show marketing remark (288 chars)
Reduced again! $1000 buyers agency bonus so bring your offers, this property is a great value, improved, upgrades to the kitchen, fresh paind and carpet. Garage converted to large family room. On tax roles at 1288sqft, actual according to owner is 1588sqft, buyer must verify. corner lot.
-
2012-01-29$97,500 Active 288-char remark
Show marketing remark (288 chars)
Reduced again! $1000 buyers agency bonus so bring your offers, this property is a great value, improved, upgrades to the kitchen, fresh paind and carpet. Garage converted to large family room. On tax roles at 1288sqft, actual according to owner is 1588sqft, buyer must verify. corner lot.
-
2012-01-08historical
-
2011-10-07$99,000 Active
-
2011-09-16historical
-
2011-07-05price $108,000
-
2011-03-13$117,300 Active
-
2006-08-10soldstatus
-
2006-07-03historical
-
2006-06-17$64,000
-
2000-10-13soldstatus
-
2000-10-13soldstatus
-
2000-10-13soldstatus
ⓘ Source: listings_history table (triggers on properties + properties_extension) + one-shot
backfill from property_details.listing_events for pre-trigger history.
Tax reassessment forecast TX · Resets to sale price
- Current annual tax
- $4,750 · $396/mo
- Projected year-2 tax
- $5,122 · $427/mo
- Expected delta
- +$372/yr (+$31/mo · 7.8%)
ⓘ Screening estimate from a state-policy table — verify with the county assessor before closing.
Climate risk First Street
- Flood 1/10 Low FEMA zone X (unshaded) · 0% chance over 30 yrs
- Wildfire 4/10 Moderate
- Heat 7/10 Severe 7 d/yr ≥110°F today · 23 d/yr by 30 yrs out
- Wind 6/10 Major 27% chance of damaging wind over 30 yrs
- Air quality 4/10 Moderate 4 unhealthy d/yr today · 5 by 30 yrs out
Nearby sold comps map
Loading sold comps map…
Walkable amenities ~0.75 mi
Loading nearby amenities…
Taxation est. · year 1
- Rental income
- $28,298
- − Mortgage interest
- −$15,679
- − Property taxes
- −$4,750
- − Insurance
- −$1,400
- − Repairs & maintenance
- −$2,264
- − Management
- −$2,264
- − Depreciation
- −$8,143
- Taxable loss
- −$6,200
- Est. tax savings @ 24.0%
- +$1,488
- After-tax cash flow
- $80/yr
For passive investors: Depreciation is non-cash, so a rental often shows a tax loss while cash-flowing — sheltering income. Rental losses are passive: they offset passive income freely, and up to $25,000/yr can offset ordinary (W-2) income if you actively participate and your MAGI is under $100k (phasing out to $0 by $150k); unused losses carry forward. On sale, claimed depreciation is recaptured at up to 25%, and gains may owe capital-gains tax (a 1031 exchange can defer both). Figures are a year-1 estimate at your 24.0% rate — not tax advice; consult a CPA.
Schools (NCES district)
- District
- Allen ISD
- NCES district ID
- 4807890
- Math proficiency
- 64% ▼ -12.00%
- Reading proficiency
- 63% ▼ -9.00%
- Median HH income
- $96,635
- Composite
- 58.45/100
- National rank
- #1004
- State rank
- #22 of 826 in TX
Livability — Allen
- Score
- 80/100
- State rank
- #34
- US rank
- #1678
Category grades
Schools grade is shown separately in the Schools card above.
Census & demographics
- Census place
- Allen, TX
- County
- Collin County · 1,159,394 people
- City population
- 124,853
- Metro
- Dallas-Fort Worth-Arlington, TX
- Population (ZIP)
- 75,057
- Household income
- $137,037
- Rent vs Own
- Severe rent burden
- 1624.0
Population outlook (Collin County) Hauer SSP2
- Today (2025)
- 1,210,074 people
- By 2030
- 1,358,201 · +12.2%
- By 2040
- 1,654,061 · +36.7%
- By 2050
- 1,937,359 · +60.1%
- By 2075
- 2,567,039 · +112.1%
- By 2100
- 2,952,048 · +144.0%
Race, ethnicity, and origin ACS 2023
- Neighborhood character
- Diverse neighborhood (Simpson 0.64)
- Race & ethnicity
- White 56% Black 13% Hispanic / Latino 12% Asian 11% Two or more races 11%
- Hispanic origin (detail)
- Mexican 8%
- Common ancestry
- Romanian 3% Slovak 2% Serbian 2%
- Foreign-born
- 17% · Canada, China, Vietnam
- Languages at home
- 77% English-only · Spanish 8% Other Indo-European 5% Chinese 2%
Political lean MEDSL · Collin
- 2024 margin
- R (+11.1) · D 43.1% · R 54.3% · Other 2.6%
- 2008→2024 swing
- +14.4pp toward D · 2008: -25.6pp · 2024: -11.1pp
- All cycles
- 2024: R+11.1 2020: R+4.3 2016: R+17.0 2012: R+31.6 2008: R+25.6
Not yet ingested
- Civics
- —
Market trends
- HPI YoY
- ▼ -95.74%
- Current HPI
- 265.6632
- Rent YoY
- ▼ -3.86%
- Metro
- Dallas-Fort Worth-Arlington, TX
- State GDP YoY
- ▲ 3.95%
- F500 in state
- 110
Industry mix (Fortune 500 HQ in TX)
| Industry | F500 HQs | Revenue |
|---|---|---|
| Energy | 16 | $1,198B |
|
||
| Technology | 5 | $198B |
|
||
| Engineering / Construction | 4 | $72B |
|
||
| Energy Services | 3 | $60B |
|
||
| Utilities | 3 | $41B |
|
||
| Healthcare | 2 | $330B |
|
||
Price history
+337.3% since first listed19 events — show timeline
- 2026-04-30 Listed $279,900 NTREIS
- 2012-07-18 Sold (Public Records) — Public Records
- 2012-06-27 Pending — NTREIS
- 2012-06-12 Sold (MLS) — NTREIS
- 2012-05-22 Price Changed $93,600 NTREIS
- 2012-05-02 Relisted — NTREIS
- 2012-04-30 Listing Removed — NTREIS
- 2012-01-29 Listed $97,500 NTREIS
- 2012-01-08 Listing Removed — NTREIS
- 2011-10-07 Listed $99,000 NTREIS
- 2011-09-16 Listing Removed — NTREIS
- 2011-07-05 Price Changed $108,000 NTREIS
- 2011-03-13 Listed $117,300 NTREIS
- 2006-08-10 Sold (MLS) — NTREIS
- 2006-07-03 Listing Removed — NTREIS
- 2006-06-17 Listed $64,000 NTREIS
- 2000-10-13 Sold (Public Records) — Public Records
- 2000-10-13 Sold (Public Records) — Public Records
- 2000-10-13 Sold (Public Records) — Public Records
Property tax history
+5.9%/yrLatest (2025): $4,750 · +5.4% YoY. Source: county tax records.
Cash-flow waterfall
monthlySold comps — $/sqft
last 12 mo · ≤1 miLoading sold comps…