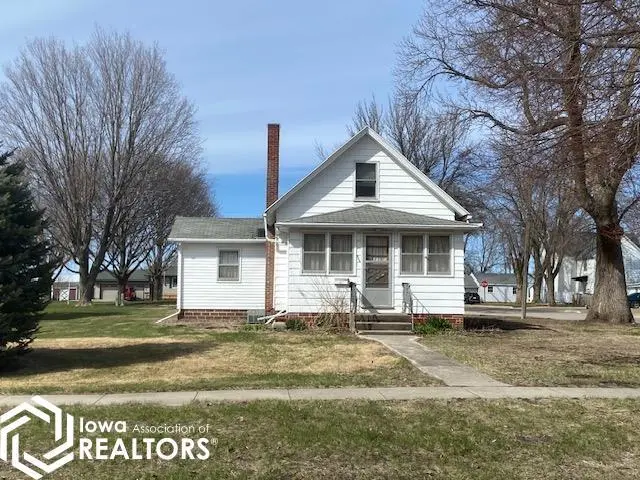
326 1st St NW · Britt, IA
Flood risk 1/10 · Minimal
- FEMA flood zone
- X (unshaded)
- Chance of flooding over 30 yrs
- 0.0%
- Est. flood insurance / yr
- $473 – $860
Fire risk 1/10 · Minimal
- Est. fire insurance / yr
- $902 – $1,676
Heat risk 2/10 · Minimal
- Hot days now (above 99°F)
- 7 days/yr
- Hot days in 30 yrs
- 16 days/yr
Wind risk 2/10 · Minimal
- Chance of severe wind over 30 yrs
- —
Air-quality risk 1/10 · Minimal
- Unhealthy air days now
- 0 days/yr
- Unhealthy air days in 30 yrs
- 0 days/yr
Risk factors via First Street. Map © Google.
Why this score? — see what drove the A grade
The composite is a weighted blend of 9 inputs, each scored 0–100. Each bar is that input's sub-score; the figure is the points it added to the 100-point composite (weight × sub-score).
- Cash flow +30.0/30.0
- ARV discount +15.0/15.0
- DSCR +10.0/10.0
- Appreciation +10.0/10.0
- 1% rule +8.6/10.0
- Schools +6.3/10.0
- Livability +4.0/5.0
- Rent growth +2.5/5.0
- Condition / age +2.5/5.0
$67,500
🖨 Deal sheet (PDF) 📄 Offer letter ✓ Due diligence
Listing remarks MLS
Corner Lot with Triple Garage. . This 2 bedroom home has all the appliances included, large upper bedroom, main level laundry and cozy front porch. Full basement includes shower, toilet & sink, water softener and 100amp breaker box. House needs a little TLC and is being sold in "AS IS" condition.
Key facts
- 8,276 sq ft lot
- 3 garage spots
- Built 1875
Neighborhood map
What this means for you Summary
Snapshot
- This is a 2-bed/1.5-bath single-family listed at $68k.
Deal economics
- At list price, monthly cash flow is $260 ($3k/yr) — positive.
- The deal already cash-flows at list — no discount required.
- Meets the 1% rule at list price ($919 rent vs $68k).
- Recommended offer: $65k (3.0% below list) — sets the bar for market timing.
Location & tenants
- Location reads 79/100 on livability (#121 in IA, #2,262 nationally) — a middle-class / working-renter tenant base. Strengths: crime A+, cost of living A+, housing A+; Watch: amenities F, commute F.
- West Hancock Community School District (rural): math 76% / reading 74% proficiency, ranked #77 of 289 in IA (top 27%) — strong family-tenant draw, lease renewals of 3-5y typical.
- Market conditions: 22 active listings in the ZIP; 11 units permitted in Hancock County in 2024 (0 in 5+ unit buildings).
Forward outlook
- In year one you build about $7k of equity ($467 loan paydown + $7k appreciation (10.0% local appreciation)).
- Hancock County population projected at -14% by 2050 — secular population decline; favor cash flow + early exit over multi-decade hold.
- At projected returns (10.0% appreciation + 3.0% rent growth), your $19k cash investment doubles in ~2 years — after that, you're playing with house money.
- By year 5, paydown + projected appreciation supports a ~$34k cash-out refi (75% LTV) — recoverable capital for the next deal without selling this one.
Negotiation context
- It's been on market 58 days — a 3% lower offer ($65k) is reasonable based on typical stale-listing flexibility.
- 3 sale attempts since 10y ago with the ask held roughly flat each time — persistent listings suggest the price (not the market) is what's stuck; bring a comps-based counter.
- Current owner paid $34k; list at $68k implies a 96% gain — meaningful room to come down on a strong offer.
Risks & watch-outs
- Watch-outs: built in 1875 — expect roof / HVAC / electrical / plumbing capex.
Questions for the listing agent
- It's been on market 58 days. Have you received any prior offers? Is the seller open to a 3% concession, seller financing, or rate buy-down credit?
- Built in 1875 — when were the roof, HVAC, electrical panel, plumbing, and water heater last replaced?
- Is there a deadline driving the sale (1031 exchange, divorce, estate, relocation)? That informs how much negotiation room exists.
- Schools are B-rated — typically a magnet for longer-tenancy family renters. What's the average tenant stay here, and is there a school-zone premium baked into asking?
- What's the average days-on-market for RENTAL listings here right now (not sales)? A rising rental-DOM trend means longer vacancies and softer asking-rent achievability than the comps imply.
- What's the recent tenant-quality profile in this submarket — average credit score on applications, eviction rate, late-payment / NSF rate, and stable-employment percentage? A property-management company in the area should have these aggregated.
- How much new for-sale + rental construction is in the pipeline within 1–3 miles? Heavy new supply typically softens prices + rents 12–24 months out; constrained supply supports both.
Investment metrics
- 1% rule
- 1.36% ✓
- Cap rate
- 10.91%
- Cash-on-cash
- 16.50%
- DSCR
- 1.73
- GRM
- 6.1
CMA / ARV
- ARV (median comp)
- $94,678
- List price
- $67,500
- Delta
- -28.71%
- Verdict
- UNDERPRICED
- Comps
- 20 within 1.0 mi
Show comp detail 12 sales within ~0.75 mi
| Address | Dist | Beds/Ba | Sqft | Sold | Price | $/sf | Match |
|---|---|---|---|---|---|---|---|
| 326 1st St NW | 0.00mi | 2/1.0 | 975 (0%) | 0mo | $60,000 | $62 | 98 |
| 358 2nd St NW | 0.06mi | 2/1.0 | 828 (-15%) | 9mo | $69,000 | $83 | 63 |
| 660 2nd St SW | 0.28mi | 3/1.0 (+1) | 1,008 (+3%) | 17mo | $97,000 | $96 | 60 |
| 364 4th St SW | 0.32mi | 3/1.0 (+1) | 880 (-10%) | 6mo | $50,000 | $57 | 56 |
| 465 2nd Ave SW | 0.38mi | 2/2.0 | 832 (-15%) | 9mo | $170,000 | $204 | 48 |
| 114 5th St SE | 0.47mi | 2/1.0 | 1,088 (+12%) | 17mo | $95,000 | $87 | 43 |
| 619 Main Ave S | 0.52mi | 2/1.0 | 1,116 (+14%) | 9mo | $75,000 | $67 | 42 |
| 830 5th Ave SW | 0.60mi | 3/1.0 (+1) | 1,092 (+12%) | 5mo | $160,000 | $147 | 41 |
| 325 & 355 Diagonal St NE | 0.43mi | 2/1.5 | 840 (-14%) | 19mo | $105,000 | $125 | 41 |
| 585 6th Ave SE | 0.74mi | 2/1.0 | 911 (-7%) | 16mo | $129,000 | $142 | 39 |
| 416 6th St SW | 0.44mi | 2/2.0 | 1,120 (+15%) | 17mo | $133,000 | $119 | 38 |
| 545 1st St SE | 0.57mi | 3/1.5 (+1) | 880 (-10%) | 20mo | $42,000 | $48 | 36 |
Match score weights: distance 35% · size 25% · config 20% · recency 20%. Top-matched comps best support the ARV.
Projected returns pro-forma
10.0% appreciation · 3.0% rent growth · sell at horizon
- IRR
- 36.5%
- Equity multiple
- 3.82×
- Total profit
- $53,326
- Equity at exit
- $60,809
- IRR
- 31.4%
- Equity multiple
- 8.62×
- Total profit
- $144,049
- Equity at exit
- $131,138
Cash invested: $18,900 (down + closing). Projections, not guarantees.
Landlord ↔ Tenant lean methodology
- Overall (STATE)
- 83 Strongly Landlord-Friendly
- State Iowa
- 83 Strongly Landlord-Friendly · R+6
- County
- — inherits STATE
- City
- — inherits STATE
ZIP-level market 50423
- Home prices YoY
- 8.2%
- Active inventory
- 22
- Price-to-rent
- 6.1×
Monthly cashflow live
- Estimated rent
- $919 medium interval (Pro) →
- Mortgage (P&I)
- −$354
- Tax est. 1.5%
- −$84 /mo · $1,012/yr
- Insurance
- −$28
- HOA
- −$0
- Vacancy / Maint / Mgmt
- −$193
- Net cashflow
- $260
Break-even live
Sensitivity live
| Price | -10% $306 | -5% $283 | +0% $260 | +5% $237 | +10% $213 |
|---|---|---|---|---|---|
| Rent | -10% $187 | -5% $224 | +0% $260 | +5% $296 | +10% $332 |
| Rate | -1.0pp $294 | -0.5pp $277 | base $260 | +0.5pp $242 | +1.0pp $225 |
UW: 25.0% down · 7.5% · 30yr · 1.5% tax · 5.0% vac · 8.0% maint · 8.0% mgmt
Financing live
Cash to close
- Down payment
- $16,875
- Closing costs
- $2,025
- Reserves months
- —
- Total cash needed
- —
Loan-product check · same deal, 3 products live
Conventional
25% down · 7.5% · 30yr
- Down + closing
- —
- Monthly P&I
- —
- Monthly cashflow
- —
- DSCR
- —
- Eligible?
- —
Personal DTI + credit; lowest rate.
DSCR
20% down · 8.5% · 30yr
- Down + closing
- —
- Monthly P&I
- —
- Monthly cashflow
- —
- DSCR
- —
- Eligible?
- —
No personal income docs; deal must DSCR.
Hard money
10% down · 12.0% · 12mo
- Down + closing
- —
- Monthly P&I
- —
- Monthly cashflow
- —
- DSCR
- —
- Eligible?
- —
Short-term bridge; refi at stabilization.
Listing history 13 events
-
2026-06-07statusdays on market $67,500 Pending 58 DOM
-
2026-06-04days on market $67,500 Active Under Contract 57 DOM
-
2026-06-02days on market $67,500 Active Under Contract 56 DOM
-
2026-06-01days on market $67,500 Active Under Contract 55 DOM
-
2026-05-31days on market $67,500 Active Under Contract 54 DOM
-
2026-05-31days on market $67,500 Active Under Contract 53 DOM
-
2026-05-13historical Active Under Contract 313-char remark
Show marketing remark (313 chars)
Corner Lot with Triple Garage. . This 2 bedroom home has all the appliances included, large upper bedroom, main level laundry and cozy front porch. Full basement includes shower, toilet & sink, water softener and 100amp breaker box. House needs a little TLC and is being sold in "AS IS" condition.
-
2026-04-20status Active 313-char remark
Show marketing remark (313 chars)
Corner Lot with Triple Garage. . This 2 bedroom home has all the appliances included, large upper bedroom, main level laundry and cozy front porch. Full basement includes shower, toilet & sink, water softener and 100amp breaker box. House needs a little TLC and is being sold in "AS IS" condition.
-
2026-04-08historical Active Under Contract 313-char remark
Show marketing remark (313 chars)
Corner Lot with Triple Garage. . This 2 bedroom home has all the appliances included, large upper bedroom, main level laundry and cozy front porch. Full basement includes shower, toilet & sink, water softener and 100amp breaker box. House needs a little TLC and is being sold in "AS IS" condition.
-
2026-04-07$67,500 Active 313-char remark
Show marketing remark (313 chars)
Corner Lot with Triple Garage. . This 2 bedroom home has all the appliances included, large upper bedroom, main level laundry and cozy front porch. Full basement includes shower, toilet & sink, water softener and 100amp breaker box. House needs a little TLC and is being sold in "AS IS" condition.
-
2016-08-29soldstatus $34,500 97-char remark
Show marketing remark (97 chars)
2 bdrm, 1 bath home on corner lot. Triple Garage for that car enthusiast or extra workshop space!
-
2016-07-15$37,000 97-char remark
Show marketing remark (97 chars)
2 bdrm, 1 bath home on corner lot. Triple Garage for that car enthusiast or extra workshop space!
-
2008-01-09soldstatus $44,000
ⓘ Source: listings_history table (triggers on properties + properties_extension) + one-shot
backfill from property_details.listing_events for pre-trigger history.
Climate risk First Street
- Flood 1/10 Low FEMA zone X (unshaded) · 0% chance over 30 yrs
- Wildfire 1/10 Low
- Heat 2/10 Low 7 d/yr ≥99°F today · 16 d/yr by 30 yrs out
- Wind 2/10 Low
- Air quality 1/10 Low 0 unhealthy d/yr today · 0 by 30 yrs out
Nearby sold comps map
Loading sold comps map…
Walkable amenities ~0.75 mi
Loading nearby amenities…
Taxation est. · year 1
- Rental income
- $11,033
- − Mortgage interest
- −$3,781
- − Property taxes
- −$1,012
- − Insurance
- −$338
- − Repairs & maintenance
- −$883
- − Management
- −$883
- − Depreciation
- −$1,964
- Taxable income
- $2,173
- Est. tax owed @ 24.0%
- −$521
- After-tax cash flow
- $2,597/yr
For passive investors: Depreciation is non-cash, so a rental often shows a tax loss while cash-flowing — sheltering income. Rental losses are passive: they offset passive income freely, and up to $25,000/yr can offset ordinary (W-2) income if you actively participate and your MAGI is under $100k (phasing out to $0 by $150k); unused losses carry forward. On sale, claimed depreciation is recaptured at up to 25%, and gains may owe capital-gains tax (a 1031 exchange can defer both). Figures are a year-1 estimate at your 24.0% rate — not tax advice; consult a CPA.
Schools (NCES district)
- District
- West Hancock Community School District
- NCES district ID
- 1905430
- Math proficiency
- 76% ▼ -5.00%
- Reading proficiency
- 74% ▼ -1.00%
- Median HH income
- $46,779
- Composite
- 63.22/100
- National rank
- #634
- State rank
- #77 of 289 in IA
Livability — Britt
- Score
- 79/100
- State rank
- #121
- US rank
- #2262
Category grades
Schools grade is shown separately in the Schools card above.
Census & demographics
- Census place
- Britt, IA
- Population (ZIP)
- 2,401
Population outlook (Hancock County) Hauer SSP2
- Today (2025)
- 10,462 people
- By 2030
- 10,154 · -2.9%
- By 2040
- 9,552 · -8.7%
- By 2050
- 9,034 · -13.6%
- By 2075
- 8,233 · -21.3%
- By 2100
- 7,050 · -32.6%
Race, ethnicity, and origin ACS 2023
- Neighborhood character
- Predominantly White (86%)
- Race & ethnicity
- White 86% Hispanic / Latino 9% Two or more races 2% Asian 2%
- Hispanic origin (detail)
- Mexican 9%
- Common ancestry
- Portuguese 11% Iranian 6% Lithuanian 1%
- Foreign-born
- 4% · Canada
- Languages at home
- 95% English-only · Spanish 3% Vietnamese 1% Russian/Polish/Slavic 1%
Political lean MEDSL · Hancock
- 2024 margin
- Solid R (+47.4) · D 25.7% · R 73.1% · Other 1.2%
- 2008→2024 swing
- -43.8pp toward R · 2008: -3.6pp · 2024: -47.4pp
- All cycles
- 2024: R+47.4 2020: R+43.9 2016: R+41.1 2012: R+13.6 2008: R+3.6
Not yet ingested
- Civics
- —
Market trends
- HPI YoY
- ▲ 18.61%
- Current HPI
- 245.6369
- Rent YoY
- —
- Metro
- —
- State GDP YoY
- ▲ 2.48%
- F500 in state
- 4
Industry mix (Fortune 500 HQ in IA)
| Industry | F500 HQs | Revenue |
|---|---|---|
| Financial Services | 1 | $16B |
|
||
| Retail / Convenience | 1 | $15B |
|
||
Price history
+53.4% since first listed7 events — show timeline
- 2026-05-13 Contingent — IAR
- 2026-04-20 Relisted — IAR
- 2026-04-08 Contingent — IAR
- 2026-04-07 Listed $67,500 IAR
- 2016-08-29 Sold (MLS) $34,500 IAR
- 2016-07-15 Listed $37,000 IAR
- 2008-01-09 Sold (Public Records) $44,000 Public Records
Property tax history
-9.3%/yrLatest (2025): $122 · -44.5% YoY. Source: county tax records.
Cash-flow waterfall
monthlySold comps — $/sqft
last 12 mo · ≤1 miLoading sold comps…