 Multi-family
None · Kettering, OH
Flood risk 1/10 · Minimal
- FEMA flood zone
- X (unshaded)
- Chance of flooding over 30 yrs
- 0.0%
- Est. flood insurance / yr
- $507 – $1,088
Fire risk 1/10 · Minimal
- Est. fire insurance / yr
- $713 – $1,323
Heat risk 3/10 · Minor
- Hot days now (above 100°F)
- 7 days/yr
- Hot days in 30 yrs
- 18 days/yr
Wind risk 2/10 · Minimal
- Chance of severe wind over 30 yrs
- 0.0%
Air-quality risk 3/10 · Minor
- Unhealthy air days now
- 3 days/yr
- Unhealthy air days in 30 yrs
- 5 days/yr
Risk factors via First Street. Map © Google.
Why this score? — see what drove the B- grade
The composite is a weighted blend of 9 inputs, each scored 0–100. Each bar is that input's sub-score; the figure is the points it added to the 100-point composite (weight × sub-score).
- Cash flow +21.7/30.0
- ARV discount +14.0/15.0
- DSCR +6.9/10.0
- 1% rule +5.9/10.0
- Schools +5.2/10.0
- Rent growth +5.0/5.0
- Livability +4.2/5.0
- Condition / age +2.5/5.0
- Appreciation +0.0/10.0
$210,000
🖨 Deal sheet 📄 Offer letter ✓ Due diligence
Multi-family units
County records classify this as Multi-Family (2-4 Unit). Listing-text estimate: 1 unit. estimate disagrees with records
Listing remarks MLS
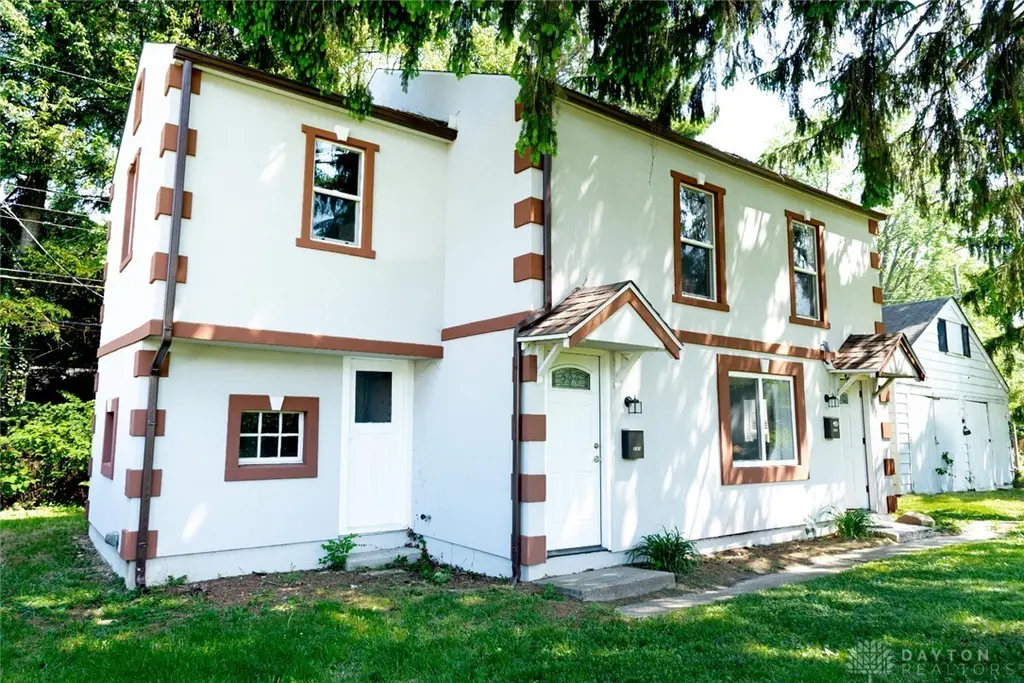
This versatile home is already classified as a two-family property, offering excellent potential to convert it into two rental units. It is currently used as a residential home featuring 3 rooms, 1 full bathroom, and 1 half bathroom. Property is "sold as is". Upgraded roof replaced by the insurance at the end of 2023. Stucco external wall recently done. Convenient laundry area with easy access, ideal for future duplex configuration uses. Bamboo flooring, granite kitchen counter and good windows.
Key facts
- Garage
- Built 1948
- Listed 21 days
Property features AI
Exterior
- Parking: Detached garage; 1 garage space
- Utilities: Public water; Public sewer
- Home design: Single family residence; Two levels; No common walls; Built in 1948
- Exterior features: Block foundation
Interior
- Bathrooms: 2 full bathrooms; 1 half bathroom (2.5 total bathrooms)
- Interior features: Living area of 1,412
Neighborhood map
What this means for you Summary
Snapshot
- This is a 3-bed/2.0-bath multifamily listed at $210k.
Deal economics
- At list price, monthly cash flow is $321 ($4k/yr) — positive.
- The deal already cash-flows at list — no discount required.
- Meets the 1% rule at list price ($2k rent vs $210k).
- Recommended offer: $207k (1.5% below list) — sets the bar for market timing.
- Cap rate 8.1% vs local median 4.4% in Kettering — top-decile yield for the area; either an underpriced asset or a hidden risk that comps aren't pricing in. Stress-test before assuming the spread holds.
Location & tenants
- Location reads 83/100 on livability (#61 in OH, #922 nationally) — a professional / high-income tenant draw. Strengths: schools A+, crime A+, cost of living A+; Watch: commute F.
- Kettering City School District (suburban): math 54% / reading 68% proficiency, ranked #277 of 656 in OH (top 42%) — acceptable for families but not a draw, mixed tenant base, ~2y average lease.
- Market conditions: Rents rising fast (+10.8%/yr); 53 active listings in the ZIP; 10 comparable units currently listed for rent nearby; rentals at typical pace (median 15d on market — plan ~3-4 weeks tenant-placement turnaround); solid renter incomes; 907 units permitted in Montgomery County in 2024 (416 in 5+ unit buildings).
- This rent runs 31% of the median local income ($87k/yr) — at the standard rent-burdened threshold; future hikes will face affordability resistance.
Forward outlook
- Local home prices are declining (-3.0%/yr); year-one equity from $1k of loan paydown is wiped out by about $6k of value loss. Plan a longer hold.
- Montgomery County population projected at -10% by 2050 — secular population decline; favor cash flow + early exit over multi-decade hold.
- At projected returns (-3.0% appreciation + 8.0% rent growth), your $59k cash investment doubles in ~9 years — after that, you're playing with house money.
Negotiation context
- It's been on market 21 days — a 2% lower offer ($207k) is reasonable based on typical stale-listing flexibility.
- 3 sale attempts since 2y ago with the ask held roughly flat each time — persistent listings suggest the price (not the market) is what's stuck; bring a comps-based counter.
- Current owner paid $80k; list at $210k implies a 162% gain — meaningful room to come down on a strong offer.
Risks & watch-outs
- Watch-outs: built in 1948 — expect roof / HVAC / electrical / plumbing capex.
Questions for the listing agent
- Built in 1948 — when were the roof, HVAC, electrical panel, plumbing, and water heater last replaced?
- Is there a deadline driving the sale (1031 exchange, divorce, estate, relocation)? That informs how much negotiation room exists.
- Schools are A-rated — typically a magnet for longer-tenancy family renters. What's the average tenant stay here, and is there a school-zone premium baked into asking?
- What's the average days-on-market for RENTAL listings here right now (not sales)? A rising rental-DOM trend means longer vacancies and softer asking-rent achievability than the comps imply.
- What's the recent tenant-quality profile in this submarket — average credit score on applications, eviction rate, late-payment / NSF rate, and stable-employment percentage? A property-management company in the area should have these aggregated.
- How much new apartment / multifamily construction is in the pipeline within 1–3 miles? Heavy new supply (>2% of stock underway) typically softens rents 12–24 months out; light construction supports rent growth.
Investment metrics
- 1% rule
- 1.09% ✓
- Cap rate
- 8.13%
- Cash-on-cash
- 6.55%
- DSCR
- 1.29
- GRM
- 7.7
CMA / ARV
- ARV (median comp)
- $245,256
- List price
- $210,000
- Delta
- -14.38%
- Verdict
- UNDERPRICED
- Comps
- 20 within 1.0 mi
Projected returns pro-forma
-3.0% appreciation · 8.0% rent growth · sell at horizon
- IRR
- -0.6%
- Equity multiple
- 0.97×
- Total profit
- $-1,484
- Equity at exit
- $31,312
- IRR
- 13.8%
- Equity multiple
- 2.36×
- Total profit
- $80,066
- Equity at exit
- $18,157
Cash invested: $58,800 (down + closing). Projections, not guarantees.
Landlord ↔ Tenant lean methodology
- Overall (STATE)
- 73 Landlord-Friendly
- State Ohio
- 73 Landlord-Friendly · R+6
- County
- — inherits STATE
- City
- — inherits STATE
ZIP-level market 45409
- Rents YoY
- 10.8%
- Active inventory
- 53
- Price-to-rent
- 15.4×
Monthly cashflow live
- Estimated rent
- $2,279 medium interval (Pro) →
- Mortgage (P&I)
- −$1,101
- Tax from tax record
- −$291 /mo · $3,487/yr
- Insurance
- −$88
- HOA
- −$0
- Vacancy / Maint / Mgmt
- −$479
- Net cashflow
- $321
Break-even live
2-unit breakdown (identical units grouped — click to expand)
| Units | Beds | Baths | Est. rent |
|---|---|---|---|
| 2× units | 2 | 1 | $2,280 |
| #1 | 2 | 1 | $1,140 |
| #2 | 2 | 1 | $1,140 |
| Total (2 units) | $2,279 | ||
UW: 25.0% down · 7.5% · 30yr · 1.5% tax · 5.0% vac · 8.0% maint · 8.0% mgmt
Financing live
Cash to close
- Down payment
- $52,500
- Closing costs
- $6,300
- Reserves months
- —
- Total cash needed
- —
Loan-product check · same deal, 3 products live
Conventional
25% down · 7.5% · 30yr
- Down + closing
- —
- Monthly P&I
- —
- Monthly cashflow
- —
- DSCR
- —
- Eligible?
- —
Personal DTI + credit; lowest rate.
DSCR
20% down · 8.5% · 30yr
- Down + closing
- —
- Monthly P&I
- —
- Monthly cashflow
- —
- DSCR
- —
- Eligible?
- —
No personal income docs; deal must DSCR.
Hard money
10% down · 12.0% · 12mo
- Down + closing
- —
- Monthly P&I
- —
- Monthly cashflow
- —
- DSCR
- —
- Eligible?
- —
Short-term bridge; refi at stabilization.
Rent comps 10 comps
| Address | Beds | Baths | Sqft | Rent | $/sqft | DOM | Units | Dist |
|---|---|---|---|---|---|---|---|---|
| 4421 Grayson St Dayton, OH | 3.0 | 1.0 | 1040 | $1,745 | $1.68 | 23d | 1 | 0.21mi |
| 301 Henrich Dr Dayton, OH | 3.0 | 1.0 | 1040 | $1,745 | $1.68 | 3d | 1 | 0.29mi |
| 401 Orangewood Dr Dayton, OH | 3.0 | 1.0 | 1040 | $1,745 | $1.68 | 44d | 1 | 0.30mi |
| 521 Oakview Dr Dayton, OH | 4.0 | 2.0 | 1404 | $1,995 | $1.42 | 44d | 1 | 0.45mi |
| 508 Schuyler Dr Dayton, OH | 3.0 | 1.0 | 1120 | $2,075 | $1.85 | 3d | 1 | 0.59mi |
| 4354 Meadowcroft Rd Dayton, OH | 3.0 | 1.5 | 1155 | $1,600 | $1.39 | 3d | 1 | 1.08mi |
| 1532 Lynnfield Dr Unit 1530 Kettering, OH | 2.0 | 1.0 | 1000 | $1,450 | $1.45 | 23d | 1 | 1.21mi |
| 3212 Ackerman Blvd Dayton, OH | 3.0 | 2.0 | 1542 | $1,475 | $0.96 | 3d | 1 | 1.25mi |
| 3190 Cobblestone Ln Dayton, OH | 3.0 | 2.5 | 1650 | $2,200 | $1.33 | 14d | 1 | 1.40mi |
| 562 East Dr Dayton, OH | 2.0 | 1.0 | 1218 | $950 | $0.78 | 3d | 1 | 1.46mi |
Listing history 22 events
-
2026-06-18days on market $210,000 Active 21 DOM
-
2026-06-17days on market $210,000 Active 20 DOM
-
2026-06-16days on market $210,000 Active 19 DOM
-
2026-06-15days on market $210,000 Active 18 DOM
-
2026-06-14days on market $210,000 Active 16 DOM
-
2026-06-13days on market $210,000 Active 15 DOM
-
2026-06-10days on market $210,000 Active 13 DOM
-
2026-06-09days on market $210,000 Active 12 DOM
-
2026-06-08days on market $210,000 Active 11 DOM
-
2026-06-07days on market $210,000 Active 10 DOM
-
2026-06-05days on market $210,000 Active 7 DOM
-
2026-06-03days on market $210,000 Active 6 DOM
-
2026-06-02days on market $210,000 Active 5 DOM
-
2026-06-01days on market $210,000 Active 4 DOM
-
2026-05-31days on market $210,000 Active 3 DOM
-
2026-05-12$210,000 Active 510-char remark
Show marketing remark (510 chars)
This versatile home is already classified as a two-family property, offering excellent potential to convert it into two rental units. It is currently used as a residential home featuring 3 rooms, 1 full bathroom, and 1 half bathroom. Property is "sold as is". Upgraded roof replaced by the insurance at the end of 2023. Stucco external wall recently done. Convenient laundry area with easy access, ideal for future duplex configuration uses. Bamboo flooring, granite kitchen counter and good windows.
-
2025-09-04price $225,000
-
2024-10-29historical
-
2024-10-03price $230,000
-
2024-09-06$240,000 Active
-
2021-01-22soldstatus $80,000
-
1985-06-19soldstatus $42,000
ⓘ Source: listings_history table (triggers on properties + properties_extension) + one-shot
backfill from property_details.listing_events for pre-trigger history.
Tax reassessment forecast OH · Partial reset (capped growth)
- Current annual tax
- $3,487 · $291/mo
- Projected year-2 tax
- $3,487 · $291/mo
- Expected delta
- $0/yr ($0/mo · 0.0%)
ⓘ Screening estimate from a state-policy table — verify with the county assessor before closing.
Climate risk First Street
- Flood 1/10 Low FEMA zone X (unshaded) · 0% chance over 30 yrs
- Wildfire 1/10 Low
- Heat 3/10 Moderate 7 d/yr ≥100°F today · 18 d/yr by 30 yrs out
- Wind 2/10 Low 0% chance of damaging wind over 30 yrs
- Air quality 3/10 Moderate 3 unhealthy d/yr today · 5 by 30 yrs out
Nearby sold comps map
Loading sold comps map…
Walkable amenities ~0.75 mi
Loading nearby amenities…
Taxation est. · year 1
- Rental income
- $27,348
- − Mortgage interest
- −$11,763
- − Property taxes
- −$3,487
- − Insurance
- −$1,050
- − Repairs & maintenance
- −$2,188
- − Management
- −$2,188
- − Depreciation
- −$6,109
- Taxable income
- $563
- Est. tax owed @ 24.0%
- −$135
- After-tax cash flow
- $3,718/yr
For passive investors: Depreciation is non-cash, so a rental often shows a tax loss while cash-flowing — sheltering income. Rental losses are passive: they offset passive income freely, and up to $25,000/yr can offset ordinary (W-2) income if you actively participate and your MAGI is under $100k (phasing out to $0 by $150k); unused losses carry forward. On sale, claimed depreciation is recaptured at up to 25%, and gains may owe capital-gains tax (a 1031 exchange can defer both). Figures are a year-1 estimate at your 24.0% rate — not tax advice; consult a CPA.
Schools (NCES district)
- District
- Kettering City School District
- NCES district ID
- 3904418
- Math proficiency
- 54% ▼ -21.00%
- Reading proficiency
- 68% ▼ -9.00%
- Median HH income
- $50,353
- Composite
- 51.89/100
- National rank
- #1653
- State rank
- #277 of 656 in OH
Livability — Kettering
- Score
- 83/100
- State rank
- #61
- US rank
- #922
Category grades
Schools grade is shown separately in the Schools card above.
Census & demographics
- Census place
- Kettering, OH
- County
- Montgomery County · 459,541 people
- City population
- 73,116
- Metro
- Dayton-Kettering, OH
- Population (ZIP)
- 15,293
- Household income
- $87,283
- Rent vs Own
- Severe rent burden
- 185.0
Population outlook (Montgomery County) Hauer SSP2
- Today (2025)
- 523,241 people
- By 2030
- 514,948 · -1.6%
- By 2040
- 493,378 · -5.7%
- By 2050
- 469,639 · -10.2%
- By 2075
- 418,360 · -20.0%
- By 2100
- 353,315 · -32.5%
Race, ethnicity, and origin ACS 2023
- Neighborhood character
- Predominantly White (83%)
- Race & ethnicity
- White 83% Hispanic / Latino 6% Two or more races 5% Black 5% Asian 3%
- Hispanic origin (detail)
- Mexican 3% Puerto Rican 1%
- Common ancestry
- Romanian 4% Italian 4% Slovak 2%
- Foreign-born
- 4% · China, Canada, Vietnam
- Languages at home
- 92% English-only · Spanish 4% Chinese 1% Other Indo-European 1%
Political lean MEDSL · Montgomery
- 2024 margin
- Toss-up / Even · D 49.8% · R 49.3%
- 2008→2024 swing
- -5.8pp toward R · 2008: 6.2pp · 2024: 0.5pp
- All cycles
- 2024: D+0.5 2020: D+2.2 2016: R+1.2 2012: D+3.1 2008: D+6.2
Not yet ingested
- Civics
- —
Market trends
- HPI YoY
- ▼ -199.63%
- Current HPI
- 225.554
- Rent YoY
- ▲ 10.84%
- Metro
- Dayton-Kettering, OH
- State GDP YoY
- ▲ 1.98%
- F500 in state
- 48
Industry mix (Fortune 500 HQ in OH)
| Industry | F500 HQs | Revenue |
|---|---|---|
| Insurance | 3 | $145B |
|
||
| Industrial Machinery | 3 | $49B |
|
||
| Financial Services | 3 | $24B |
|
||
| Consumer Goods | 2 | $93B |
|
||
| Aerospace / Defense | 2 | $47B |
|
||
| Utilities | 2 | $33B |
|
||
Price history
+400.0% since first listed8 events — show timeline
- 2026-05-12 Listed $210,000 Dayton MLS
- 2026-05-07 Listed $210,000 CBRMLS
- 2025-09-04 Price Changed $225,000 Dayton MLS
- 2024-10-29 Listing Removed — Dayton MLS
- 2024-10-03 Price Changed $230,000 Dayton MLS
- 2024-09-06 Listed $240,000 Dayton MLS
- 2021-01-22 Sold (Public Records) $80,000 Public Records
- 1985-06-19 Sold (Public Records) $42,000 Public Records
Property tax history
+3.7%/yrLatest (2025): $3,487 · -0.2% YoY. Source: county tax records.
Cash-flow waterfall
monthlySold comps — $/sqft
last 12 mo · ≤1 miLoading sold comps…