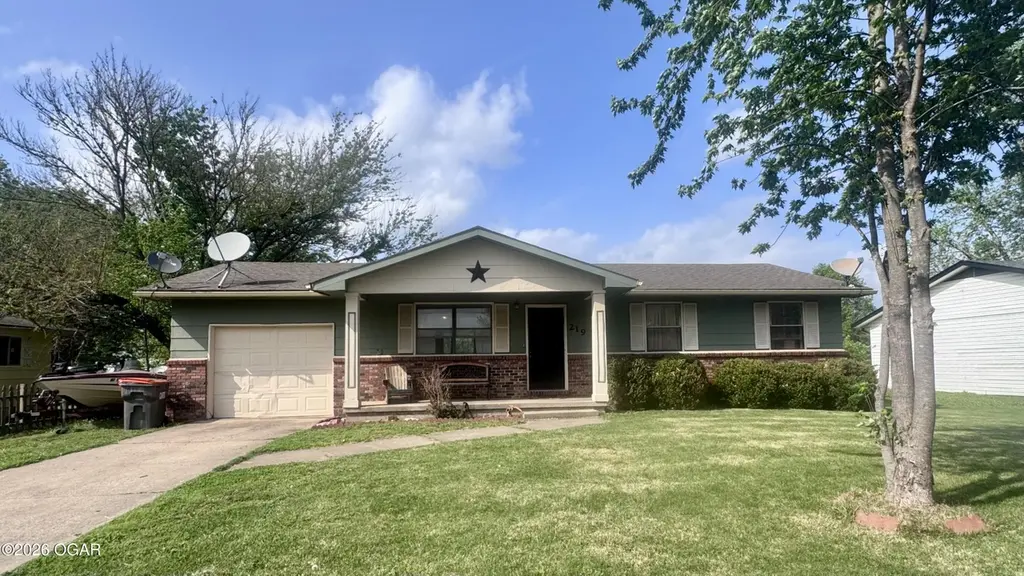
219 W Maverick St · Goodman, MO
Flood risk 1/10 · Minimal
- FEMA flood zone
- X (unshaded)
- Chance of flooding over 30 yrs
- 0.0%
- Est. flood insurance / yr
- $507 – $1,088
Fire risk 3/10 · Minor
- Est. fire insurance / yr
- $1,054 – $1,958
Heat risk 5/10 · Moderate
- Hot days now (above 104°F)
- 7 days/yr
- Hot days in 30 yrs
- 20 days/yr
Wind risk 2/10 · Minimal
- Chance of severe wind over 30 yrs
- 2.0%
Air-quality risk 2/10 · Minimal
- Unhealthy air days now
- 1 days/yr
- Unhealthy air days in 30 yrs
- 1 days/yr
Risk factors via First Street. Map © Google.
Why this score? — see what drove the D grade
The composite is a weighted blend of 9 inputs, each scored 0–100. Each bar is that input's sub-score; the figure is the points it added to the 100-point composite (weight × sub-score).
- ARV discount +14.4/15.0
- Appreciation +8.4/10.0
- Cash flow +6.2/30.0
- Schools +3.5/10.0
- Livability +3.2/5.0
- Rent growth +2.5/5.0
- Condition / age +2.5/5.0
- 1% rule +1.5/10.0
- DSCR +0.5/10.0
$154,900
🖨 Deal sheet (PDF) 📄 Offer letter ✓ Due diligence
Listing remarks MLS
Charming and full of potential, this 3-bedroom, 1-bath ranch-style home is perfectly situated on a quiet street, offering both comfort and convenience. Step inside to an open-concept living and dining area that creates a welcoming space for everyday living and entertaining. The home features a spacious bathroom and utility room, providing added functionality and room to grow. A 1-car attached garage adds convenience and extra storage. Whether you're a first-time homebuyer looking for the perfect place to start or an investor seeking a solid opportunity, this property checks all the boxes.
Key facts
- Garage
- Built 1975
Neighborhood map
What this means for you Summary
Snapshot
- This is a 3-bed/1.0-bath single-family listed at $155k.
Deal economics
- At list price, monthly cash flow is $-280 ($-3k/yr) — negative.
- To cash-flow at today's rent, offer at most $114k (26.2% below list).
- To meet the 1% rule (rent ≥ 1% of price), the offer needs to be $100k (35.4% below list).
- Recommended offer: $100k (35.4% below list) — sets the bar for 1% rule.
Location & tenants
- Location reads 64/100 on livability (#325 in MO) — a middle-class / working-renter tenant base. Strengths: crime A+, cost of living A+, housing A+; Watch: amenities F, commute F, employment D-.
- Neosho School District (town): math 36% / reading 48% proficiency, ranked #125 of 324 in MO (top 39%) — families likely to look elsewhere, expect single-tenant / working-renter base with shorter leases.
- Zoned schools: Goodman Elem. (math 42% / reading 47%, grade F, #413 of 1,115 statewide, top 42%, 255 students, 76% FRL); Neosho Jr. High (math 41% / reading 48%, grade D, #113 of 391 statewide, top 31%, 748 students, 58% FRL); Neosho High (math 21% / reading 57%, grade F, #287 of 521 statewide, top 55%, 1,491 students, 48% FRL).
- Market conditions: 43 active listings in the ZIP; 1 comparable units currently listed for rent nearby; 20 units permitted in McDonald County in 2024 (0 in 5+ unit buildings).
Forward outlook
- In year one you build about $11k of equity ($1k loan paydown + $10k appreciation (6.7% local appreciation)).
- McDonald County population projected at -14% by 2050 — secular population decline; favor cash flow + early exit over multi-decade hold.
- By year 4, paydown + projected appreciation supports a ~$39k cash-out refi (75% LTV) — recoverable capital for the next deal without selling this one.
Negotiation context
- Only 1 days on market — expect competitive offers; lowballing is unlikely to land.
- 4 sale attempts since 10y ago with the ask held roughly flat each time — persistent listings suggest the price (not the market) is what's stuck; bring a comps-based counter.
Risks & watch-outs
- Climate carrying-cost: extreme-heat days projected 7→20/yr by 2055 (HVAC capex compounding) — expect insurance premiums to compound above CPI over the hold.
Questions for the listing agent
- What do current leases actually rent for vs. the listed asking? Can we see a recent rent roll and the last 12 months of T-12 income?
- Built in 1975 — when were the roof, HVAC, electrical panel, plumbing, and water heater last replaced?
- Is there a deadline driving the sale (1031 exchange, divorce, estate, relocation)? That informs how much negotiation room exists.
- Schools are F-rated, which usually means shorter tenancies and higher turnover. Who's the typical renter profile here, and what's been the actual vacancy rate?
- The area grade is low — what's the realistic commute time and amenity access for the typical tenant pool here? Any planned neighborhood developments (good or bad) we should know about?
- What's the average days-on-market for RENTAL listings here right now (not sales)? A rising rental-DOM trend means longer vacancies and softer asking-rent achievability than the comps imply.
- What's the recent tenant-quality profile in this submarket — average credit score on applications, eviction rate, late-payment / NSF rate, and stable-employment percentage? A property-management company in the area should have these aggregated.
- How much new for-sale + rental construction is in the pipeline within 1–3 miles? Heavy new supply typically softens prices + rents 12–24 months out; constrained supply supports both.
Investment metrics
- 1% rule
- 0.65% ✗
- Cap rate
- 4.12%
- Cash-on-cash
- -7.76%
- DSCR
- 0.65
- GRM
- 12.9
CMA / ARV
- ARV (median comp)
- $183,156
- List price
- $154,900
- Delta
- -15.43%
- Verdict
- UNDERPRICED
- Comps
- 16 within 1.0 mi
Show comp detail 5 sales within ~0.75 mi
| Address | Dist | Beds/Ba | Sqft | Sold | Price | $/sf | Match |
|---|---|---|---|---|---|---|---|
| 212 Maverick | 0.03mi | 3/1.0 | 1,324 (+7%) | 9mo | $164,000 | $124 | 80 |
| 212 N School St | 0.38mi | 3/2.0 | 1,269 (+2%) | 6mo | $175,000 | $138 | 69 |
| 149 N Riley St | 0.12mi | 4/2.0 (+1) | 1,325 (+7%) | 23mo | $185,000 | $140 | 55 |
| 128 E Splitlog Ave | 0.66mi | 3/1.0 | 1,144 (-8%) | 10mo | $189,000 | $165 | 48 |
| 201 S S Roy Hill Boulevard Blvd | 0.51mi | 3/2.0 | 1,423 (+15%) | 20mo | $85,000 | $60 | 31 |
Match score weights: distance 35% · size 25% · config 20% · recency 20%. Top-matched comps best support the ARV.
Projected returns pro-forma
6.71% appreciation · 3.0% rent growth · sell at horizon
- IRR
- 11.0%
- Equity multiple
- 1.77×
- Total profit
- $33,468
- Equity at exit
- $104,391
- IRR
- 11.9%
- Equity multiple
- 3.56×
- Total profit
- $111,009
- Equity at exit
- $195,680
Cash invested: $43,372 (down + closing). Projections, not guarantees.
Landlord ↔ Tenant lean methodology
- Overall (STATE)
- 81 Strongly Landlord-Friendly
- State Missouri
- 81 Strongly Landlord-Friendly · R+10
- County
- — inherits STATE
- City
- — inherits STATE
ZIP-level market 64843
- Home prices YoY
- 3.3%
- Active inventory
- 43
- Price-to-rent
- 12.9×
Monthly cashflow live
- Estimated rent
- $1,000 medium interval (Pro) →
- Mortgage (P&I)
- −$812
- Tax est. 1.5%
- −$194 /mo · $2,324/yr
- Insurance
- −$65
- HOA
- −$0
- Vacancy / Maint / Mgmt
- −$210
- Net cashflow
- $-280
Break-even live
Sensitivity live
| Price | -10% $-173 | -5% $-227 | +0% $-280 | +5% $-334 | +10% $-388 |
|---|---|---|---|---|---|
| Rent | -10% $-359 | -5% $-320 | +0% $-280 | +5% $-241 | +10% $-201 |
| Rate | -1.0pp $-202 | -0.5pp $-241 | base $-280 | +0.5pp $-321 | +1.0pp $-361 |
UW: 25.0% down · 7.5% · 30yr · 1.5% tax · 5.0% vac · 8.0% maint · 8.0% mgmt
Financing live
Cash to close
- Down payment
- $38,725
- Closing costs
- $4,647
- Reserves months
- —
- Total cash needed
- —
Loan-product check · same deal, 3 products live
Conventional
25% down · 7.5% · 30yr
- Down + closing
- —
- Monthly P&I
- —
- Monthly cashflow
- —
- DSCR
- —
- Eligible?
- —
Personal DTI + credit; lowest rate.
DSCR
20% down · 8.5% · 30yr
- Down + closing
- —
- Monthly P&I
- —
- Monthly cashflow
- —
- DSCR
- —
- Eligible?
- —
No personal income docs; deal must DSCR.
Hard money
10% down · 12.0% · 12mo
- Down + closing
- —
- Monthly P&I
- —
- Monthly cashflow
- —
- DSCR
- —
- Eligible?
- —
Short-term bridge; refi at stabilization.
Rent comps 1 comps
| Address | Beds | Baths | Sqft | Rent | $/sqft | DOM | Units | Dist |
|---|---|---|---|---|---|---|---|---|
| 218 W Maverick Goodman, MO | 3.0 | 1.0 | 1376 | $1,000 | $0.73 | 25d | 1 | 0.05mi |
Listing history 11 events
-
2026-06-02status $154,900 Pending 1 DOM
-
2026-05-31days on market $154,900 Active 1 DOM
Show marketing remark (595 chars)
Charming and full of potential, this 3-bedroom, 1-bath ranch-style home is perfectly situated on a quiet street, offering both comfort and convenience. Step inside to an open-concept living and dining area that creates a welcoming space for everyday living and entertaining. The home features a spacious bathroom and utility room, providing added functionality and room to grow. A 1-car attached garage adds convenience and extra storage. Whether you're a first-time homebuyer looking for the perfect place to start or an investor seeking a solid opportunity, this property checks all the boxes.
-
2026-05-30days on market $154,900 Active 45 DOM
-
2026-04-30price $154,900 595-char remark
-
2026-04-30price $154,900 595-char remark
-
2026-04-14$164,900 Active 595-char remark
-
2026-04-14$164,900 Active 595-char remark
-
2024-07-18status Pending
-
2024-07-03$149,900 Active
-
2016-08-26soldstatus
-
2016-06-27$76,900
ⓘ Source: listings_history table (triggers on properties + properties_extension) + one-shot
backfill from property_details.listing_events for pre-trigger history.
Climate risk First Street
- Flood 1/10 Low FEMA zone X (unshaded) · 0% chance over 30 yrs
- Wildfire 3/10 Moderate
- Heat 5/10 Major 7 d/yr ≥104°F today · 20 d/yr by 30 yrs out
- Wind 2/10 Low 2% chance of damaging wind over 30 yrs
- Air quality 2/10 Low 1 unhealthy d/yr today · 1 by 30 yrs out
Nearby sold comps map
Loading sold comps map…
Walkable amenities ~0.75 mi
Loading nearby amenities…
Taxation est. · year 1
- Rental income
- $12,000
- − Mortgage interest
- −$8,677
- − Property taxes
- −$2,324
- − Insurance
- −$774
- − Repairs & maintenance
- −$960
- − Management
- −$960
- − Depreciation
- −$4,506
- Taxable loss
- −$6,201
- Est. tax savings @ 24.0%
- +$1,488
- After-tax cash flow
- $-1,878/yr
For passive investors: Depreciation is non-cash, so a rental often shows a tax loss while cash-flowing — sheltering income. Rental losses are passive: they offset passive income freely, and up to $25,000/yr can offset ordinary (W-2) income if you actively participate and your MAGI is under $100k (phasing out to $0 by $150k); unused losses carry forward. On sale, claimed depreciation is recaptured at up to 25%, and gains may owe capital-gains tax (a 1031 exchange can defer both). Figures are a year-1 estimate at your 24.0% rate — not tax advice; consult a CPA.
Schools (NCES district)
- District
- Neosho School District
- NCES district ID
- 2921810
- Math proficiency
- 36% ▬ 0.00%
- Reading proficiency
- 48% ▲ 2.00%
- Median HH income
- $40,574
- Composite
- 35.21/100
- National rank
- #4987
- State rank
- #125 of 324 in MO
Livability — Goodman
- Score
- 64/100
- State rank
- #325
- US rank
- #14850
Category grades
Schools grade is shown separately in the Schools card above.
Census & demographics
- Census place
- Goodman, MO
- Population (ZIP)
- 3,193
Population outlook (McDonald County) Hauer SSP2
- Today (2025)
- 21,753 people
- By 2030
- 21,154 · -2.8%
- By 2040
- 19,946 · -8.3%
- By 2050
- 18,666 · -14.2%
- By 2075
- 16,201 · -25.5%
- By 2100
- 14,550 · -33.1%
Race, ethnicity, and origin ACS 2023
- Neighborhood character
- Predominantly White (72%)
- Race & ethnicity
- White 72% Hispanic / Latino 13% Two or more races 8% Asian 3% Native American 2% Pacific Islander 2%
- Hispanic origin (detail)
- Mexican 9%
- Common ancestry
- Iranian 3% Lithuanian 3% Romanian 2%
- Foreign-born
- 12% · Canada, Philippines, South Korea
- Languages at home
- 82% English-only · Spanish 12% Other Asian/Pacific 3% Other Indo-European 2%
Political lean MEDSL · McDonald
- 2024 margin
- Solid R (+68.8) · D 15.2% · R 84.0%
- 2008→2024 swing
- -31.3pp toward R · 2008: -37.4pp · 2024: -68.8pp
- All cycles
- 2024: R+68.8 2020: R+66.6 2016: R+64.0 2012: R+48.3 2008: R+37.4
Not yet ingested
- Civics
- —
Market trends
- HPI YoY
- ▲ 6.71%
- Current HPI
- 211.4918
- Rent YoY
- —
- Metro
- —
- State GDP YoY
- ▲ 1.84%
- F500 in state
- 20
Industry mix (Fortune 500 HQ in MO)
| Industry | F500 HQs | Revenue |
|---|---|---|
| Healthcare | 1 | $163B |
|
||
| Insurance | 1 | $21B |
|
||
| Industrial Technology | 1 | $17B |
|
||
| Retail | 1 | $16B |
|
||
| Industrial Distribution | 1 | $10B |
|
||
| Utilities | 1 | $9B |
|
||
Price history
+101.4% since first listed9 events — show timeline
- 2026-06-01 Pending — OGAR
- 2026-05-31 Listed $154,900 OGAR
- 2026-04-30 Price Changed $154,900 OGAR
- 2026-04-30 Price Changed $154,900 SOMO
- 2026-04-14 Listed $164,900 SOMO
- 2024-07-18 Pending — SOMO
- 2024-07-03 Listed $149,900 SOMO
- 2016-08-26 Sold (MLS) — OGAR
- 2016-06-27 Listed $76,900 OGAR
Cash-flow waterfall
monthlySold comps — $/sqft
last 12 mo · ≤1 miLoading sold comps…