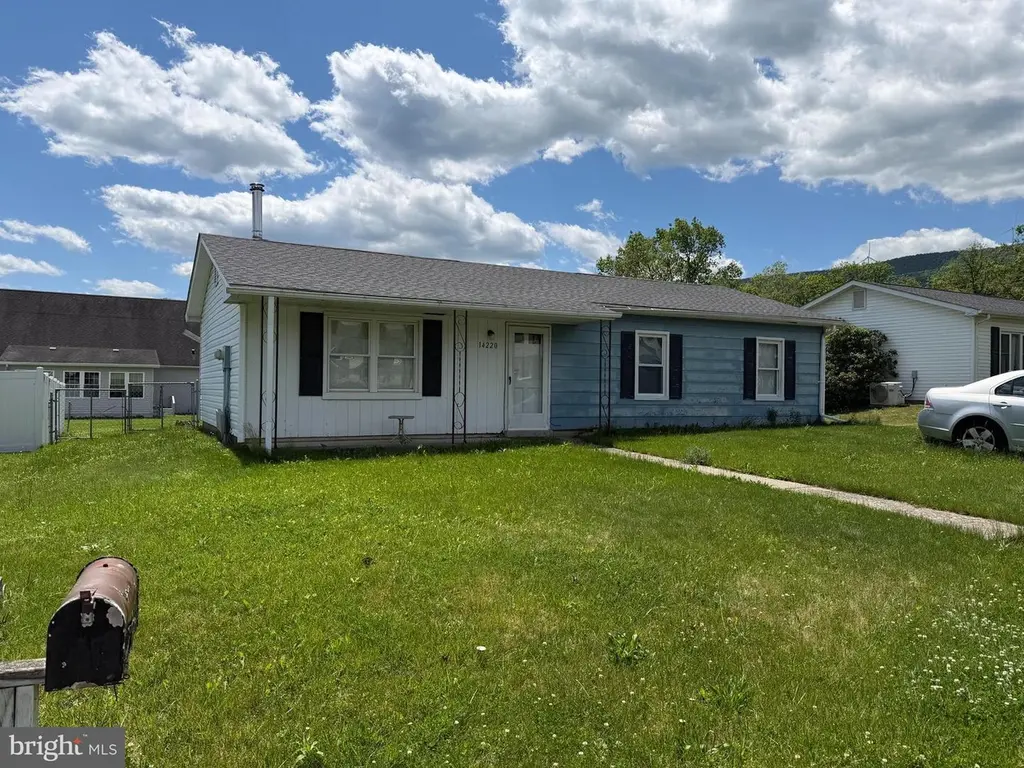
14220 Oak View Dr SW · Cresaptown, MD
Flood risk 1/10 · Minimal
- FEMA flood zone
- X (unshaded)
- Chance of flooding over 30 yrs
- 0.0%
- Est. flood insurance / yr
- $507 – $1,088
Fire risk 2/10 · Minimal
- Est. fire insurance / yr
- $755 – $1,403
Heat risk 5/10 · Moderate
- Hot days now (above 101°F)
- 7 days/yr
- Hot days in 30 yrs
- 18 days/yr
Wind risk 2/10 · Minimal
- Chance of severe wind over 30 yrs
- —
Air-quality risk 2/10 · Minimal
- Unhealthy air days now
- 0 days/yr
- Unhealthy air days in 30 yrs
- 1 days/yr
Risk factors via First Street. Map © Google.
Why this score? — see what drove the B+ grade
The composite is a weighted blend of 9 inputs, each scored 0–100. Each bar is that input's sub-score; the figure is the points it added to the 100-point composite (weight × sub-score).
- Cash flow +30.0/30.0
- ARV discount +15.0/15.0
- DSCR +10.0/10.0
- 1% rule +9.5/10.0
- Rent growth +5.0/5.0
- Livability +2.8/5.0
- Condition / age +2.5/5.0
- Schools +1.9/10.0
- Appreciation +0.0/10.0
$90,000
🖨 Deal sheet 📄 Offer letter ✓ Due diligence
Listing remarks
Opportunity awaits in this ranch-style home with great potential! Featuring a functional layout and solid bones, this property is perfect for buyers looking to update and make it their own. As you enter, you’re welcomed into a spacious open living and dining area, complete with a cozy wood-burning stove, creating a warm and inviting focal point. The adjoining kitchen offers ample cabinet storage and generous prep space, providing a great foundation for future updates. The home includes three spacious bedrooms and a full bathroom, all conveniently located on one level for easy living. Step outside to a large backyard featuring a patio and storage shed, offering plenty of space for ente
Key facts
- Large backyard
- Ranch style home
- Functional layout
Tags
Property features AI
Exterior
- Parking: On-street parking; One off-street parking space; One total garage/parking space
- Utilities: Public water; Public sewer; Electric service
- Home design: Detached structure; Single-story living (all main living on one level)
- Construction: Frame construction; Slab foundation
- Exterior features: Patio(s); Shed
Interior
- Kitchen: Electric range/oven; Refrigerator
- Bedrooms: Three bedrooms on the main level
- Flooring: Carpet
- Bathrooms: One full bathroom on the main level
- Heating & cooling: Electric baseboard heating; Central air conditioning
- Interior features: Ceiling fans; Tub/shower; Combination dining and living area; Traditional floor plan
- Laundry & utility: Washer and dryer on the main floor; Electric water heater
Neighborhood map
What this means for you Summary
Snapshot
- This is a 3-bed/1.0-bath single-family listed at $90k.
Deal economics
- At list price, monthly cash flow is $439 ($5k/yr) — positive.
- The deal already cash-flows at list — no discount required.
- Meets the 1% rule at list price ($1k rent vs $90k).
- Recommended offer: $89k (1.5% below list) — sets the bar for market timing.
Location & tenants
- Location reads 56/100 on livability (#411 in MD) — a working-class tenant base; expect higher turnover. Strengths: cost of living A+, housing B+; Watch: employment C-, schools F, crime F.
- Allegany County Public Schools (other): math 15% / reading 30% proficiency, ranked #18 of 24 in MD (top 75%) — low school quality limits family demand, transient renter base, plan for 1-2y turnover.
- Market conditions: Rents rising fast (+10.9%/yr); 235 active listings in the ZIP; 24 units permitted in Allegany County in 2024 (0 in 5+ unit buildings).
Forward outlook
- Local home prices are declining (-3.0%/yr); year-one equity from $622 of loan paydown is wiped out by about $3k of value loss. Plan a longer hold.
- Allegany County population projected at -14% by 2050 — secular population decline; favor cash flow + early exit over multi-decade hold.
- At projected returns (-3.0% appreciation + 8.0% rent growth), your $25k cash investment doubles in ~5 years — after that, you're playing with house money.
Negotiation context
- It's been on market 21 days — a 2% lower offer ($89k) is reasonable based on typical stale-listing flexibility.
- Current owner paid $50k; list at $90k implies a 82% gain — meaningful room to come down on a strong offer.
Risks & watch-outs
- Climate carrying-cost: extreme-heat days projected 7→18/yr by 2055 (HVAC capex compounding) — expect insurance premiums to compound above CPI over the hold.
Questions for the listing agent
- Built in 1972 — when were the roof, HVAC, electrical panel, plumbing, and water heater last replaced?
- Is there a deadline driving the sale (1031 exchange, divorce, estate, relocation)? That informs how much negotiation room exists.
- Schools are F-rated, which usually means shorter tenancies and higher turnover. Who's the typical renter profile here, and what's been the actual vacancy rate?
- Crime grade is F in this area — have there been break-ins, vandalism, or insurance claims at this property in the last 3 years? What carrier currently insures it and at what premium?
- What's the average days-on-market for RENTAL listings here right now (not sales)? A rising rental-DOM trend means longer vacancies and softer asking-rent achievability than the comps imply.
- What's the recent tenant-quality profile in this submarket — average credit score on applications, eviction rate, late-payment / NSF rate, and stable-employment percentage? A property-management company in the area should have these aggregated.
- How much new for-sale + rental construction is in the pipeline within 1–3 miles? Heavy new supply typically softens prices + rents 12–24 months out; constrained supply supports both.
Investment metrics
- 1% rule
- 1.45% ✓
- Cap rate
- 12.15%
- Cash-on-cash
- 20.92%
- DSCR
- 1.93
- GRM
- 5.8
CMA / ARV
- ARV (on-the-fly)
- $145,728
- Comps found
- 10
Show comp detail 10 sales within ~0.75 mi
| Address | Dist | Beds/Ba | Sqft | Sold | Price | $/sf | Match |
|---|---|---|---|---|---|---|---|
| 14244 Cunningham Dr SW | 0.12mi | 2/1.0 (-1) | 1,071 (+1%) | 1mo | $119,800 | $112 | 86 |
| 14214 Clear View Dr SW | 0.07mi | 2/1.0 (-1) | 1,116 (+6%) | 0mo | $56,000 | $50 | 82 |
| 14104 Louise Dr SW | 0.20mi | 3/1.0 | 1,008 (-4%) | 5mo | $136,000 | $135 | 79 |
| 14248 Cunningham Dr SW | 0.13mi | 3/1.0 | 984 (-7%) | 7mo | $13,000 | $13 | 77 |
| 14209 Oak View Dr SW | 0.09mi | 3/2.0 | 1,080 (+2%) | 23mo | $149,000 | $138 | 69 |
| 14004 Cedarwood Dr SW | 0.31mi | 3/1.0 | 1,068 (+1%) | 18mo | $149,000 | $140 | 68 |
| 14507 Bourbon St SW | 0.21mi | 3/1.5 | 1,144 (+8%) | 8mo | $180,000 | $157 | 67 |
| 14234 Louise Dr SW | 0.16mi | 3/2.0 | 1,120 (+6%) | 13mo | $145,000 | $129 | 67 |
| 14204 Old Lake Dr SW | 0.35mi | 3/1.0 | 928 (-12%) | 20mo | $160,000 | $172 | 47 |
| 14506 N Bel Air Dr SW | 0.39mi | 3/1.5 | 1,196 (+13%) | 19mo | $220,000 | $184 | 42 |
Match score weights: distance 35% · size 25% · config 20% · recency 20%. Top-matched comps best support the ARV.
Projected returns pro-forma
-3.0% appreciation · 8.0% rent growth · sell at horizon
- IRR
- 18.7%
- Equity multiple
- 1.80×
- Total profit
- $20,264
- Equity at exit
- $13,419
- IRR
- 30.3%
- Equity multiple
- 4.37×
- Total profit
- $84,949
- Equity at exit
- $7,782
Cash invested: $25,200 (down + closing). Projections, not guarantees.
Landlord ↔ Tenant lean methodology
- Overall (STATE)
- 27 Tenant-Leaning
- State Maryland
- 27 Tenant-Leaning · D+14
- County
- — inherits STATE
- City
- — inherits STATE
ZIP-level market 21502
- Home prices YoY
- -17.4%
- Rents YoY
- 10.9%
- Active inventory
- 235
- Price-to-rent
- 5.8×
Monthly cashflow live
- Estimated rent
- $1,301 medium interval (Pro) →
- Mortgage (P&I)
- −$472
- Tax from tax record
- −$79 /mo · $946/yr
- Insurance
- −$38
- HOA
- −$0
- Vacancy / Maint / Mgmt
- −$273
- Net cashflow
- $439
Break-even live
UW: 25.0% down · 7.5% · 30yr · 1.5% tax · 5.0% vac · 8.0% maint · 8.0% mgmt
Financing live
Cash to close
- Down payment
- $22,500
- Closing costs
- $2,700
- Reserves months
- —
- Total cash needed
- —
Loan-product check · same deal, 3 products live
Conventional
25% down · 7.5% · 30yr
- Down + closing
- —
- Monthly P&I
- —
- Monthly cashflow
- —
- DSCR
- —
- Eligible?
- —
Personal DTI + credit; lowest rate.
DSCR
20% down · 8.5% · 30yr
- Down + closing
- —
- Monthly P&I
- —
- Monthly cashflow
- —
- DSCR
- —
- Eligible?
- —
No personal income docs; deal must DSCR.
Hard money
10% down · 12.0% · 12mo
- Down + closing
- —
- Monthly P&I
- —
- Monthly cashflow
- —
- DSCR
- —
- Eligible?
- —
Short-term bridge; refi at stabilization.
Listing history 17 events
-
2026-06-19days on market $90,000 Active 21 DOM
-
2026-06-18days on market $90,000 Active 20 DOM
-
2026-06-17days on market $90,000 Active 19 DOM
-
2026-06-16days on market $90,000 Active 18 DOM
-
2026-06-15days on market $90,000 Active 17 DOM
-
2026-06-14days on market $90,000 Active 15 DOM
-
2026-06-12days on market $90,000 Active 14 DOM
-
2026-06-09days on market $90,000 Active 11 DOM
-
2026-06-08days on market $90,000 Active 10 DOM
-
2026-06-07days on market $90,000 Active 9 DOM
-
2026-06-02days on market $90,000 Active 4 DOM
-
2026-06-01days on market $90,000 Active 3 DOM
-
2026-05-31days on market $90,000 Active 2 DOM
-
2026-05-29$90,000 Active
-
2026-05-29historical $90,000
-
1992-09-11soldstatus $49,500
-
1989-01-18soldstatus $45,000
ⓘ Source: listings_history table (triggers on properties + properties_extension) + one-shot
backfill from property_details.listing_events for pre-trigger history.
Tax reassessment forecast MD · Partial reset (capped growth)
- Current annual tax
- $946 · $79/mo
- Projected year-2 tax
- $963 · $80/mo
- Expected delta
- +$18/yr (+$1/mo · 1.9%)
ⓘ Screening estimate from a state-policy table — verify with the county assessor before closing.
Climate risk First Street
- Flood 1/10 Low FEMA zone X (unshaded) · 0% chance over 30 yrs
- Wildfire 2/10 Low
- Heat 5/10 Major 7 d/yr ≥101°F today · 18 d/yr by 30 yrs out
- Wind 2/10 Low
- Air quality 2/10 Low 0 unhealthy d/yr today · 1 by 30 yrs out
Nearby sold comps map
Loading sold comps map…
Walkable amenities ~0.75 mi
Loading nearby amenities…
Taxation est. · year 1
- Rental income
- $15,608
- − Mortgage interest
- −$5,041
- − Property taxes
- −$946
- − Insurance
- −$450
- − Repairs & maintenance
- −$1,249
- − Management
- −$1,249
- − Depreciation
- −$2,618
- Taxable income
- $4,055
- Est. tax owed @ 24.0%
- −$973
- After-tax cash flow
- $4,298/yr
For passive investors: Depreciation is non-cash, so a rental often shows a tax loss while cash-flowing — sheltering income. Rental losses are passive: they offset passive income freely, and up to $25,000/yr can offset ordinary (W-2) income if you actively participate and your MAGI is under $100k (phasing out to $0 by $150k); unused losses carry forward. On sale, claimed depreciation is recaptured at up to 25%, and gains may owe capital-gains tax (a 1031 exchange can defer both). Figures are a year-1 estimate at your 24.0% rate — not tax advice; consult a CPA.
Schools (NCES district)
- District
- Allegany County Public Schools
- NCES district ID
- 2400030
- Math proficiency
- 15% ▼ -26.00%
- Reading proficiency
- 30% ▼ -20.00%
- Median HH income
- $39,760
- Composite
- 18.95/100
- National rank
- #8854
- State rank
- #18 of 24 in MD
Livability — Cresaptown
- Score
- 56/100
- State rank
- #411
- US rank
- #22931
Category grades
Schools grade is shown separately in the Schools card above.
Census & demographics
- Census place
- Cresaptown, MD
- County
- Allegany County · 41,015 people
- Metro
- Cumberland, MD-WV
- Population (ZIP)
- 41,015
- Household income
- $60,725
- Rent vs Own
- Severe rent burden
- 824.0
Population outlook (Allegany County) Hauer SSP2
- Today (2025)
- 68,778 people
- By 2030
- 66,766 · -2.9%
- By 2040
- 62,784 · -8.7%
- By 2050
- 59,179 · -14.0%
- By 2075
- 50,732 · -26.2%
- By 2100
- 40,837 · -40.6%
Race, ethnicity, and origin ACS 2023
- Neighborhood character
- Predominantly White (83%)
- Race & ethnicity
- White 83% Black 9% Two or more races 5% Hispanic / Latino 2%
- Common ancestry
- Slovak 3% Romanian 2% Italian 1%
- Foreign-born
- 2% · Canada
- Languages at home
- 96% English-only · Spanish 2%
Political lean MEDSL · Allegany
- 2024 margin
- Solid R (+40.3) · D 28.9% · R 69.2% · Other 2.0%
- 2008→2024 swing
- -14.4pp toward R · 2008: -25.9pp · 2024: -40.3pp
- All cycles
- 2024: R+40.3 2020: R+38.3 2016: R+48.0 2012: R+32.9 2008: R+25.9
Not yet ingested
- Civics
- —
Market trends
- HPI YoY
- ▼ -54.33%
- Current HPI
- 258.6676
- Rent YoY
- ▲ 10.88%
- Metro
- Cumberland, MD-WV
- State GDP YoY
- ▲ 2.97%
- F500 in state
- 12
Industry mix (Fortune 500 HQ in MD)
| Industry | F500 HQs | Revenue |
|---|---|---|
| Aerospace / Defense | 1 | $71B |
|
||
| Utilities | 1 | $25B |
|
||
| Hotels | 1 | $24B |
|
||
| Consumer Goods | 1 | $7B |
|
||
| Real Estate | 1 | $6B |
|
||
| Chemicals | 1 | $2B |
|
||
Price history
+100.0% since first listed4 events — show timeline
- 2026-05-29 Listed $90,000 BRIGHT MLS
- 2026-05-29 Coming Soon $90,000 BRIGHT MLS
- 1992-09-11 Sold (Public Records) $49,500 Public Records
- 1989-01-18 Sold (Public Records) $45,000 Public Records
Property tax history
+0.6%/yrLatest (2025): $946 · +4.5% YoY. Source: county tax records.
Cash-flow waterfall
monthlySold comps — $/sqft
last 12 mo · ≤1 miLoading sold comps…