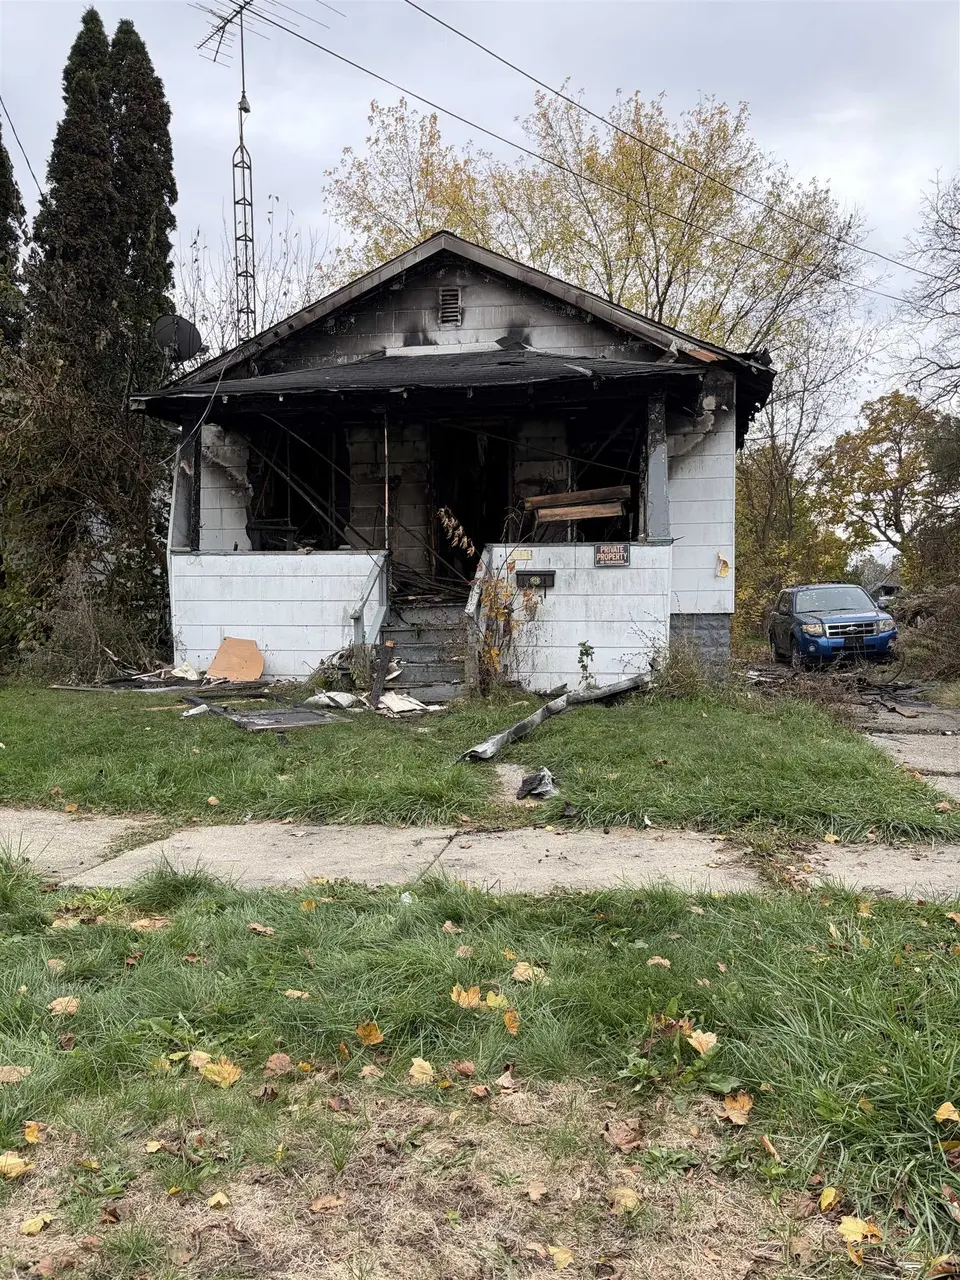
911 Lexington Ave · Flint, MI
Flood risk 1/10 · Minimal
- FEMA flood zone
- X (unshaded)
- Chance of flooding over 30 yrs
- 0.0%
- Est. flood insurance / yr
- $473 – $860
Fire risk 1/10 · Minimal
- Est. fire insurance / yr
- $784 – $1,456
Heat risk 2/10 · Minimal
- Hot days now (above 97°F)
- 7 days/yr
- Hot days in 30 yrs
- 15 days/yr
Wind risk 2/10 · Minimal
- Chance of severe wind over 30 yrs
- —
Air-quality risk 3/10 · Minor
- Unhealthy air days now
- 3 days/yr
- Unhealthy air days in 30 yrs
- 4 days/yr
Risk factors via First Street. Map © Google.
Why this score? — see what drove the D grade
The composite is a weighted blend of 9 inputs, each scored 0–100. Each bar is that input's sub-score; the figure is the points it added to the 100-point composite (weight × sub-score).
- Cash flow +15.0/30.0
- ARV discount +7.5/15.0
- 1% rule +5.0/10.0
- DSCR +5.0/10.0
- Livability +3.7/5.0
- Condition / age +2.5/5.0
- Rent growth +2.2/5.0
- Schools +1.1/10.0
- Appreciation +0.0/10.0
$10,000
🖨 Deal sheet (PDF) 📄 Offer letter ✓ Due diligence
Listing remarks MLS
Opportunity awaits with this fire-damaged home, ready for restoration or redevelopment. The property has experienced fire damage and is being sold as-is, offering excellent potential for investors, contractors, or buyers looking for a renovation project. Buyer to verify all measurements, condition, permits, and repair requirements. BATVAI
Key facts
- 3,485 sq ft lot
- Built 1926
- Listed 38 days
Property features AI
Finance
- Other: 660 square feet above grade
- HOA & community: Homeowners association present
Exterior
- Utilities: Public water; Public sewer
- Home design: Single-family residence; One story
- Construction: Wood siding construction
- Exterior features: Lot in FENTON STREET SUB subdivision; Corner location at Fenton and Brunswick
Interior
- Bathrooms: One full bathroom
- Heating & cooling: Forced air heating (natural gas); No cooling
- Interior features: Has basement; Two total rooms
Neighborhood map
What this means for you Summary
Snapshot
- This is a 2-bed/1.0-bath single-family listed at $10k.
Deal economics
- At list price, monthly cash flow is $611 ($7k/yr) — positive.
- The deal already cash-flows at list — no discount required.
- Meets the 1% rule at list price ($860 rent vs $10k).
- Recommended offer: $10k (3.0% below list) — sets the bar for market timing.
- Cap rate 79.6% vs local median 11.5% in Flint — top-decile yield for the area; either an underpriced asset or a hidden risk that comps aren't pricing in. Stress-test before assuming the spread holds.
Location & tenants
- Location reads 74/100 on livability (#196 in MI, #4,946 nationally) — a middle-class / working-renter tenant base. Strengths: commute A+, cost of living A+, housing A+; Watch: schools F, crime F, employment F.
- Flint School District (urban): math 7% / reading 13% proficiency, ranked #714 of 760 in MI (top 94%) — low school quality limits family demand, transient renter base, plan for 1-2y turnover; 83% free/reduced lunch — lower-income household profile, screen leases tightly.
- Market conditions: Rents soft (-1.0%/yr); 206 active listings in the ZIP; 5 comparable units currently listed for rent nearby; rentals at typical pace (median 14d on market — plan ~3-4 weeks tenant-placement turnaround); 419 units permitted in Genesee County in 2024 (68 in 5+ unit buildings).
Forward outlook
- Local home prices are declining (-3.0%/yr); year-one equity from $69 of loan paydown is wiped out by about $300 of value loss. Plan a longer hold.
- Genesee County population projected at -27% by 2050 — secular population decline; favor cash flow + early exit over multi-decade hold.
- At projected returns (-3.0% appreciation + 0.0% rent growth), your $3k cash investment doubles in ~1 year — after that, you're playing with house money.
Negotiation context
- It's been on market 38 days — a 3% lower offer ($10k) is reasonable based on typical stale-listing flexibility.
- 5 sale attempts since 21y ago with the ask held roughly flat each time — persistent listings suggest the price (not the market) is what's stuck; bring a comps-based counter.
Risks & watch-outs
- Watch-outs: built in 1926 — expect roof / HVAC / electrical / plumbing capex.
Questions for the listing agent
- It's been on market 38 days. Have you received any prior offers? Is the seller open to a 3% concession, seller financing, or rate buy-down credit?
- Built in 1926 — when were the roof, HVAC, electrical panel, plumbing, and water heater last replaced?
- Is there a deadline driving the sale (1031 exchange, divorce, estate, relocation)? That informs how much negotiation room exists.
- Schools are F-rated, which usually means shorter tenancies and higher turnover. Who's the typical renter profile here, and what's been the actual vacancy rate?
- Crime grade is F in this area — have there been break-ins, vandalism, or insurance claims at this property in the last 3 years? What carrier currently insures it and at what premium?
- The area grade is low — what's the realistic commute time and amenity access for the typical tenant pool here? Any planned neighborhood developments (good or bad) we should know about?
- What's the average days-on-market for RENTAL listings here right now (not sales)? A rising rental-DOM trend means longer vacancies and softer asking-rent achievability than the comps imply.
- What's the recent tenant-quality profile in this submarket — average credit score on applications, eviction rate, late-payment / NSF rate, and stable-employment percentage? A property-management company in the area should have these aggregated.
- How much new for-sale + rental construction is in the pipeline within 1–3 miles? Heavy new supply typically softens prices + rents 12–24 months out; constrained supply supports both.
Investment metrics
- 1% rule
- 8.60% ✓
- Cap rate
- 79.56%
- Cash-on-cash
- 261.66%
- DSCR
- 12.64
- GRM
- 1.0
CMA / ARV
- ARV (on-the-fly)
- $54,208
- Comps found
- 12
Show comp detail 12 sales within ~0.75 mi
| Address | Dist | Beds/Ba | Sqft | Sold | Price | $/sf | Match |
|---|---|---|---|---|---|---|---|
| 2021 Brooks St | 0.26mi | 2/1.0 | 987 (+2%) | 3mo | $55,000 | $56 | 82 |
| 2314 S Grand Traverse St | 0.38mi | 2/1.5 | 922 (-5%) | 7mo | $30,000 | $33 | 66 |
| 1514 Vermilya Ave | 0.67mi | 2/1.0 | 952 (-2%) | 0mo | $66,000 | $69 | 66 |
| 1105 Lincoln Ave | 0.58mi | 2/1.0 | 896 (-7%) | 2mo | $38,000 | $42 | 59 |
| 727 Waldman Ave | 0.66mi | 3/1.0 (+1) | 956 (-1%) | 5mo | $79,600 | $83 | 58 |
| 1209 Lincoln Ave | 0.62mi | 2/1.0 | 925 (-4%) | 6mo | $52,400 | $57 | 58 |
| 1517 Tacoma St | 0.47mi | 3/1.0 (+1) | 875 (-10%) | 1mo | $46,500 | $53 | 56 |
| 934 Campbell St | 0.70mi | 3/1.0 (+1) | 924 (-4%) | 1mo | $89,000 | $96 | 54 |
| 730 Freeman Ave | 0.42mi | 2/1.0 | 836 (-14%) | 6mo | $27,000 | $32 | 53 |
| 737 Campbell St | 0.74mi | 3/1.0 (+1) | 947 (-2%) | 4mo | $84,700 | $89 | 53 |
| 3805 Brunswick Ave | 0.68mi | 3/1.0 (+1) | 921 (-5%) | 4mo | $25,000 | $27 | 52 |
| 1225 Vermilya Ave | 0.59mi | 2/1.0 | 831 (-14%) | 5mo | $15,000 | $18 | 44 |
Match score weights: distance 35% · size 25% · config 20% · recency 20%. Top-matched comps best support the ARV.
Projected returns pro-forma
-3.0% appreciation · 0.0% rent growth · sell at horizon
- IRR
- —
- Equity multiple
- 13.41×
- Total profit
- $34,757
- Equity at exit
- $1,491
- IRR
- —
- Equity multiple
- 26.23×
- Total profit
- $70,647
- Equity at exit
- $865
Cash invested: $2,800 (down + closing). Projections, not guarantees.
Landlord ↔ Tenant lean methodology
- Overall (STATE)
- 62 Landlord-Friendly
- State Michigan
- 62 Landlord-Friendly · EVEN
- County
- — inherits STATE
- City
- — inherits STATE
ZIP-level market 48507
- Rents YoY
- -1.0%
- Active inventory
- 206
- Price-to-rent
- 1.0×
Monthly cashflow live
- Estimated rent
- $860 high interval (Pro) →
- Mortgage (P&I)
- −$52
- Tax est. 1.5%
- −$12 /mo · $150/yr
- Insurance
- −$4
- HOA
- −$0
- Vacancy / Maint / Mgmt
- −$181
- Net cashflow
- $611
Break-even live
Sensitivity live
| Price | -10% $617 | -5% $614 | +0% $611 | +5% $607 | +10% $604 |
|---|---|---|---|---|---|
| Rent | -10% $543 | -5% $577 | +0% $611 | +5% $645 | +10% $679 |
| Rate | -1.0pp $616 | -0.5pp $613 | base $611 | +0.5pp $608 | +1.0pp $605 |
UW: 25.0% down · 7.5% · 30yr · 1.5% tax · 5.0% vac · 8.0% maint · 8.0% mgmt
Financing live
Cash to close
- Down payment
- $2,500
- Closing costs
- $300
- Reserves months
- —
- Total cash needed
- —
Loan-product check · same deal, 3 products live
Conventional
25% down · 7.5% · 30yr
- Down + closing
- —
- Monthly P&I
- —
- Monthly cashflow
- —
- DSCR
- —
- Eligible?
- —
Personal DTI + credit; lowest rate.
DSCR
20% down · 8.5% · 30yr
- Down + closing
- —
- Monthly P&I
- —
- Monthly cashflow
- —
- DSCR
- —
- Eligible?
- —
No personal income docs; deal must DSCR.
Hard money
10% down · 12.0% · 12mo
- Down + closing
- —
- Monthly P&I
- —
- Monthly cashflow
- —
- DSCR
- —
- Eligible?
- —
Short-term bridge; refi at stabilization.
Rent comps 5 comps
| Address | Beds | Baths | Sqft | Rent | $/sqft | DOM | Units | Dist |
|---|---|---|---|---|---|---|---|---|
| 1023 Barrie Ave Flint, MI | 2.0 | 1.0 | 660 | $775 | $1.17 | 21d | 1 | 0.29mi |
| 1426 Pettibone Ave Flint, MI | 2.0 | 1.0 | 750 | $900 | $1.20 | 21d | 1 | 0.71mi |
| 813 Alvord Ave Flint, MI | 2.0 | 1.0 | 724 | $850 | $1.17 | 14d | 1 | 0.86mi |
| 410 Lippincott Blvd Flint, MI | 2.0 | 1.0 | 800 | $695 | $0.87 | 14d | 1 | 0.94mi |
| 4400 Kings Ln Burton, MI | 1.0–2.0 | 1.0–2.0 | 666 | $960 | $1.44 | 14d | 19 | 1.28mi |
Listing history 25 events
-
2026-06-18days on market $10,000 Active 38 DOM
-
2026-06-17days on market $10,000 Active 37 DOM
-
2026-06-16days on market $10,000 Active 36 DOM
-
2026-06-15days on market $10,000 Active 35 DOM
-
2026-06-14days on market $10,000 Active 33 DOM
-
2026-06-13days on market $10,000 Active 32 DOM
-
2026-06-10days on market $10,000 Active 30 DOM
-
2026-06-09days on market $10,000 Active 29 DOM
-
2026-06-08days on market $10,000 Active 28 DOM
-
2026-06-07days on market $10,000 Active 27 DOM
-
2026-06-05days on market $10,000 Active 24 DOM
-
2026-06-03days on market $10,000 Active 23 DOM
-
2026-06-02days on market $10,000 Active 22 DOM
-
2026-06-01days on market $10,000 Active 21 DOM
-
2026-05-31days on market $10,000 Active 20 DOM
-
2026-05-30days on market $10,000 Active 19 DOM
-
2026-05-11$10,000 Active
Show marketing remark (340 chars)
Opportunity awaits with this fire-damaged home, ready for restoration or redevelopment. The property has experienced fire damage and is being sold as-is, offering excellent potential for investors, contractors, or buyers looking for a renovation project. Buyer to verify all measurements, condition, permits, and repair requirements. BATVAI
-
2026-05-11$10,000 Active 340-char remark
Show marketing remark (340 chars)
Opportunity awaits with this fire-damaged home, ready for restoration or redevelopment. The property has experienced fire damage and is being sold as-is, offering excellent potential for investors, contractors, or buyers looking for a renovation project. Buyer to verify all measurements, condition, permits, and repair requirements. BATVAI
-
2006-04-05soldstatus $25,000 249-char remark
Show marketing remark (249 chars)
Attention Investors & 1st Time Home Buyers! Move In Condition. Well Kept Two Bedrm Home W/ Finished 12x24 Rec Rm Or 3rd Bedrm In Bsmnt, Covered Front Porch W/ Swing & Fenced Backyard. Newer Shingles, Central Air & Hot Water Heater.
-
2006-04-05soldstatus $25,000
Show marketing remark (249 chars)
Attention Investors & 1st Time Home Buyers! Move In Condition. Well Kept Two Bedrm Home W/ Finished 12x24 Rec Rm Or 3rd Bedrm In Bsmnt, Covered Front Porch W/ Swing & Fenced Backyard. Newer Shingles, Central Air & Hot Water Heater.
-
2006-04-05soldstatus $25,000
Show marketing remark (249 chars)
Attention Investors & 1st Time Home Buyers! Move In Condition. Well Kept Two Bedrm Home W/ Finished 12x24 Rec Rm Or 3rd Bedrm In Bsmnt, Covered Front Porch W/ Swing & Fenced Backyard. Newer Shingles, Central Air & Hot Water Heater.
-
2006-03-10historical
-
2005-10-12$27,900
-
2005-10-11$27,900 249-char remark
Show marketing remark (249 chars)
Attention Investors & 1st Time Home Buyers! Move In Condition. Well Kept Two Bedrm Home W/ Finished 12x24 Rec Rm Or 3rd Bedrm In Bsmnt, Covered Front Porch W/ Swing & Fenced Backyard. Newer Shingles, Central Air & Hot Water Heater.
-
2005-10-11$27,900
Show marketing remark (249 chars)
Attention Investors & 1st Time Home Buyers! Move In Condition. Well Kept Two Bedrm Home W/ Finished 12x24 Rec Rm Or 3rd Bedrm In Bsmnt, Covered Front Porch W/ Swing & Fenced Backyard. Newer Shingles, Central Air & Hot Water Heater.
ⓘ Source: listings_history table (triggers on properties + properties_extension) + one-shot
backfill from property_details.listing_events for pre-trigger history.
Climate risk First Street
- Flood 1/10 Low FEMA zone X (unshaded) · 0% chance over 30 yrs
- Wildfire 1/10 Low
- Heat 2/10 Low 7 d/yr ≥97°F today · 15 d/yr by 30 yrs out
- Wind 2/10 Low
- Air quality 3/10 Moderate 3 unhealthy d/yr today · 4 by 30 yrs out
Nearby sold comps map
Loading sold comps map…
Walkable amenities ~0.75 mi
Loading nearby amenities…
Taxation est. · year 1
- Rental income
- $10,324
- − Mortgage interest
- −$560
- − Property taxes
- −$150
- − Insurance
- −$50
- − Repairs & maintenance
- −$826
- − Management
- −$826
- − Depreciation
- −$291
- Taxable income
- $7,621
- Est. tax owed @ 24.0%
- −$1,829
- After-tax cash flow
- $5,498/yr
For passive investors: Depreciation is non-cash, so a rental often shows a tax loss while cash-flowing — sheltering income. Rental losses are passive: they offset passive income freely, and up to $25,000/yr can offset ordinary (W-2) income if you actively participate and your MAGI is under $100k (phasing out to $0 by $150k); unused losses carry forward. On sale, claimed depreciation is recaptured at up to 25%, and gains may owe capital-gains tax (a 1031 exchange can defer both). Figures are a year-1 estimate at your 24.0% rate — not tax advice; consult a CPA.
Schools (NCES district)
- District
- Flint School District
- NCES district ID
- 2614520
- Math proficiency
- 7% ▬ 0.00%
- Reading proficiency
- 13% ▲ 3.00%
- Median HH income
- $25,954
- Composite
- 10.97/100
- National rank
- #14642
- State rank
- #714 of 760 in MI
Livability — Flint
- Score
- 74/100
- State rank
- #196
- US rank
- #4946
Category grades
Schools grade is shown separately in the Schools card above.
Census & demographics
- Census place
- Flint, MI
- County
- Genesee County · 221,329 people
- City population
- 93,814
- Metro
- Flint, MI
- Population (ZIP)
- 28,723
- Household income
- $46,554
- Rent vs Own
- Severe rent burden
- 1534.0
Population outlook (Genesee County) Hauer SSP2
- Today (2025)
- 381,312 people
- By 2030
- 362,731 · -4.9%
- By 2040
- 321,550 · -15.7%
- By 2050
- 279,212 · -26.8%
- By 2075
- 193,336 · -49.3%
- By 2100
- 128,118 · -66.4%
Race, ethnicity, and origin ACS 2023
- Neighborhood character
- Diverse neighborhood (Simpson 0.57)
- Race & ethnicity
- White 59% Black 28% Two or more races 10% Hispanic / Latino 5%
- Common ancestry
- Lithuanian 4% Romanian 3% Slovak 2%
- Foreign-born
- 1% · Canada
- Languages at home
- 97% English-only · Spanish 1% Other Asian/Pacific 1%
Political lean MEDSL · Genesee
- 2024 margin
- Toss-up / Even · D 51.4% · R 47.2% · Other 1.4%
- 2008→2024 swing
- -28.3pp toward R · 2008: 32.5pp · 2024: 4.2pp
- All cycles
- 2024: D+4.2 2020: D+9.3 2016: D+9.5 2012: D+28.2 2008: D+32.5
Not yet ingested
- Civics
- —
Market trends
- HPI YoY
- ▼ -154.90%
- Current HPI
- 132.3632
- Rent YoY
- ▼ -1.04%
- Metro
- Flint, MI
- State GDP YoY
- ▲ 1.37%
- F500 in state
- 28
Industry mix (Fortune 500 HQ in MI)
| Industry | F500 HQs | Revenue |
|---|---|---|
| Automotive Parts | 3 | $48B |
|
||
| Automotive | 2 | $372B |
|
||
| Chemicals | 1 | $45B |
|
||
| Automotive Retail | 1 | $29B |
|
||
| Healthcare / Medical Devices | 1 | $23B |
|
||
| Automotive Technology | 1 | $20B |
|
||
Price history
-64.2% since first listed9 events — show timeline
- 2026-05-11 Listed $10,000 MiRealSource-MiMLS
- 2026-05-11 Listed $10,000 REALCOMP
- 2006-04-05 Sold (MLS) $25,000 REALCOMP
- 2006-04-05 Sold (MLS) $25,000 MiRealSource-MiMLS
- 2006-04-05 Sold (MLS) $25,000 REALCOMP
- 2006-03-10 Listing Removed — MiRealSource-MiMLS
- 2005-10-12 Listed $27,900 REALCOMP
- 2005-10-11 Listed $27,900 MiRealSource-MiMLS
- 2005-10-11 Listed $27,900 REALCOMP
Property tax history
-6.5%/yrLatest (2025): $722 · +1.4% YoY. Source: county tax records.
Cash-flow waterfall
monthlySold comps — $/sqft
last 12 mo · ≤1 miLoading sold comps…