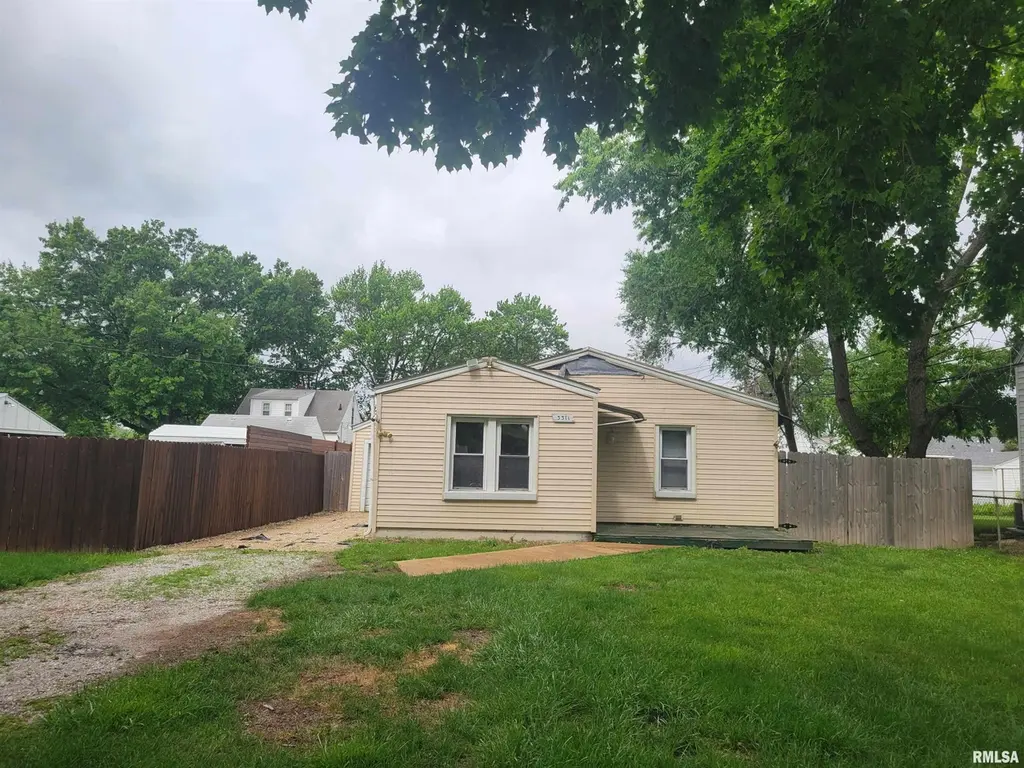
3311 N Leroy Ave · Peoria, IL
Flood risk 1/10 · Minimal
- FEMA flood zone
- X
- Chance of flooding over 30 yrs
- 0.0%
- Est. flood insurance / yr
- $507 – $1,088
Fire risk 1/10 · Minimal
- Est. fire insurance / yr
- $804 – $1,492
Heat risk 3/10 · Minor
- Hot days now (above 105°F)
- 7 days/yr
- Hot days in 30 yrs
- 18 days/yr
Wind risk 2/10 · Minimal
- Chance of severe wind over 30 yrs
- 1.0%
Air-quality risk 3/10 · Minor
- Unhealthy air days now
- 1 days/yr
- Unhealthy air days in 30 yrs
- 3 days/yr
Risk factors via First Street. Map © Google.
Why this score? — see what drove the C- grade
The composite is a weighted blend of 9 inputs, each scored 0–100. Each bar is that input's sub-score; the figure is the points it added to the 100-point composite (weight × sub-score).
- Cash flow +15.0/30.0
- ARV discount +15.0/15.0
- 1% rule +5.0/10.0
- DSCR +5.0/10.0
- Livability +3.7/5.0
- Rent growth +3.1/5.0
- Condition / age +2.5/5.0
- Schools +1.1/10.0
- Appreciation +0.0/10.0
$21,900
🖨 Deal sheet 📄 Offer letter ✓ Due diligence
Listing remarks MLS
Rent keeps going up why don't you consider purchasing instead. This one bedroom Home has a spacious Living Room with partial Cathedral ceiling. Kitchen includes all appliances. Full bathroom. Detached 1 car garage. All measurements are approx. & not deemed reliable. Call for an appt. today.
Key facts
- 6,600 sq ft lot
- Garage
- Built 1959
Property features AI
Finance
- Other: Zoned RES
- HOA & community: No association fee
Exterior
- Parking: Detached 1-car garage
- Utilities: Public water; Public sewer
- Home design: Single family residence; Built in 1959
- Construction: Shingle roof
- Exterior features: Level lot; Paved road frontage
Interior
- Kitchen: Kitchen on main level (approximately 8' x 7')
- Bedrooms: 1 bedroom on the main level (approximately 11' x 11') with an egress window
- Flooring: Other flooring throughout listed rooms
- Bathrooms: 1 full bathroom
- Heating & cooling: Gas water heater (heating listed as Gas Water Heater)
- Interior features: Crawl space basement; No fireplaces
- Laundry & utility: Gas water heater
Neighborhood map
What this means for you Summary
Snapshot
- This is a 2-bed/1.0-bath single-family listed at $22k.
Deal economics
- At list price, monthly cash flow is $638 ($8k/yr) — positive.
- The deal already cash-flows at list — no discount required.
- Meets the 1% rule at list price ($994 rent vs $22k).
- Cap rate 41.3% vs local median 5.6% in Peoria — top-decile yield for the area; either an underpriced asset or a hidden risk that comps aren't pricing in. Stress-test before assuming the spread holds.
Location & tenants
- Location reads 73/100 on livability (#270 in IL) — a middle-class / working-renter tenant base. Strengths: commute A+, cost of living A+, housing A+; Watch: employment D+, crime F.
- Peoria SD 150 (urban): math 11% / reading 14% proficiency, ranked #554 of 620 in IL (top 89%) — low school quality limits family demand, transient renter base, plan for 1-2y turnover; 70% free/reduced lunch — lower-income household profile, screen leases tightly.
- Zoned schools: Peoria High School (math 4% / reading 7%, grade F, #609 of 693 statewide, top 88%, 1,447 students, 0% FRL) — zoned schools average 0% FRL vs 70% district-wide (70 pts lower); this property's tenant base skews higher-income than the district average.
- Market conditions: Rents rising (+2.3%/yr); 180 active listings in the ZIP; 7 comparable units currently listed for rent nearby; rentals leasing fast (median 14d on market — plan ~1-2 weeks tenant-placement turnaround); 73 units permitted in Peoria County in 2024 (0 in 5+ unit buildings).
Forward outlook
- Local home prices are declining (-3.0%/yr); year-one equity from $151 of loan paydown is wiped out by about $657 of value loss. Plan a longer hold.
- Peoria County population projected at -11% by 2050 — secular population decline; favor cash flow + early exit over multi-decade hold.
- At projected returns (-3.0% appreciation + 2.3% rent growth), your $6k cash investment doubles in ~1 year — after that, you're playing with house money.
Negotiation context
- Only 7 days on market — expect competitive offers; lowballing is unlikely to land.
- 2 sale attempts since 5y ago with the ask held roughly flat each time — persistent listings suggest the price (not the market) is what's stuck; bring a comps-based counter.
Risks & watch-outs
- Watch-outs: built in 1959 — expect roof / HVAC / electrical / plumbing capex.
Questions for the listing agent
- Built in 1959 — when were the roof, HVAC, electrical panel, plumbing, and water heater last replaced?
- Is there a deadline driving the sale (1031 exchange, divorce, estate, relocation)? That informs how much negotiation room exists.
- Schools are F-rated, which usually means shorter tenancies and higher turnover. Who's the typical renter profile here, and what's been the actual vacancy rate?
- Crime grade is F in this area — have there been break-ins, vandalism, or insurance claims at this property in the last 3 years? What carrier currently insures it and at what premium?
- What's the average days-on-market for RENTAL listings here right now (not sales)? A rising rental-DOM trend means longer vacancies and softer asking-rent achievability than the comps imply.
- What's the recent tenant-quality profile in this submarket — average credit score on applications, eviction rate, late-payment / NSF rate, and stable-employment percentage? A property-management company in the area should have these aggregated.
- How much new for-sale + rental construction is in the pipeline within 1–3 miles? Heavy new supply typically softens prices + rents 12–24 months out; constrained supply supports both.
Investment metrics
- 1% rule
- 4.54% ✓
- Cap rate
- 41.26%
- Cash-on-cash
- 124.88%
- DSCR
- 6.56
- GRM
- 1.8
CMA / ARV
- ARV (on-the-fly)
- $28,728
- Comps found
- 7
Show comp detail 7 sales within ~0.75 mi
| Address | Dist | Beds/Ba | Sqft | Sold | Price | $/sf | Match |
|---|---|---|---|---|---|---|---|
| 3311 N Leroy Ave | 0.00mi | 1/1.0 (-1) | 504 (0%) | 0mo | $18,500 | $37 | 95 |
| 2218 W Tripp Ave | 0.06mi | 1/1.0 (-1) | 480 (-5%) | 4mo | $30,000 | $63 | 81 |
| 3220 N Gale Ave | 0.23mi | 2/1.0 | 464 (-8%) | 8mo | $37,500 | $81 | 69 |
| 1917 W Hudson St | 0.36mi | 2/1.0 | 560 (+11%) | 2mo | $32,000 | $57 | 63 |
| 3336 N Sterling Ave | 0.11mi | 1/1.0 (-1) | 440 (-13%) | 10mo | $31,000 | $70 | 60 |
| 2232 W Albany St | 0.07mi | 1/1.0 (-1) | 440 (-13%) | 14mo | $25,000 | $57 | 59 |
| 3520 N Finnell Ave | 0.26mi | 1/1.0 (-1) | 572 (+14%) | 8mo | $11,500 | $20 | 54 |
Match score weights: distance 35% · size 25% · config 20% · recency 20%. Top-matched comps best support the ARV.
Projected returns pro-forma
-3.0% appreciation · 2.3% rent growth · sell at horizon
- IRR
- —
- Equity multiple
- 6.94×
- Total profit
- $36,412
- Equity at exit
- $3,265
- IRR
- —
- Equity multiple
- 14.25×
- Total profit
- $81,279
- Equity at exit
- $1,894
Cash invested: $6,132 (down + closing). Projections, not guarantees.
Landlord ↔ Tenant lean methodology
- Overall (STATE)
- 43 Moderately Tenant-Leaning
- State Illinois
- 43 Moderately Tenant-Leaning · D+7
- County
- — inherits STATE
- City
- — inherits STATE
ZIP-level market 61604
- Home prices YoY
- -24.6%
- Rents YoY
- 2.3%
- Active inventory
- 180
- Price-to-rent
- 1.8×
Monthly cashflow live
- Estimated rent
- $994 high interval (Pro) →
- Mortgage (P&I)
- −$115
- Tax from tax record
- −$23 /mo · $277/yr
- Insurance
- −$9
- HOA
- −$0
- Vacancy / Maint / Mgmt
- −$209
- Net cashflow
- $638
Break-even live
UW: 25.0% down · 7.5% · 30yr · 1.5% tax · 5.0% vac · 8.0% maint · 8.0% mgmt
Financing live
Cash to close
- Down payment
- $5,475
- Closing costs
- $657
- Reserves months
- —
- Total cash needed
- —
Loan-product check · same deal, 3 products live
Conventional
25% down · 7.5% · 30yr
- Down + closing
- —
- Monthly P&I
- —
- Monthly cashflow
- —
- DSCR
- —
- Eligible?
- —
Personal DTI + credit; lowest rate.
DSCR
20% down · 8.5% · 30yr
- Down + closing
- —
- Monthly P&I
- —
- Monthly cashflow
- —
- DSCR
- —
- Eligible?
- —
No personal income docs; deal must DSCR.
Hard money
10% down · 12.0% · 12mo
- Down + closing
- —
- Monthly P&I
- —
- Monthly cashflow
- —
- DSCR
- —
- Eligible?
- —
Short-term bridge; refi at stabilization.
Rent comps 7 comps
| Address | Beds | Baths | Sqft | Rent | $/sqft | DOM | Units | Dist |
|---|---|---|---|---|---|---|---|---|
| 2805 W Larchmont Ln Peoria, IL | 1.0–2.0 | 1.0 | 695 | $1,060 | $1.53 | 13d | 3 | 0.71mi |
| 4010 N Brandywine Dr Peoria, IL | 1.0–2.0 | 1.0–2.0 | 797 | $1,082 | $1.36 | 13d | 17 | 0.80mi |
| 2600 N Lavalle Ct Peoria, IL | 1.0–3.0 | 1.0–2.0 | 803 | $1,000 | $1.25 | 13d | 26 | 1.15mi |
| 4020 N Bryer Pl Peoria, IL | 2.0 | 1.0 | 720 | $1,250 | $1.74 | 21d | 1 | 1.29mi |
| 2214 N Linsley St Peoria, IL | 2.0 | 1.0 | 575 | $550 | $0.96 | 43d | 1 | 1.40mi |
| W Crestwood Dr Peoria, IL | 1.0–2.0 | 1.0 | 800 | $975 | $1.22 | 13d | 4 | 1.42mi |
| 905 W Thrush Ave Peoria, IL | 2.0 | 1.0 | 750 | $950 | $1.27 | 21d | 1 | 1.49mi |
Listing history 5 events
-
2026-05-20$21,900 Active
-
2021-12-07soldstatus $41,500
-
2021-12-01soldstatus $41,500 296-char remark
Show marketing remark (296 chars)
Rent keeps going up why don't you consider purchasing instead. This one bedroom Home has a spacious Living Room with partial Cathedral ceiling. Kitchen includes all appliances. Full bathroom. Detached 1 car garage. All measurements are approx. & not deemed reliable. Call for an appt. today.
-
2021-07-24$44,900 296-char remark
Show marketing remark (296 chars)
Rent keeps going up why don't you consider purchasing instead. This one bedroom Home has a spacious Living Room with partial Cathedral ceiling. Kitchen includes all appliances. Full bathroom. Detached 1 car garage. All measurements are approx. & not deemed reliable. Call for an appt. today.
-
2004-12-03soldstatus $34,000
ⓘ Source: listings_history table (triggers on properties + properties_extension) + one-shot
backfill from property_details.listing_events for pre-trigger history.
Tax reassessment forecast IL · Partial reset (capped growth)
- Current annual tax
- $277 · $23/mo
- Projected year-2 tax
- $387 · $32/mo
- Expected delta
- +$110/yr (+$9/mo · 39.8%)
ⓘ Screening estimate from a state-policy table — verify with the county assessor before closing.
Climate risk First Street
- Flood 1/10 Low FEMA zone X · 0% chance over 30 yrs
- Wildfire 1/10 Low
- Heat 3/10 Moderate 7 d/yr ≥105°F today · 18 d/yr by 30 yrs out
- Wind 2/10 Low 100% chance of damaging wind over 30 yrs
- Air quality 3/10 Moderate 1 unhealthy d/yr today · 3 by 30 yrs out
Nearby sold comps map
Loading sold comps map…
Walkable amenities ~0.75 mi
Loading nearby amenities…
Taxation est. · year 1
- Rental income
- $11,927
- − Mortgage interest
- −$1,227
- − Property taxes
- −$277
- − Insurance
- −$110
- − Repairs & maintenance
- −$954
- − Management
- −$954
- − Depreciation
- −$637
- Taxable income
- $7,768
- Est. tax owed @ 24.0%
- −$1,864
- After-tax cash flow
- $5,793/yr
For passive investors: Depreciation is non-cash, so a rental often shows a tax loss while cash-flowing — sheltering income. Rental losses are passive: they offset passive income freely, and up to $25,000/yr can offset ordinary (W-2) income if you actively participate and your MAGI is under $100k (phasing out to $0 by $150k); unused losses carry forward. On sale, claimed depreciation is recaptured at up to 25%, and gains may owe capital-gains tax (a 1031 exchange can defer both). Figures are a year-1 estimate at your 24.0% rate — not tax advice; consult a CPA.
Schools (NCES district)
- District
- Peoria SD 150
- NCES district ID
- 1731230
- Math proficiency
- 11% ▼ -5.00%
- Reading proficiency
- 14% ▼ -4.00%
- Median HH income
- $41,951
- Composite
- 10.92/100
- National rank
- #9751
- State rank
- #554 of 620 in IL
Livability — Peoria
- Score
- 73/100
- State rank
- #270
- US rank
- #5096
Category grades
Schools grade is shown separately in the Schools card above.
Census & demographics
- Census place
- Peoria, IL
- County
- Peoria County · 120,495 people
- City population
- 114,670
- Metro
- Peoria, IL
- Population (ZIP)
- 28,313
- Household income
- $52,414
- Rent vs Own
- Severe rent burden
- 815.0
Population outlook (Peoria County) Hauer SSP2
- Today (2025)
- 183,007 people
- By 2030
- 179,643 · -1.8%
- By 2040
- 171,782 · -6.1%
- By 2050
- 163,508 · -10.7%
- By 2075
- 140,178 · -23.4%
- By 2100
- 114,493 · -37.4%
Race, ethnicity, and origin ACS 2023
- Neighborhood character
- Diverse neighborhood (Simpson 0.61)
- Race & ethnicity
- White 55% Black 29% Two or more races 10% Hispanic / Latino 7% Asian 2%
- Hispanic origin (detail)
- Mexican 5%
- Common ancestry
- Italian 2% Slovak 1% Iranian 1%
- Foreign-born
- 6% · Canada, China
- Languages at home
- 92% English-only · Spanish 4% Chinese 1% French/Haitian/Cajun 1%
Political lean MEDSL · Peoria
- 2024 margin
- Toss-up / Even · D 51.5% · R 46.9% · Other 1.6%
- 2008→2024 swing
- -9.2pp toward R · 2008: 13.9pp · 2024: 4.7pp
- All cycles
- 2024: D+4.7 2020: D+6.3 2016: D+2.8 2012: D+4.4 2008: D+13.9
Not yet ingested
- Civics
- —
Market trends
- HPI YoY
- ▼ -54.15%
- Current HPI
- 165.8838
- Rent YoY
- ▲ 2.30%
- Metro
- Peoria, IL
- State GDP YoY
- ▲ 1.59%
- F500 in state
- 60
Industry mix (Fortune 500 HQ in IL)
| Industry | F500 HQs | Revenue |
|---|---|---|
| Insurance | 4 | $201B |
|
||
| Consumer Goods | 4 | $87B |
|
||
| Industrial Machinery | 3 | $64B |
|
||
| Healthcare | 2 | $55B |
|
||
| Retail / Pharmacy | 1 | $148B |
|
||
| Agriculture / Food | 1 | $86B |
|
||
Price history
-35.6% since first listed5 events — show timeline
- 2026-05-20 Listed $21,900 RMLSA as Distributed by MLS Grid
- 2021-12-07 Sold (Public Records) $41,500 Public Records
- 2021-12-01 Sold (MLS) $41,500 RMLSA as Distributed by MLS Grid
- 2021-07-24 Listed $44,900 RMLSA as Distributed by MLS Grid
- 2004-12-03 Sold (Public Records) $34,000 Public Records
Property tax history
-12.3%/yrLatest (2024): $277 · -47.0% YoY. Source: county tax records.
Cash-flow waterfall
monthlySold comps — $/sqft
last 12 mo · ≤1 miLoading sold comps…