 Duplex
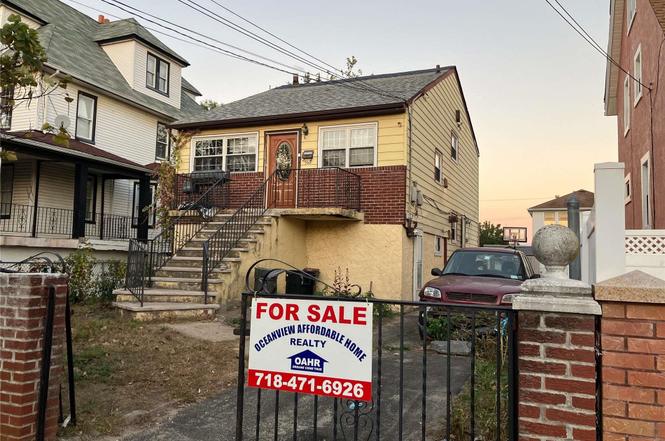
560 Beach 68th St · New York, NY
Flood risk 9/10 · Severe
- FEMA flood zone
- AE
- Chance of flooding over 30 yrs
- 0.99%
- Est. flood insurance / yr
- $1,737 – $8,500
Fire risk 1/10 · Minimal
- Est. fire insurance / yr
- $691 – $1,283
Heat risk 7/10 · Major
- Hot days now (above 96°F)
- 7 days/yr
- Hot days in 30 yrs
- 16 days/yr
Wind risk 6/10 · Moderate
- Chance of severe wind over 30 yrs
- 77.0%
Air-quality risk 3/10 · Minor
- Unhealthy air days now
- 4 days/yr
- Unhealthy air days in 30 yrs
- 4 days/yr
Risk factors via First Street. Map © Google.
Why this score? — see what drove the C grade
The composite is a weighted blend of 9 inputs, each scored 0–100. Each bar is that input's sub-score; the figure is the points it added to the 100-point composite (weight × sub-score).
- Cash flow +20.0/30.0
- Appreciation +10.0/10.0
- DSCR +6.4/10.0
- ARV discount +5.5/15.0
- Schools +5.0/10.0
- 1% rule +4.3/10.0
- Livability +3.8/5.0
- Rent growth +2.5/5.0
- Condition / age +2.5/5.0
$789,999
🖨 Deal sheet (PDF) 📄 Offer letter ✓ Due diligence
Multi-family units
County records classify this as Multi-Family (2-4 Unit). Listing-text estimate: 2 units. confirmed
Listing remarks
WELCOME TO THIS EXQUISITE 2 FAMILY IN THE HEART OF ARVERNE BY THE SEA AREA 5 BEDROOMSS AND 3FULL BATHROOMS SET UP AS 3BEDROM LR, FULL BATH EIK ON 2ND FLOOR AND ONE BEDROOM FULL BATH EIK AND STUDIO UNIT MAKE THE PROPERTY TWO FARMING MISCELLANEOUS . OWNER UINT THREE BEDROOM UINT AND TOP FLOOR AND POSSIBLE ADDEDTION TWO RENTALS UINT . THIS WILL NOT LAST GRATE INCOME PRODUCTION PROPERTY CALL TO SCHEDULE YOUR SHOWING TODAY. , Additional information: , Separate Hotwater Heater:YES
Key facts
- 4,000 sq ft lot
- 4 parking spots
- Built 1980
Property features AI
Exterior
- Parking: Private driveway parking for 4 vehicles
- Utilities: Public sewer
- Home design: Duplex
- Construction: Brick, frame, and aluminum siding construction
- Exterior features: Near public transit; Near school
Interior
- Bedrooms: One 3-bedroom unit (multi-unit property)
- Heating & cooling: Natural gas heating; Baseboard heating; Wall/window air conditioning units
- Interior features: Two levels; Ten total rooms; No basement; No attic
Neighborhood map
What this means for you Summary
Snapshot
- This is a 2 × 3-bed/?-bath units multifamily listed at $790k.
Deal economics
- At list price, monthly cash flow is $548 ($7k/yr) — positive. Per door: $274/mo.
- The deal already cash-flows at list — no discount required.
- To meet the 1% rule (rent ≥ 1% of price), the offer needs to be $737k (6.8% below list).
- Recommended offer: $695k (12.0% below list) — sets the bar for market timing.
- Cap rate 7.8% vs local median 2.6% in New York — top-decile yield for the area; either an underpriced asset or a hidden risk that comps aren't pricing in. Stress-test before assuming the spread holds.
Location & tenants
- Location reads 75/100 on livability (#268 in NY, #4,188 nationally) — a middle-class / working-renter tenant base. Strengths: amenities A+, commute A+, health & safety A; Watch: crime F, cost of living F.
- Market conditions: 80 active listings in the ZIP; 5,302 units permitted in Queens County in 2024 (4,918 in 5+ unit buildings).
- At $7,366/mo this rent would consume 178% of the median local household income ($50k/yr) (locally 1734% of renters already pay >50% of income on rent) — very limited rent-growth headroom before tenants either downsize or default.
Forward outlook
- In year one you build about $84k of equity ($5k loan paydown + $79k appreciation (10.0% local appreciation)).
- Queens County population projected at +16% by 2050 — long-run rental-demand tailwind backs the buy-and-hold thesis.
- At projected returns (10.0% appreciation + 3.0% rent growth), your $221k cash investment doubles in ~3 years — after that, you're playing with house money.
- By year 2, paydown + projected appreciation supports a ~$136k cash-out refi (75% LTV) — recoverable capital for the next deal without selling this one.
Negotiation context
- It's been on market 604 days — a 12% lower offer ($695k) is reasonable based on typical stale-listing flexibility.
- Current owner paid $245k; list at $790k implies a 222% gain — meaningful room to come down on a strong offer.
Risks & watch-outs
- Watch-outs: flood insurance adds $427/mo.
- Climate carrying-cost: in FEMA flood zone AE (mandatory federal flood insurance); major wind risk, 77% chance of damaging wind over 30y; extreme-heat days projected 7→16/yr by 2055 (HVAC capex compounding) — expect insurance premiums to compound above CPI over the hold.
Questions for the listing agent
- It's been on market 604 days. Have you received any prior offers? Is the seller open to a 12% concession, seller financing, or rate buy-down credit?
- Can we see the unit-by-unit rent roll, current vacancy, and any below-market leases? What's the average tenancy length?
- What capital expenditures (roof, boiler, parking lot, exteriors) have been made in the last 5 years, and what's planned in the next 2?
- What's the actual annual flood-insurance premium (NFIP or private), and is the property in a SFHA with mandatory coverage?
- Why hasn't it sold? Are there any deal-killer items the seller is aware of (foundation, flood, title, zoning, code violations)?
- Is there a deadline driving the sale (1031 exchange, divorce, estate, relocation)? That informs how much negotiation room exists.
- Schools are B-rated — typically a magnet for longer-tenancy family renters. What's the average tenant stay here, and is there a school-zone premium baked into asking?
- Crime grade is F in this area — have there been break-ins, vandalism, or insurance claims at this property in the last 3 years? What carrier currently insures it and at what premium?
- What's the average days-on-market for RENTAL listings here right now (not sales)? A rising rental-DOM trend means longer vacancies and softer asking-rent achievability than the comps imply.
- What's the recent tenant-quality profile in this submarket — average credit score on applications, eviction rate, late-payment / NSF rate, and stable-employment percentage? A property-management company in the area should have these aggregated.
- How much new apartment / multifamily construction is in the pipeline within 1–3 miles? Heavy new supply (>2% of stock underway) typically softens rents 12–24 months out; light construction supports rent growth.
Investment metrics
- 1% rule
- 0.93% ✗
- Cap rate
- 7.77%
- Cash-on-cash
- 5.29%
- DSCR
- 1.24
- GRM
- 8.9
CMA / ARV
- ARV (on-the-fly)
- $755,664
- Comps found
- 10
Show comp detail 10 sales within ~0.75 mi
| Address | Dist | Beds/Ba | Sqft | Sold | Price | $/sf | Match |
|---|---|---|---|---|---|---|---|
| 463 Beach 68th St | 0.14mi | 7/4.0 (+1) | 2,200 (+1%) | 1mo | $905,000 | $411 | 87 |
| 62-04 Hillmeyer Rd | 0.36mi | 6/4.0 | 2,200 (+1%) | 10mo | $995,000 | $452 | 73 |
| 609 Beach 63rd St | 0.23mi | 5/2.0 (-1) | 2,068 (-5%) | 7mo | $565,000 | $273 | 69 |
| 69-43 Thursby Ave | 0.20mi | 5/2.0 (-1) | 2,068 (-5%) | 11mo | $810,000 | $392 | 67 |
| 6235 Burchell Rd | 0.25mi | 5/3.0 (-1) | 2,000 (-8%) | 5mo | $867,347 | $434 | 65 |
| 156 Beach 60th St | 0.58mi | 6/2.0 | 2,386 (+9%) | 2mo | $505,000 | $212 | 56 |
| 193 Beach 59th St | 0.54mi | 5/3.0 (-1) | 2,052 (-6%) | 6mo | $710,000 | $346 | 55 |
| 160 Beach 60 St | 0.57mi | 6/4.0 | 2,386 (+9%) | 7mo | $760,000 | $319 | 52 |
| 65-05 Beach Channel Dr | 0.30mi | 5/2.0 (-1) | 2,024 (-7%) | 21mo | $700,000 | $346 | 51 |
| 345 Beach 73rd St | 0.38mi | 5/2.0 (-1) | 1,926 (-12%) | 13mo | $550,000 | $286 | 46 |
Match score weights: distance 35% · size 25% · config 20% · recency 20%. Top-matched comps best support the ARV.
Projected returns pro-forma
10.0% appreciation · 3.0% rent growth · sell at horizon
- IRR
- 26.4%
- Equity multiple
- 3.10×
- Total profit
- $465,153
- Equity at exit
- $711,694
- IRR
- 23.2%
- Equity multiple
- 7.07×
- Total profit
- $1,342,341
- Equity at exit
- $1,534,794
Cash invested: $221,200 (down + closing). Projections, not guarantees.
Landlord ↔ Tenant lean methodology
- Overall (CITY)
- 0 Strongly Tenant-Friendly
- State New York
- 15 Strongly Tenant-Friendly · D+10
- County
- — inherits STATE
- City New York
- 0 Strongly Tenant-Friendly · D+34
ZIP-level market 11692
- Home prices YoY
- 14.4%
- Active inventory
- 80
- Price-to-rent
- 17.9×
Monthly cashflow live
- Estimated rent
- $7,366 medium interval (Pro) →
- Mortgage (P&I)
- −$4,143
- Tax from tax record
- −$373 /mo · $4,471/yr
- Insurance
- −$329
- Flood insurance flood zone
- −$427 /mo · $5,118/yr
- HOA
- −$0
- Vacancy / Maint / Mgmt
- −$1,547
- Net cashflow
- $548
Break-even live
Sensitivity live
| Price | -10% $995 | -5% $772 | +0% $548 | +5% $324 | +10% $101 |
|---|---|---|---|---|---|
| Rent | -10% $-34 | -5% $257 | +0% $548 | +5% $839 | +10% $1,130 |
| Rate | -1.0pp $946 | -0.5pp $749 | base $548 | +0.5pp $343 | +1.0pp $135 |
2-unit breakdown (identical units grouped — click to expand)
| Units | Beds | Baths | Est. rent |
|---|---|---|---|
| 2× units | 3 | — | $7,366 |
| #1 | 3 | — | $3,683 |
| #2 | 3 | — | $3,683 |
| Total (2 units) | $7,366 | ||
UW: 25.0% down · 7.5% · 30yr · 1.5% tax · 5.0% vac · 8.0% maint · 8.0% mgmt
Financing live
Cash to close
- Down payment
- $197,500
- Closing costs
- $23,700
- Reserves months
- —
- Total cash needed
- —
Loan-product check · same deal, 3 products live
Conventional
25% down · 7.5% · 30yr
- Down + closing
- —
- Monthly P&I
- —
- Monthly cashflow
- —
- DSCR
- —
- Eligible?
- —
Personal DTI + credit; lowest rate.
DSCR
20% down · 8.5% · 30yr
- Down + closing
- —
- Monthly P&I
- —
- Monthly cashflow
- —
- DSCR
- —
- Eligible?
- —
No personal income docs; deal must DSCR.
Hard money
10% down · 12.0% · 12mo
- Down + closing
- —
- Monthly P&I
- —
- Monthly cashflow
- —
- DSCR
- —
- Eligible?
- —
Short-term bridge; refi at stabilization.
Listing history 14 events
-
2026-06-18days on market $789,999 Active 604 DOM
-
2026-06-17days on market $789,999 Active 603 DOM
-
2026-06-15days on market $789,999 Active 601 DOM
-
2026-06-13days on market $789,999 Active 599 DOM
-
2026-06-10days on market $789,999 Active 595 DOM
-
2026-06-08days on market $789,999 Active 594 DOM
-
2026-06-03days on market $789,999 Active 589 DOM
-
2026-06-01days on market $789,999 Active 587 DOM
-
2026-05-31days on market $789,999 Active 586 DOM
-
2024-10-22$789,999 Active
-
2003-07-31soldstatus $245,000
-
1994-07-20soldstatus $138,000
-
1994-02-08soldstatus $75,259
-
1994-02-08soldstatus $75,259
ⓘ Source: listings_history table (triggers on properties + properties_extension) + one-shot
backfill from property_details.listing_events for pre-trigger history.
Tax reassessment forecast NY · Partial reset (capped growth)
- Current annual tax
- $4,471 · $373/mo
- Projected year-2 tax
- $8,911 · $743/mo
- Expected delta
- +$4,440/yr (+$370/mo · 99.3%)
ⓘ Screening estimate from a state-policy table — verify with the county assessor before closing.
Climate risk First Street
- Flood 9/10 Extreme FEMA zone AE · 99% chance over 30 yrs
- Wildfire 1/10 Low
- Heat 7/10 Severe 7 d/yr ≥96°F today · 16 d/yr by 30 yrs out
- Wind 6/10 Major 77% chance of damaging wind over 30 yrs
- Air quality 3/10 Moderate 4 unhealthy d/yr today · 4 by 30 yrs out
Nearby sold comps map
Loading sold comps map…
Walkable amenities ~0.75 mi
Loading nearby amenities…
Taxation est. · year 1
- Rental income
- $88,392
- − Mortgage interest
- −$44,252
- − Property taxes
- −$4,471
- − Insurance
- −$9,068
- − Repairs & maintenance
- −$7,071
- − Management
- −$7,071
- − Depreciation
- −$22,982
- Taxable loss
- −$6,524
- Est. tax savings @ 24.0%
- +$1,566
- After-tax cash flow
- $8,142/yr
For passive investors: Depreciation is non-cash, so a rental often shows a tax loss while cash-flowing — sheltering income. Rental losses are passive: they offset passive income freely, and up to $25,000/yr can offset ordinary (W-2) income if you actively participate and your MAGI is under $100k (phasing out to $0 by $150k); unused losses carry forward. On sale, claimed depreciation is recaptured at up to 25%, and gains may owe capital-gains tax (a 1031 exchange can defer both). Figures are a year-1 estimate at your 24.0% rate — not tax advice; consult a CPA.
Schools (NCES district)
No district data.
Livability — New York
- Score
- 75/100
- State rank
- #268
- US rank
- #4188
Category grades
Schools grade is shown separately in the Schools card above.
Census & demographics
- Census place
- New York, NY
- County
- Queens County · 1,914,869 people
- City population
- 7,731,280
- Metro
- New York-Newark-Jersey City, NY-NJ-PA
- Population (ZIP)
- 22,734
- Household income
- $49,720
- Rent vs Own
- Severe rent burden
- 1734.0
Population outlook (Queens County) Hauer SSP2
- Today (2025)
- 2,546,320 people
- By 2030
- 2,643,059 · +3.8%
- By 2040
- 2,815,563 · +10.6%
- By 2050
- 2,944,423 · +15.6%
- By 2075
- 3,123,338 · +22.7%
- By 2100
- 3,098,688 · +21.7%
Race, ethnicity, and origin ACS 2023
- Neighborhood character
- Diverse neighborhood (Simpson 0.64)
- Race & ethnicity
- Black 53% Hispanic / Latino 24% Two or more races 15% White 13% Asian 6%
- Hispanic origin (detail)
- Puerto Rican 10% Dominican 5%
- Common ancestry
- Romanian 1%
- Foreign-born
- 31% · Canada, China, Jamaica
- Languages at home
- 67% English-only · Spanish 18% Other Indo-European 3% Russian/Polish/Slavic 3%
Political lean MEDSL · Queens
- 2024 margin
- Strong D (+24.6) · D 62.3% · R 37.7%
- 2008→2024 swing
- -26.2pp toward R · 2008: 50.8pp · 2024: 24.6pp
- All cycles
- 2024: D+24.6 2020: D+45.2 2016: D+53.4 2012: D+58.5 2008: D+50.8
Not yet ingested
- Civics
- —
Market trends
- HPI YoY
- ▲ 44.49%
- Current HPI
- 354.2007
- Rent YoY
- —
- Metro
- New York-Newark-Jersey City, NY-NJ-PA
- State GDP YoY
- ▲ 2.60%
- F500 in state
- 92
Industry mix (Fortune 500 HQ in NY)
| Industry | F500 HQs | Revenue |
|---|---|---|
| Financial Services | 10 | $950B |
|
||
| Consumer Goods | 9 | $162B |
|
||
| Insurance | 4 | $225B |
|
||
| Telecommunications | 2 | $144B |
|
||
| Pharmaceuticals | 2 | $112B |
|
||
| Media / Entertainment | 2 | $69B |
|
||
Price history
+949.7% since first listed5 events — show timeline
- 2024-10-22 Listed $789,999 OneKey® MLS as Distributed by MLS Grid
- 2003-07-31 Sold (Public Records) $245,000 Public Records
- 1994-07-20 Sold (Public Records) $138,000 Public Records
- 1994-02-08 Sold (Public Records) $75,259 Public Records
- 1994-02-08 Sold (Public Records) $75,259 Public Records
Property tax history
+4.0%/yrLatest (2025): $4,471 · -2.4% YoY. Source: county tax records.
Cash-flow waterfall
monthlySold comps — $/sqft
last 12 mo · ≤1 miLoading sold comps…