 Duplex
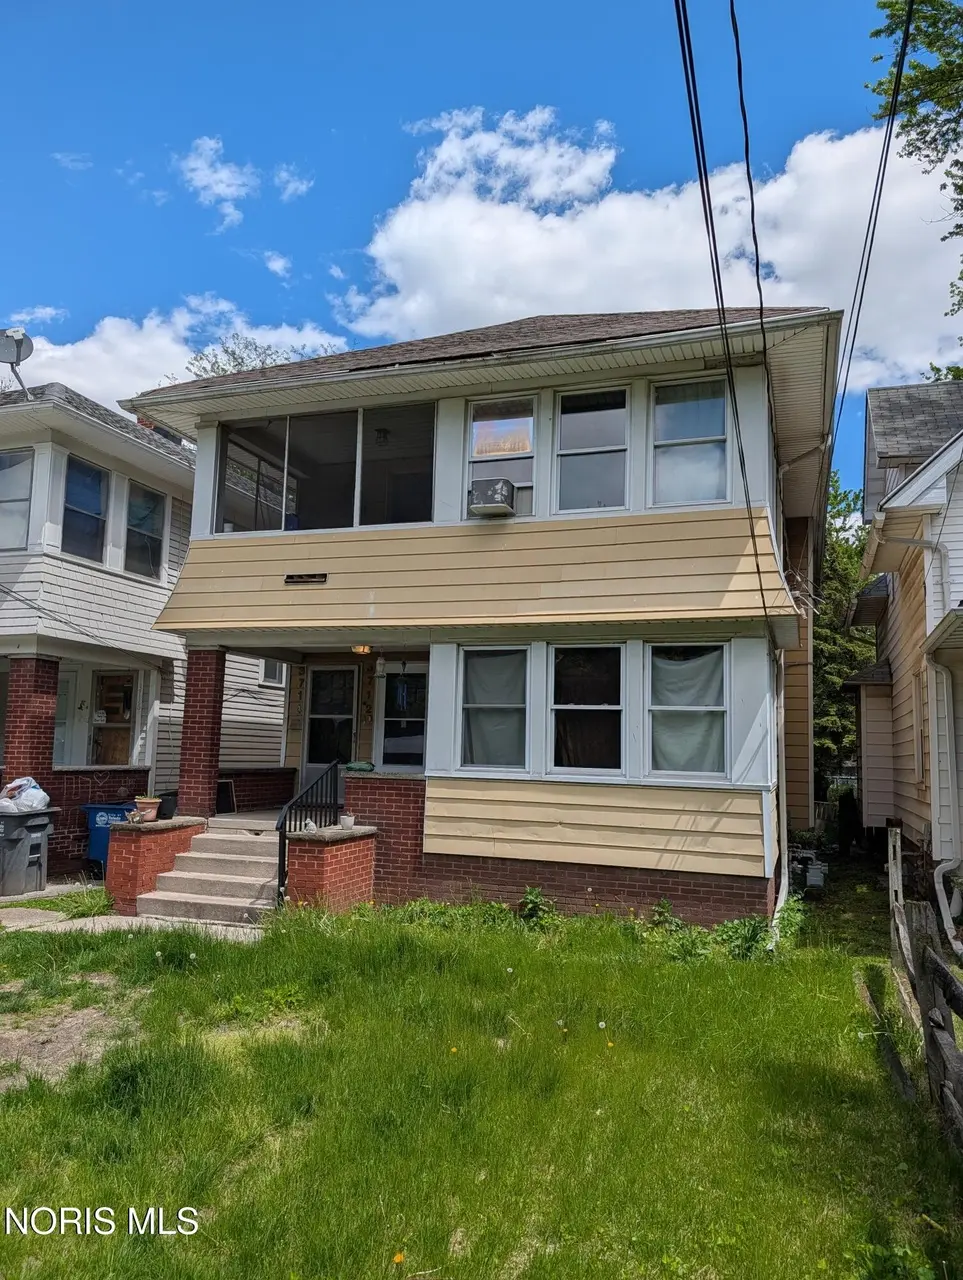
3712 Willys Pkwy · Toledo, OH
Flood risk 1/10 · Minimal
- FEMA flood zone
- X (unshaded)
- Chance of flooding over 30 yrs
- 0.0%
- Est. flood insurance / yr
- $473 – $860
Fire risk 1/10 · Minimal
- Est. fire insurance / yr
- $713 – $1,323
Heat risk 3/10 · Minor
- Hot days now (above 101°F)
- 7 days/yr
- Hot days in 30 yrs
- 16 days/yr
Wind risk 2/10 · Minimal
- Chance of severe wind over 30 yrs
- —
Air-quality risk 2/10 · Minimal
- Unhealthy air days now
- 1 days/yr
- Unhealthy air days in 30 yrs
- 3 days/yr
Risk factors via First Street. Map © Google.
Why this score? — see what drove the B grade
The composite is a weighted blend of 9 inputs, each scored 0–100. Each bar is that input's sub-score; the figure is the points it added to the 100-point composite (weight × sub-score).
- Cash flow +30.0/30.0
- ARV discount +12.2/15.0
- 1% rule +10.0/10.0
- DSCR +10.0/10.0
- Rent growth +4.0/5.0
- Livability +3.3/5.0
- Condition / age +2.5/5.0
- Schools +1.6/10.0
- Appreciation +0.0/10.0
$130,000
🖨 Deal sheet 📄 Offer letter ✓ Due diligence
Multi-family units
County records classify this as Multi-Family (2-4 Unit). Listing-text estimate: 2 units. confirmed
Listing remarks
Solid income-producing duplex in Toledo: Both units feature 2 bedrooms / 1 bath. Lower unit rented at $900/mo through October 2027; upper unit at $775/mo through July 2026 with a Lead Safe Certificate through 11/11/30. Updates include refreshed paint throughout, updated bathrooms in both units, new LVP flooring in lower unit, and a mix of new LVP plus beautiful original hardwood in upper unit. Separate utilities, strong rental track record, and recent improvements position this as a dependable multi-family asset with excellent long-term potential. Don't miss this cash-flowing property! Sold with 3716 Willys Pkwy next door.
Key facts
- Original hardwood
- Updated bathrooms
- New lvp flooring
Tags
Property features AI
Finance
- Financial info: Two-unit building (both units leased); Tenant pays all utilities; Owner pays common area maintenance, insurance, snow removal, taxes, and lawn care
Exterior
- Parking: On-street parking
- Utilities: Electricity connected (100 amp service, circuit breakers); Natural gas connected; Public water; Public sewer
- Home design: Residential income property; Duplex; Two-story
- Construction: Metal siding; Block foundation; Block basement (full)
- Exterior features: Shingle roof; Level lot
Interior
- Kitchen: Electric cooktop; Electric oven; Gas range; Refrigerator
- Flooring: Luxury vinyl; Wood
- Heating & cooling: Forced air heating; Ceiling fans for cooling
- Interior features: Other
Neighborhood map
What this means for you Summary
Snapshot
- This is a 2 × 2-bed/1.0-bath units multifamily listed at $130k.
Deal economics
- At list price, monthly cash flow is $862 ($10k/yr) — positive. Per door: $431/mo.
- The deal already cash-flows at list — no discount required.
- Meets the 1% rule at list price ($2k rent vs $130k).
- Recommended offer: $126k (3.0% below list) — sets the bar for market timing.
- Cap rate 14.2% vs local median 7.6% in Toledo — top-decile yield for the area; either an underpriced asset or a hidden risk that comps aren't pricing in. Stress-test before assuming the spread holds.
Location & tenants
- Location reads 66/100 on livability (#645 in OH) — a middle-class / working-renter tenant base. Strengths: cost of living A+, housing A+, health & safety A+; Watch: amenities C-, crime F, commute F.
- Toledo City (urban): math 15% / reading 24% proficiency, ranked #634 of 656 in OH (top 97%) — low school quality limits family demand, transient renter base, plan for 1-2y turnover; 72% free/reduced lunch — lower-income household profile, screen leases tightly.
- Zoned schools: Longfellow Elementary School (math 12% / reading 19%, grade F, #1,375 of 1,584 statewide, top 87%, 533 students, 0% FRL); Start High School (math 11% / reading 33%, grade F, #672 of 781 statewide, top 86%, 1,242 students, 50% FRL) — zoned schools average 25% FRL vs 72% district-wide (47 pts lower); this property's tenant base skews higher-income than the district average.
- Market conditions: Rents rising fast (+6.0%/yr); 92 active listings in the ZIP; 9 comparable units currently listed for rent nearby; rentals at typical pace (median 24d on market — plan ~3-4 weeks tenant-placement turnaround); 415 units permitted in Lucas County in 2024 (122 in 5+ unit buildings).
- At $2,234/mo this rent would consume 53% of the median local household income ($51k/yr) (locally 1203% of renters already pay >50% of income on rent) — very limited rent-growth headroom before tenants either downsize or default.
Forward outlook
- Local home prices are declining (-3.0%/yr); year-one equity from $899 of loan paydown is wiped out by about $4k of value loss. Plan a longer hold.
- Lucas County population projected at -16% by 2050 — secular population decline; favor cash flow + early exit over multi-decade hold.
- At projected returns (-3.0% appreciation + 6.0% rent growth), your $36k cash investment doubles in ~4 years — after that, you're playing with house money.
Negotiation context
- It's been on market 37 days — a 3% lower offer ($126k) is reasonable based on typical stale-listing flexibility.
- 5 sale attempts since 4y ago with the ask held roughly flat each time — persistent listings suggest the price (not the market) is what's stuck; bring a comps-based counter.
- Current owner paid $75k; list at $130k implies a 73% gain — meaningful room to come down on a strong offer.
Risks & watch-outs
- Watch-outs: built in 1925 — expect roof / HVAC / electrical / plumbing capex.
Questions for the listing agent
- It's been on market 37 days. Have you received any prior offers? Is the seller open to a 3% concession, seller financing, or rate buy-down credit?
- Can we see the unit-by-unit rent roll, current vacancy, and any below-market leases? What's the average tenancy length?
- What capital expenditures (roof, boiler, parking lot, exteriors) have been made in the last 5 years, and what's planned in the next 2?
- Built in 1925 — when were the roof, HVAC, electrical panel, plumbing, and water heater last replaced?
- Is there a deadline driving the sale (1031 exchange, divorce, estate, relocation)? That informs how much negotiation room exists.
- Schools are D-rated, which usually means shorter tenancies and higher turnover. Who's the typical renter profile here, and what's been the actual vacancy rate?
- Crime grade is F in this area — have there been break-ins, vandalism, or insurance claims at this property in the last 3 years? What carrier currently insures it and at what premium?
- What's the average days-on-market for RENTAL listings here right now (not sales)? A rising rental-DOM trend means longer vacancies and softer asking-rent achievability than the comps imply.
- What's the recent tenant-quality profile in this submarket — average credit score on applications, eviction rate, late-payment / NSF rate, and stable-employment percentage? A property-management company in the area should have these aggregated.
- How much new apartment / multifamily construction is in the pipeline within 1–3 miles? Heavy new supply (>2% of stock underway) typically softens rents 12–24 months out; light construction supports rent growth.
Investment metrics
- 1% rule
- 1.72% ✓
- Cap rate
- 14.25%
- Cash-on-cash
- 28.41%
- DSCR
- 2.26
- GRM
- 4.8
CMA / ARV
- ARV (median comp)
- $145,235
- List price
- $130,000
- Delta
- -10.49%
- Verdict
- UNDERPRICED
- Comps
- 20 within 1.0 mi
Show comp detail 9 sales within ~0.75 mi
| Address | Dist | Beds/Ba | Sqft | Sold | Price | $/sf | Match |
|---|---|---|---|---|---|---|---|
| 3542-3544 Homewood Ave | 0.14mi | 4/2.0 | 2,336 (+5%) | 1mo | $97,900 | $42 | 85 |
| 3848 Revere Dr Uppr & Lower | 0.31mi | 4/2.0 | 2,424 (+9%) | 2mo | $132,000 | $54 | 69 |
| 4114 Kingsbury Ave | 0.56mi | 4/2.0 | 2,270 (+2%) | 7mo | $94,250 | $42 | 65 |
| 1325 Laclede Rd | 0.40mi | 4/2.0 | 2,250 (+1%) | 21mo | $160,000 | $71 | 62 |
| 1113 Alcott St | 0.73mi | 4/2.0 | 2,200 (-1%) | 8mo | $140,000 | $64 | 57 |
| 3823 Baltimore St | 0.35mi | 3/2.0 (-1) | 2,000 (-10%) | 10mo | $103,000 | $52 | 54 |
| 3819 Revere Dr | 0.32mi | 4/2.0 | 2,530 (+14%) | 14mo | $107,500 | $42 | 51 |
| 4214 Kingsbury Ave | 0.64mi | 4/2.0 | 2,054 (-8%) | 18mo | $132,000 | $64 | 42 |
| 4218 Kingsbury Ave | 0.64mi | 4/2.0 | 2,074 (-7%) | 21mo | $144,000 | $69 | 41 |
Match score weights: distance 35% · size 25% · config 20% · recency 20%. Top-matched comps best support the ARV.
Projected returns pro-forma
-3.0% appreciation · 6.01% rent growth · sell at horizon
- IRR
- 26.1%
- Equity multiple
- 2.12×
- Total profit
- $40,831
- Equity at exit
- $19,383
- IRR
- 35.5%
- Equity multiple
- 4.76×
- Total profit
- $136,807
- Equity at exit
- $11,240
Cash invested: $36,400 (down + closing). Projections, not guarantees.
Landlord ↔ Tenant lean methodology
- Overall (STATE)
- 73 Landlord-Friendly
- State Ohio
- 73 Landlord-Friendly · R+6
- County
- — inherits STATE
- City
- — inherits STATE
ZIP-level market 43612
- Home prices YoY
- -17.5%
- Rents YoY
- 6.0%
- Active inventory
- 92
- Price-to-rent
- 9.7×
Monthly cashflow live
- Estimated rent
- $2,234 high interval (Pro) →
- Mortgage (P&I)
- −$682
- Tax from tax record
- −$167 /mo · $2,006/yr
- Insurance
- −$54
- HOA
- −$0
- Vacancy / Maint / Mgmt
- −$469
- Net cashflow
- $862
Break-even live
2-unit breakdown (identical units grouped — click to expand)
| Units | Beds | Baths | Est. rent |
|---|---|---|---|
| 2× units | 2 | 1 | $2,234 |
| #1 | 2 | 1 | $1,117 |
| #2 | 2 | 1 | $1,117 |
| Total (2 units) | $2,234 | ||
UW: 25.0% down · 7.5% · 30yr · 1.5% tax · 5.0% vac · 8.0% maint · 8.0% mgmt
Financing live
Cash to close
- Down payment
- $32,500
- Closing costs
- $3,900
- Reserves months
- —
- Total cash needed
- —
Loan-product check · same deal, 3 products live
Conventional
25% down · 7.5% · 30yr
- Down + closing
- —
- Monthly P&I
- —
- Monthly cashflow
- —
- DSCR
- —
- Eligible?
- —
Personal DTI + credit; lowest rate.
DSCR
20% down · 8.5% · 30yr
- Down + closing
- —
- Monthly P&I
- —
- Monthly cashflow
- —
- DSCR
- —
- Eligible?
- —
No personal income docs; deal must DSCR.
Hard money
10% down · 12.0% · 12mo
- Down + closing
- —
- Monthly P&I
- —
- Monthly cashflow
- —
- DSCR
- —
- Eligible?
- —
Short-term bridge; refi at stabilization.
Rent comps 9 comps
| Address | Beds | Baths | Sqft | Rent | $/sqft | DOM | Units | Dist |
|---|---|---|---|---|---|---|---|---|
| 1477 W Sylvania Ave Toledo, OH | 3.0 | 1.0 | 1570 | $1,250 | $0.80 | 44d | 1 | 0.48mi |
| 4120 Parrakeet Ave Toledo, OH | 3.0 | 2.0 | 1410 | $1,450 | $1.03 | 44d | 1 | 0.56mi |
| 3905 Peru St Toledo, OH | 4.0 | 3.0 | 1548 | $1,300 | $0.84 | 21d | 1 | 0.75mi |
| 4459 N Haven Ave Toledo, OH | 3.0 | 1.0 | 1416 | $1,200 | $0.85 | 14d | 1 | 0.81mi |
| 614 Cadillac Ct Toledo, OH | 3.0 | 1.0 | 1581 | $1,075 | $0.68 | 23d | 1 | 0.82mi |
| 610 Cadillac Ct Toledo, OH | 3.0 | 1.0 | 1409 | $1,050 | $0.75 | 23d | 1 | 0.82mi |
| 2907 Rockwood Pl Toledo, OH | 3.0 | 1.0 | 1494 | $1,100 | $0.74 | 14d | 1 | 1.01mi |
| 4614 Commonwealth Ave Toledo, OH | 3.0 | 1.5 | 1459 | $1,295 | $0.89 | 14d | 1 | 1.08mi |
| 1436 Palmetto Ave Toledo, OH | 3.0 | 1.0 | 1678 | $1,400 | $0.83 | 23d | 1 | 1.13mi |
Listing history 29 events
-
2026-06-18days on market $130,000 Active 37 DOM
-
2026-06-17days on market $130,000 Active 36 DOM
-
2026-06-16days on market $130,000 Active 35 DOM
-
2026-06-15days on market $130,000 Active 34 DOM
-
2026-06-14days on market $130,000 Active 32 DOM
-
2026-06-10days on market $130,000 Active 29 DOM
-
2026-06-09days on market $130,000 Active 28 DOM
-
2026-06-08days on market $130,000 Active 27 DOM
-
2026-06-07pricedays on market $130,000 Active 26 DOM
-
2026-06-05days on market $135,000 Active 23 DOM
-
2026-06-03days on market $135,000 Active 22 DOM
-
2026-06-02days on market $135,000 Active 21 DOM
-
2026-06-01days on market $135,000 Active 20 DOM
-
2026-05-31days on market $135,000 Active 19 DOM
-
2026-05-30days on market $135,000 Active 18 DOM
-
2026-05-12$135,000 Active 630-char remark
-
2026-04-06historical
-
2026-02-17$135,000 Active
-
2022-06-20historical
-
2022-06-06status Active
-
2022-05-28historical Contingent
-
2022-05-21status Active
-
2022-05-12historical Contingent
-
2022-05-09$109,900 Active
-
2021-07-02soldstatus $75,000
-
2000-01-04soldstatus $68,200
-
1996-01-17soldstatus $60,000
-
1988-08-29soldstatus $53,000
-
1962-08-31soldstatus $16,500
ⓘ Source: listings_history table (triggers on properties + properties_extension) + one-shot
backfill from property_details.listing_events for pre-trigger history.
Tax reassessment forecast OH · Partial reset (capped growth)
- Current annual tax
- $2,006 · $167/mo
- Projected year-2 tax
- $2,017 · $168/mo
- Expected delta
- +$11/yr (+$1/mo · 0.6%)
ⓘ Screening estimate from a state-policy table — verify with the county assessor before closing.
Climate risk First Street
- Flood 1/10 Low FEMA zone X (unshaded) · 0% chance over 30 yrs
- Wildfire 1/10 Low
- Heat 3/10 Moderate 7 d/yr ≥101°F today · 16 d/yr by 30 yrs out
- Wind 2/10 Low
- Air quality 2/10 Low 1 unhealthy d/yr today · 3 by 30 yrs out
Nearby sold comps map
Loading sold comps map…
Walkable amenities ~0.75 mi
Loading nearby amenities…
Taxation est. · year 1
- Rental income
- $26,808
- − Mortgage interest
- −$7,282
- − Property taxes
- −$2,006
- − Insurance
- −$650
- − Repairs & maintenance
- −$2,145
- − Management
- −$2,145
- − Depreciation
- −$3,782
- Taxable income
- $8,799
- Est. tax owed @ 24.0%
- −$2,112
- After-tax cash flow
- $8,230/yr
For passive investors: Depreciation is non-cash, so a rental often shows a tax loss while cash-flowing — sheltering income. Rental losses are passive: they offset passive income freely, and up to $25,000/yr can offset ordinary (W-2) income if you actively participate and your MAGI is under $100k (phasing out to $0 by $150k); unused losses carry forward. On sale, claimed depreciation is recaptured at up to 25%, and gains may owe capital-gains tax (a 1031 exchange can defer both). Figures are a year-1 estimate at your 24.0% rate — not tax advice; consult a CPA.
Schools (NCES district)
- District
- Toledo City
- NCES district ID
- 3904490
- Math proficiency
- 15% ▼ -16.00%
- Reading proficiency
- 24% ▼ -13.00%
- Median HH income
- $32,137
- Composite
- 15.76/100
- National rank
- #9276
- State rank
- #634 of 656 in OH
Livability — Toledo
- Score
- 66/100
- State rank
- #645
- US rank
- #11442
Category grades
Schools grade is shown separately in the Schools card above.
Census & demographics
- Census place
- Toledo, OH
- County
- Lucas County · 380,724 people
- City population
- 280,811
- Metro
- Toledo, OH
- Population (ZIP)
- 28,480
- Household income
- $50,728
- Rent vs Own
- Severe rent burden
- 1203.0
Population outlook (Lucas County) Hauer SSP2
- Today (2025)
- 420,751 people
- By 2030
- 410,187 · -2.5%
- By 2040
- 384,019 · -8.7%
- By 2050
- 355,125 · -15.6%
- By 2075
- 291,683 · -30.7%
- By 2100
- 233,670 · -44.5%
Race, ethnicity, and origin ACS 2023
- Neighborhood character
- Majority White (63%)
- Race & ethnicity
- White 63% Black 23% Two or more races 10% Hispanic / Latino 9%
- Hispanic origin (detail)
- Mexican 6% Puerto Rican 2%
- Common ancestry
- Romanian 9% Lithuanian 3% Italian 1%
- Foreign-born
- 2% · Canada
- Languages at home
- 96% English-only · Spanish 2% French/Haitian/Cajun 1%
Political lean MEDSL · Lucas
- 2024 margin
- D (+12.6) · D 55.8% · R 43.2%
- 2008→2024 swing
- -18.9pp toward R · 2008: 31.4pp · 2024: 12.6pp
- All cycles
- 2024: D+12.6 2020: D+16.8 2016: D+17.4 2012: D+30.4 2008: D+31.4
Not yet ingested
- Civics
- —
Market trends
- HPI YoY
- ▼ -50.05%
- Current HPI
- 235.5389
- Rent YoY
- ▲ 6.01%
- Metro
- Toledo, OH
- State GDP YoY
- ▲ 1.98%
- F500 in state
- 48
Industry mix (Fortune 500 HQ in OH)
| Industry | F500 HQs | Revenue |
|---|---|---|
| Insurance | 3 | $145B |
|
||
| Industrial Machinery | 3 | $49B |
|
||
| Financial Services | 3 | $24B |
|
||
| Consumer Goods | 2 | $93B |
|
||
| Aerospace / Defense | 2 | $47B |
|
||
| Utilities | 2 | $33B |
|
||
Price history
+687.9% since first listed15 events — show timeline
- 2026-06-06 Price Changed $130,000 NORIS
- 2026-05-12 Listed $135,000 NORIS
- 2026-04-06 Listing Removed — NORIS
- 2026-02-17 Listed $135,000 NORIS
- 2022-06-20 Listing Removed — NORIS
- 2022-06-06 Relisted — NORIS
- 2022-05-28 Contingent — NORIS
- 2022-05-21 Relisted — NORIS
- 2022-05-12 Contingent — NORIS
- 2022-05-09 Listed $109,900 NORIS
- 2021-07-02 Sold (Public Records) $75,000 Public Records
- 2000-01-04 Sold (Public Records) $68,200 Public Records
- 1996-01-17 Sold (Public Records) $60,000 Public Records
- 1988-08-29 Sold (Public Records) $53,000 Public Records
- 1962-08-31 Sold (Public Records) $16,500 Public Records
Property tax history
+0.2%/yrLatest (2025): $2,006 · -3.8% YoY. Source: county tax records.
Cash-flow waterfall
monthlySold comps — $/sqft
last 12 mo · ≤1 miLoading sold comps…