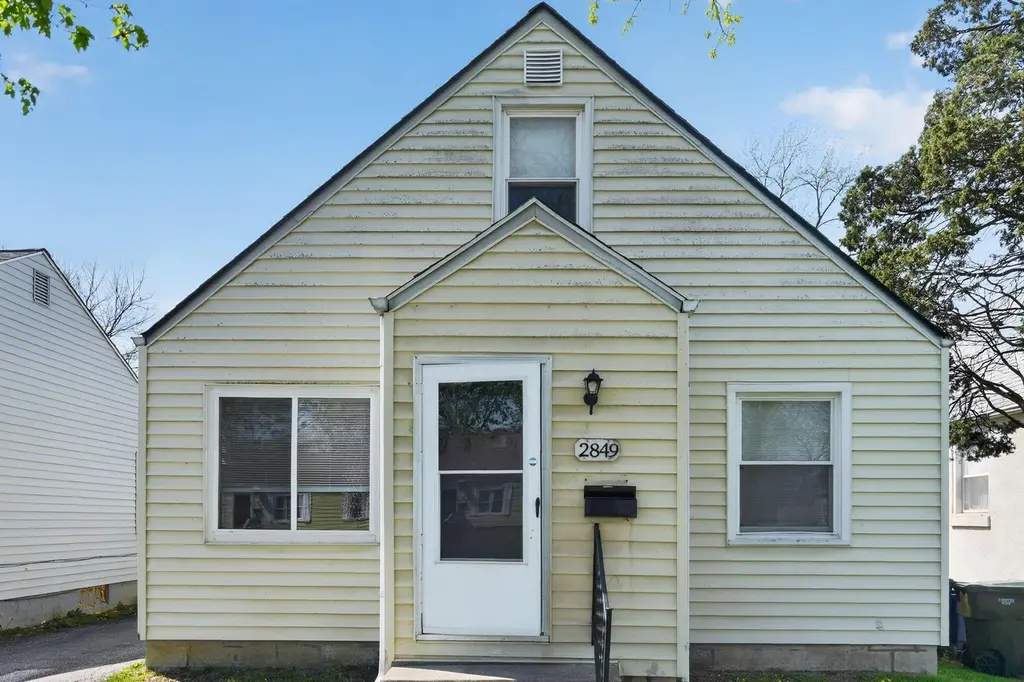
2849 Osceola Ave · Columbus, OH
Flood risk 1/10 · Minimal
- FEMA flood zone
- X (unshaded)
- Chance of flooding over 30 yrs
- 0.0%
- Est. flood insurance / yr
- $473 – $860
Fire risk 1/10 · Minimal
- Est. fire insurance / yr
- $713 – $1,323
Heat risk 3/10 · Minor
- Hot days now (above 100°F)
- 7 days/yr
- Hot days in 30 yrs
- 17 days/yr
Wind risk 2/10 · Minimal
- Chance of severe wind over 30 yrs
- 1.0%
Air-quality risk 3/10 · Minor
- Unhealthy air days now
- 2 days/yr
- Unhealthy air days in 30 yrs
- 4 days/yr
Risk factors via First Street. Map © Google.
Why this score? — see what drove the C- grade
The composite is a weighted blend of 9 inputs, each scored 0–100. Each bar is that input's sub-score; the figure is the points it added to the 100-point composite (weight × sub-score).
- Cash flow +16.8/30.0
- ARV discount +13.5/15.0
- DSCR +5.2/10.0
- 1% rule +4.2/10.0
- Livability +4.0/5.0
- Rent growth +3.4/5.0
- Condition / age +2.5/5.0
- Schools +1.7/10.0
- Appreciation +0.0/10.0
$149,900
🖨 Deal sheet (PDF) 📄 Offer letter ✓ Due diligence
Listing remarks MLS
This Cape Cod residence is located in the Almada subdivision within the North Linden area of Columbus. The home features 979 square feet of living space including 3 bedrooms and 1 full bathroom. The exterior is finished with vinyl siding and features a 1-car detached garage. A full, unfinished basement provides ample storage or utility space. This property is served by the Columbus CSD and is situated within the City of Columbus corporation limits with access to all public utilities.
Key facts
- 4,356 sq ft lot
- Garage
- Built 1951
Neighborhood map
What this means for you Summary
Snapshot
- This is a 3-bed/1.0-bath single-family listed at $150k.
Deal economics
- At list price, monthly cash flow is $95 ($1k/yr) — positive.
- The deal already cash-flows at list — no discount required.
- To meet the 1% rule (rent ≥ 1% of price), the offer needs to be $138k (8.1% below list).
- Recommended offer: $138k (8.1% below list) — sets the bar for 1% rule.
- Cap rate 7.1% vs local median 3.8% in Columbus — top-decile yield for the area; either an underpriced asset or a hidden risk that comps aren't pricing in. Stress-test before assuming the spread holds.
Location & tenants
- Location reads 81/100 on livability (#97 in OH, #1,491 nationally) — a professional / high-income tenant draw. Strengths: commute A+, cost of living A+, housing A+; Watch: employment C-, crime F.
- Columbus City School District (urban): math 15% / reading 26% proficiency, ranked #626 of 656 in OH (top 95%) — low school quality limits family demand, transient renter base, plan for 1-2y turnover; 72% free/reduced lunch — lower-income household profile, screen leases tightly.
- Market conditions: Rents rising (+3.4%/yr); 166 active listings in the ZIP; 40 comparable units currently listed for rent nearby; rentals at typical pace (median 25d on market — plan ~3-4 weeks tenant-placement turnaround); 45% of comp listings sitting > 30 days — soft ceiling on asking rent; lower-income renter base — watch delinquency; 8,139 units permitted in Franklin County in 2024 (5,940 in 5+ unit buildings).
- This rent runs 39% of the median local income ($43k/yr) — at the standard rent-burdened threshold; future hikes will face affordability resistance.
Forward outlook
- Local home prices are declining (-3.0%/yr); year-one equity from $1k of loan paydown is wiped out by about $4k of value loss. Plan a longer hold.
- Franklin County population projected at +34% by 2050 — long-run rental-demand tailwind backs the buy-and-hold thesis.
Negotiation context
- It's been on market 25 days — a 2% lower offer ($148k) is reasonable based on typical stale-listing flexibility.
- 9 sale attempts since 31y ago with the ask held roughly flat each time — persistent listings suggest the price (not the market) is what's stuck; bring a comps-based counter.
- Current owner paid $54k; list at $150k implies a 178% gain — meaningful room to come down on a strong offer.
Risks & watch-outs
- Watch-outs: built in 1951 — expect roof / HVAC / electrical / plumbing capex.
Questions for the listing agent
- Built in 1951 — when were the roof, HVAC, electrical panel, plumbing, and water heater last replaced?
- Is there a deadline driving the sale (1031 exchange, divorce, estate, relocation)? That informs how much negotiation room exists.
- Crime grade is F in this area — have there been break-ins, vandalism, or insurance claims at this property in the last 3 years? What carrier currently insures it and at what premium?
- What's the average days-on-market for RENTAL listings here right now (not sales)? A rising rental-DOM trend means longer vacancies and softer asking-rent achievability than the comps imply.
- What's the recent tenant-quality profile in this submarket — average credit score on applications, eviction rate, late-payment / NSF rate, and stable-employment percentage? A property-management company in the area should have these aggregated.
- How much new for-sale + rental construction is in the pipeline within 1–3 miles? Heavy new supply typically softens prices + rents 12–24 months out; constrained supply supports both.
Investment metrics
- 1% rule
- 0.92% ✗
- Cap rate
- 7.06%
- Cash-on-cash
- 2.73%
- DSCR
- 1.12
- GRM
- 9.1
CMA / ARV
- ARV (median comp)
- $172,893
- List price
- $149,900
- Delta
- -13.30%
- Verdict
- UNDERPRICED
- Comps
- 20 within 1.0 mi
Show comp detail 12 sales within ~0.75 mi
| Address | Dist | Beds/Ba | Sqft | Sold | Price | $/sf | Match |
|---|---|---|---|---|---|---|---|
| 2728 Atwood Ter | 0.29mi | 3/1.0 | 979 (0%) | 1mo | $170,000 | $174 | 86 |
| 2610 Atwood Ter | 0.39mi | 3/1.0 | 979 (0%) | 1mo | $176,500 | $180 | 81 |
| 788 Tibet Rd | 0.09mi | 3/1.0 | 1,083 (+11%) | 1mo | $220,000 | $203 | 78 |
| 2780 Audubon Rd | 0.12mi | 2/1.5 (-1) | 1,070 (+9%) | 1mo | $189,400 | $177 | 71 |
| 3120 Howey Rd | 0.56mi | 3/1.0 | 1,008 (+3%) | 1mo | $85,000 | $84 | 68 |
| 826 E Brighton Rd | 0.43mi | 3/1.0 | 1,087 (+11%) | 0mo | $215,900 | $199 | 61 |
| 2888 Howey Rd | 0.34mi | 3/1.0 | 842 (-14%) | 1mo | $180,500 | $214 | 60 |
| 3264 Eisenhower Rd | 0.60mi | 3/1.0 | 1,069 (+9%) | 0mo | $235,000 | $220 | 56 |
| 2498 Renwood Pl | 0.70mi | 3/1.0 | 1,043 (+6%) | 1mo | $210,000 | $201 | 56 |
| 2559 Hamilton Ave | 0.67mi | 3/1.5 | 919 (-6%) | 1mo | $140,000 | $152 | 56 |
| 1227 E North Broadway St | 0.68mi | 3/1.0 | 1,096 (+12%) | 1mo | $240,000 | $219 | 47 |
| 2378 Velma Ave | 0.68mi | 2/1.0 (-1) | 1,100 (+12%) | 1mo | $165,000 | $150 | 42 |
Match score weights: distance 35% · size 25% · config 20% · recency 20%. Top-matched comps best support the ARV.
Projected returns pro-forma
-3.0% appreciation · 3.41% rent growth · sell at horizon
- IRR
- -11.6%
- Equity multiple
- 0.58×
- Total profit
- $-17,653
- Equity at exit
- $22,351
- IRR
- -1.8%
- Equity multiple
- 0.88×
- Total profit
- $-5,216
- Equity at exit
- $12,961
Cash invested: $41,972 (down + closing). Projections, not guarantees.
Landlord ↔ Tenant lean methodology
- Overall (STATE)
- 73 Landlord-Friendly
- State Ohio
- 73 Landlord-Friendly · R+6
- County
- — inherits STATE
- City
- — inherits STATE
ZIP-level market 43211
- Home prices YoY
- -27.3%
- Rents YoY
- 3.4%
- Active inventory
- 166
- Price-to-rent
- 9.1×
Monthly cashflow live
- Estimated rent
- $1,377 high interval (Pro) →
- Mortgage (P&I)
- −$786
- Tax from tax record
- −$144 /mo · $1,728/yr
- Insurance
- −$62
- HOA
- −$0
- Vacancy / Maint / Mgmt
- −$289
- Net cashflow
- $95
Break-even live
Sensitivity live
| Price | -10% $180 | -5% $138 | +0% $95 | +5% $53 | +10% $10 |
|---|---|---|---|---|---|
| Rent | -10% $-13 | -5% $41 | +0% $95 | +5% $150 | +10% $204 |
| Rate | -1.0pp $171 | -0.5pp $133 | base $95 | +0.5pp $57 | +1.0pp $17 |
UW: 25.0% down · 7.5% · 30yr · 1.5% tax · 5.0% vac · 8.0% maint · 8.0% mgmt
Financing live
Cash to close
- Down payment
- $37,475
- Closing costs
- $4,497
- Reserves months
- —
- Total cash needed
- —
Loan-product check · same deal, 3 products live
Conventional
25% down · 7.5% · 30yr
- Down + closing
- —
- Monthly P&I
- —
- Monthly cashflow
- —
- DSCR
- —
- Eligible?
- —
Personal DTI + credit; lowest rate.
DSCR
20% down · 8.5% · 30yr
- Down + closing
- —
- Monthly P&I
- —
- Monthly cashflow
- —
- DSCR
- —
- Eligible?
- —
No personal income docs; deal must DSCR.
Hard money
10% down · 12.0% · 12mo
- Down + closing
- —
- Monthly P&I
- —
- Monthly cashflow
- —
- DSCR
- —
- Eligible?
- —
Short-term bridge; refi at stabilization.
Rent comps 40 comps
| Address | Beds | Baths | Sqft | Rent | $/sqft | DOM | Units | Dist |
|---|---|---|---|---|---|---|---|---|
| 870 Melrose Ave Columbus, OH | 2.0 | 1.0 | 732 | $1,345 | $1.84 | 8d | 1 | 0.14mi |
| 2980 Reis Ave Columbus, OH | 2.0 | 1.0 | 840 | $1,099 | $1.31 | 44d | 1 | 0.19mi |
| 2767 Hiawatha St Columbus, OH | 3.0 | 1.0 | 896 | $1,475 | $1.65 | 8d | 1 | 0.21mi |
| 2942 Atwood Ter Columbus, OH | 2.0 | 1.0 | 962 | $1,200 | $1.25 | 44d | 1 | 0.34mi |
| 2566 Atwood Ter Columbus, OH | 3.0 | 1.0 | 979 | $1,500 | $1.53 | 24d | 1 | 0.45mi |
| 780 E Brighton Rd Columbus, OH | 3.0 | 1.0 | 1086 | $1,500 | $1.38 | 8d | 1 | 0.46mi |
| 3199 Maize Rd Columbus, OH | 2.0 | 1.0 | 800 | $1,150 | $1.44 | 24d | 1 | 0.51mi |
| 2530 Beulah Rd Columbus, OH | 2.0 | 1.0 | 720 | $1,345 | $1.87 | 15d | 1 | 0.52mi |
| 2472 Pontiac St Columbus, OH | 2.0 | 1.0 | 754 | $995 | $1.32 | 4d | 1 | 0.53mi |
| 2472 Pontiac St Columbus, OH | 2.0 | 1.0 | 754 | $995 | $1.32 | 15d | 1 | 0.53mi |
| 2459 Hiawatha St Columbus, OH | 2.0 | 1.0 | 810 | $1,025 | $1.27 | 44d | 1 | 0.56mi |
| 2459 Atwood Ter Columbus, OH | 2.0 | 2.0 | 936 | $1,650 | $1.76 | 44d | 1 | 0.57mi |
| 1011 Mohican Ave Columbus, OH | 3.0 | 1.0 | 1091 | $1,399 | $1.28 | 44d | 1 | 0.60mi |
| 3086-3092 Grasmere Ave Unit 3088 Columbus, OH | 2.0 | 1.0 | 800 | $1,000 | $1.25 | 24d | 1 | 0.60mi |
| 3088 Grasmere Ave Columbus, OH | 2.0 | 1.0 | 800 | $1,000 | $1.25 | 24d | 1 | 0.60mi |
| 2872 Indianola Ave Columbus, OH | 3.0 | 1.0 | 1000 | $1,799 | $1.80 | 44d | 1 | 0.61mi |
| 3054 McGuffey Rd Columbus, OH | 3.0 | 1.0 | 1106 | $1,450 | $1.31 | 44d | 1 | 0.62mi |
| 3120 Grasmere Ave Columbus, OH | 2.0 | 1.0 | 842 | $1,395 | $1.66 | 4d | 1 | 0.64mi |
| 3137 Mcguffey Rd Columbus, OH | 2.0 | 1.0 | 950 | $950 | $1.00 | 44d | 1 | 0.68mi |
| 1269 Minnesota Ave Columbus, OH | 3.0 | 1.0 | 1075 | $1,550 | $1.44 | 8d | 1 | 0.71mi |
| 2658 Deming Ave Columbus, OH | 3.0 | 1.0 | 1120 | $1,695 | $1.51 | 44d | 1 | 0.78mi |
| 335 E Duncan St Columbus, OH | 3.0 | 1.0 | 1120 | $1,595 | $1.42 | 44d | 1 | 0.82mi |
| 3421-3431 Maize Rd Unit 3421-A Columbus, OH | 2.0 | 1.5 | 960 | $1,295 | $1.35 | 15d | 1 | 0.85mi |
| 2688 Hibbert Ave Columbus, OH | 2.0 | 1.0 | 748 | $1,195 | $1.60 | 44d | 1 | 0.88mi |
| 2236 Atwood Ter Columbus, OH | 2.0 | 1.0 | 720 | $900 | $1.25 | 8d | 1 | 0.88mi |
| 2299 Hamilton Ave Columbus, OH | 2.0 | 1.0 | 1000 | $1,200 | $1.20 | 44d | 1 | 0.90mi |
| 260 E Hudson St Unit 274 Columbus, OH | 2.0 | 1.0 | 1000 | $1,325 | $1.32 | 3d | 1 | 0.91mi |
| 2217 Grasmere Ave Columbus, OH | 2.0 | 1.5 | 720 | $1,650 | $2.29 | 15d | 1 | 0.92mi |
| 3327 McGuffey Rd Columbus, OH | 3.0 | 1.0 | 1100 | $1,335 | $1.21 | 8d | 1 | 0.93mi |
| 2669 Medary Ave Unit 2667 Columbus, OH | 2.0 | 1.0 | 800 | $1,150 | $1.44 | 44d | 1 | 0.94mi |
| 3450 Indianola Ave Columbus, OH | 2.0 | 1.0–2.0 | 877 | $2,099 | $2.39 | 44d | 13 | 0.96mi |
| 2203-2205 Mcguffey Rd Columbus, OH | 2.0 | 1.0 | 836 | $1,050 | $1.26 | 24d | 1 | 0.96mi |
| 3267 Walmar Dr Columbus, OH | 3.0 | 1.0 | 1106 | $1,550 | $1.40 | 24d | 1 | 0.97mi |
| 184 E Duncan St Unit 184 Duncan-17 Columbus, OH | 2.0 | 1.0 | 700 | $1,025 | $1.46 | 44d | 1 | 0.99mi |
| 967 Duxberry Ave Columbus, OH | 3.0 | 1.0 | 864 | $1,100 | $1.27 | 44d | 1 | 1.01mi |
| 245 Clinton St Columbus, OH | 3.0 | 1.0 | 1100 | $1,650 | $1.50 | 44d | 1 | 1.03mi |
| 1352 E Hudson St Columbus, OH | 2.0 | 1.0 | 800 | $1,150 | $1.44 | 44d | 1 | 1.05mi |
| 1524 Genessee Ave Unit A Columbus, OH | 2.0 | 1.0 | 800 | $1,150 | $1.44 | 4d | 1 | 1.08mi |
| 1435 Republic Ave Columbus, OH | 3.0 | 1.0 | 908 | $1,425 | $1.57 | 20d | 1 | 1.09mi |
| 1435 Republic Ave Columbus, OH | 3.0 | 1.0 | 908 | $1,395 | $1.54 | 8d | 1 | 1.09mi |
Listing history 25 events
-
2026-05-12status Pending 488-char remark
Show marketing remark (488 chars)
This Cape Cod residence is located in the Almada subdivision within the North Linden area of Columbus. The home features 979 square feet of living space including 3 bedrooms and 1 full bathroom. The exterior is finished with vinyl siding and features a 1-car detached garage. A full, unfinished basement provides ample storage or utility space. This property is served by the Columbus CSD and is situated within the City of Columbus corporation limits with access to all public utilities.
-
2026-04-17$149,900 Active 488-char remark
Show marketing remark (488 chars)
This Cape Cod residence is located in the Almada subdivision within the North Linden area of Columbus. The home features 979 square feet of living space including 3 bedrooms and 1 full bathroom. The exterior is finished with vinyl siding and features a 1-car detached garage. A full, unfinished basement provides ample storage or utility space. This property is served by the Columbus CSD and is situated within the City of Columbus corporation limits with access to all public utilities.
-
2019-07-10soldstatus $54,000
-
2019-07-10soldstatus $59,000
-
2018-02-01historical
-
2017-08-20status Active
-
2017-08-09historical Contingent Finance and Inspection
-
2017-06-22$58,300 Active
-
2006-12-12historical
-
2006-04-08$51,900
-
2003-06-03soldstatus $54,000
-
2003-05-07historical
-
2003-05-02$54,000
-
2000-04-24soldstatus $76,000
-
2000-04-20soldstatus $76,000
-
2000-04-03historical
-
2000-02-10$78,000
-
2000-01-07soldstatus $42,175
-
1999-12-13historical
-
1999-12-03$45,000
-
1996-05-06soldstatus $47,900
-
1996-04-29historical
-
1996-01-19$49,500
-
1996-01-17historical
-
1995-10-02$53,900
ⓘ Source: listings_history table (triggers on properties + properties_extension) + one-shot
backfill from property_details.listing_events for pre-trigger history.
Tax reassessment forecast OH · Partial reset (capped growth)
- Current annual tax
- $1,728 · $144/mo
- Projected year-2 tax
- $2,033 · $169/mo
- Expected delta
- +$305/yr (+$25/mo · 17.7%)
ⓘ Screening estimate from a state-policy table — verify with the county assessor before closing.
Climate risk First Street
- Flood 1/10 Low FEMA zone X (unshaded) · 0% chance over 30 yrs
- Wildfire 1/10 Low
- Heat 3/10 Moderate 7 d/yr ≥100°F today · 17 d/yr by 30 yrs out
- Wind 2/10 Low 100% chance of damaging wind over 30 yrs
- Air quality 3/10 Moderate 2 unhealthy d/yr today · 4 by 30 yrs out
Nearby sold comps map
Loading sold comps map…
Walkable amenities ~0.75 mi
Loading nearby amenities…
Taxation est. · year 1
- Rental income
- $16,525
- − Mortgage interest
- −$8,397
- − Property taxes
- −$1,728
- − Insurance
- −$750
- − Repairs & maintenance
- −$1,322
- − Management
- −$1,322
- − Depreciation
- −$4,361
- Taxable loss
- −$1,354
- Est. tax savings @ 24.0%
- +$325
- After-tax cash flow
- $1,469/yr
For passive investors: Depreciation is non-cash, so a rental often shows a tax loss while cash-flowing — sheltering income. Rental losses are passive: they offset passive income freely, and up to $25,000/yr can offset ordinary (W-2) income if you actively participate and your MAGI is under $100k (phasing out to $0 by $150k); unused losses carry forward. On sale, claimed depreciation is recaptured at up to 25%, and gains may owe capital-gains tax (a 1031 exchange can defer both). Figures are a year-1 estimate at your 24.0% rate — not tax advice; consult a CPA.
Schools (NCES district)
- District
- Columbus City School District
- NCES district ID
- 3904380
- Math proficiency
- 15% ▼ -17.00%
- Reading proficiency
- 26% ▼ -12.00%
- Median HH income
- $38,483
- Composite
- 17.19/100
- National rank
- #9105
- State rank
- #626 of 656 in OH
Livability — Columbus
- Score
- 81/100
- State rank
- #97
- US rank
- #1491
Category grades
Schools grade is shown separately in the Schools card above.
Census & demographics
- Census place
- Columbus, OH
- County
- Franklin County · 1,351,780 people
- City population
- 612,189
- Metro
- Columbus, OH
- Population (ZIP)
- 22,313
- Household income
- $42,579
- Rent vs Own
- Severe rent burden
- 1282.0
Population outlook (Franklin County) Hauer SSP2
- Today (2025)
- 1,456,139 people
- By 2030
- 1,556,890 · +6.9%
- By 2040
- 1,757,349 · +20.7%
- By 2050
- 1,950,539 · +34.0%
- By 2075
- 2,376,171 · +63.2%
- By 2100
- 2,636,796 · +81.1%
Race, ethnicity, and origin ACS 2023
- Neighborhood character
- Diverse neighborhood (Simpson 0.60)
- Race & ethnicity
- Black 58% White 21% Hispanic / Latino 13% Two or more races 12% Asian 2%
- Hispanic origin (detail)
- Mexican 8% Dominican 1%
- Common ancestry
- Italian 1%
- Foreign-born
- 10% · Canada, India
- Languages at home
- 84% English-only · Spanish 11% Other Indo-European 2% Arabic 1%
Political lean MEDSL · Franklin
- 2024 margin
- Strong D (+28.4) · D 63.7% · R 35.3% · Other 1.0%
- 2008→2024 swing
- +7.7pp toward D · 2008: 20.7pp · 2024: 28.4pp
- All cycles
- 2024: D+28.4 2020: D+31.4 2016: D+25.9 2012: D+21.7 2008: D+20.7
Not yet ingested
- Civics
- —
Market trends
- HPI YoY
- ▼ -94.10%
- Current HPI
- 250.3885
- Rent YoY
- ▲ 3.41%
- Metro
- Columbus, OH
- State GDP YoY
- ▲ 1.98%
- F500 in state
- 48
Industry mix (Fortune 500 HQ in OH)
| Industry | F500 HQs | Revenue |
|---|---|---|
| Insurance | 3 | $145B |
|
||
| Industrial Machinery | 3 | $49B |
|
||
| Financial Services | 3 | $24B |
|
||
| Consumer Goods | 2 | $93B |
|
||
| Aerospace / Defense | 2 | $47B |
|
||
| Utilities | 2 | $33B |
|
||
Price history
+178.1% since first listed25 events — show timeline
- 2026-05-12 Pending — CBRMLS
- 2026-04-17 Listed $149,900 CBRMLS
- 2019-07-10 Sold (Public Records) $59,000 Public Records
- 2019-07-10 Sold (Public Records) $54,000 Public Records
- 2018-02-01 Listing Removed — CBRMLS
- 2017-08-20 Relisted — CBRMLS
- 2017-08-09 Contingent — CBRMLS
- 2017-06-22 Listed $58,300 CBRMLS
- 2006-12-12 Listing Removed — CBRMLS
- 2006-04-08 Listed $51,900 CBRMLS
- 2003-06-03 Sold (MLS) $54,000 CBRMLS
- 2003-05-07 Listing Removed — CBRMLS
- 2003-05-02 Listed $54,000 CBRMLS
- 2000-04-24 Sold (Public Records) $76,000 Public Records
- 2000-04-20 Sold (MLS) $76,000 CBRMLS
- 2000-04-03 Listing Removed — CBRMLS
- 2000-02-10 Listed $78,000 CBRMLS
- 2000-01-07 Sold (MLS) $42,175 CBRMLS
- 1999-12-13 Listing Removed — CBRMLS
- 1999-12-03 Listed $45,000 CBRMLS
- 1996-05-06 Sold (Public Records) $47,900 Public Records
- 1996-04-29 Listing Removed — CBRMLS
- 1996-01-19 Listed $49,500 CBRMLS
- 1996-01-17 Listing Removed — CBRMLS
- 1995-10-02 Listed $53,900 CBRMLS
Property tax history
+10.4%/yrLatest (2024): $1,728 · +1.3% YoY. Source: county tax records.
Cash-flow waterfall
monthlySold comps — $/sqft
last 12 mo · ≤1 miLoading sold comps…