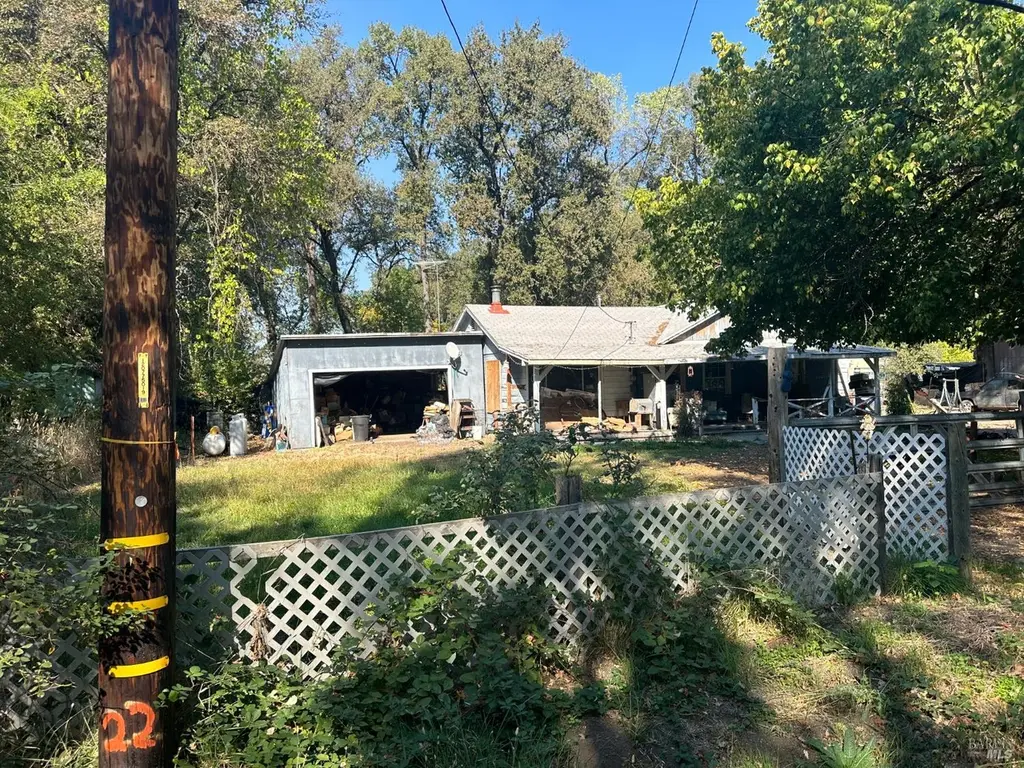
25150 Fairbanks Ln · Covelo, CA
Flood risk 3/10 · Minor
- FEMA flood zone
- X (unshaded)
- Chance of flooding over 30 yrs
- 0.2%
- Est. flood insurance / yr
- $507 – $1,088
Fire risk 9/10 · Severe
- Est. fire insurance / yr
- $659 – $1,223
Heat risk 6/10 · Moderate
- Hot days now (above 101°F)
- 6 days/yr
- Hot days in 30 yrs
- 12 days/yr
Wind risk 1/10 · Minimal
- Chance of severe wind over 30 yrs
- —
Air-quality risk 10/10 · Severe
- Unhealthy air days now
- 46 days/yr
- Unhealthy air days in 30 yrs
- 47 days/yr
Risk factors via First Street. Map © Google.
Why this score? — see what drove the B grade
The composite is a weighted blend of 9 inputs, each scored 0–100. Each bar is that input's sub-score; the figure is the points it added to the 100-point composite (weight × sub-score).
- Cash flow +30.0/30.0
- 1% rule +10.0/10.0
- DSCR +10.0/10.0
- ARV discount +7.5/15.0
- Appreciation +5.0/10.0
- Livability +2.8/5.0
- Rent growth +2.5/5.0
- Condition / age +2.5/5.0
- Schools +1.8/10.0
$74,900
🖨 Deal sheet 📄 Offer letter ✓ Due diligence
Listing remarks
Discover the potential of 25150 Fairbanks Ln in peaceful Covelo, CA! This 2-bedroom, 1-bath home is full of opportunityperfect for investors, first-time buyers, or those seeking a quiet country retreat. Nestled on a spacious lot with room to grow, this property offers a solid foundation to create your dream space inside and out. With a little vision and TLC, this charming home can truly shine!
Key facts
- 1.07 acre lot
- 2 garage spots
- Listed 305 days
Neighborhood map
What this means for you Summary
Snapshot
- This is a 2-bed/1.0-bath single-family listed at $75k.
Deal economics
- At list price, monthly cash flow is $501 ($6k/yr) — positive.
- The deal already cash-flows at list — no discount required.
- Meets the 1% rule at list price ($1k rent vs $75k).
- Recommended offer: $66k (12.0% below list) — sets the bar for market timing.
Location & tenants
- Location reads 56/100 on livability (#806 in CA) — a working-class tenant base; expect higher turnover. Strengths: crime B; Watch: housing D+, health & safety D+, schools F.
- Round Valley Unified (rural): math 11% / reading 26% proficiency, ranked #1,281 of 1,400 in CA (top 92%) — low school quality limits family demand, transient renter base, plan for 1-2y turnover; 93% free/reduced lunch — lower-income household profile, screen leases tightly.
- Market conditions: 52 active listings in the ZIP; 8 units permitted in Mendocino County in 2024 (0 in 5+ unit buildings).
Forward outlook
- In year one you build about $547 of equity ($518 loan paydown + $29 appreciation (0.0% local appreciation)).
- Mendocino County population projected at -15% by 2050 — secular population decline; favor cash flow + early exit over multi-decade hold.
- At projected returns (0.0% appreciation + 3.0% rent growth), your $21k cash investment doubles in ~4 years — after that, you're playing with house money.
Negotiation context
- It's been on market 305 days — a 12% lower offer ($66k) is reasonable based on typical stale-listing flexibility.
Risks & watch-outs
- Watch-outs: property tax is 2.7% of price.
- Climate carrying-cost: severe wildfire risk; extreme-heat days projected 6→12/yr by 2055 (HVAC capex compounding) — expect insurance premiums to compound above CPI over the hold.
Questions for the listing agent
- It's been on market 305 days. Have you received any prior offers? Is the seller open to a 12% concession, seller financing, or rate buy-down credit?
- Property tax is high relative to price — has the assessment been appealed recently, and will the sale trigger a re-assessment?
- Why hasn't it sold? Are there any deal-killer items the seller is aware of (foundation, flood, title, zoning, code violations)?
- Is there a deadline driving the sale (1031 exchange, divorce, estate, relocation)? That informs how much negotiation room exists.
- Schools are F-rated, which usually means shorter tenancies and higher turnover. Who's the typical renter profile here, and what's been the actual vacancy rate?
- What's the average days-on-market for RENTAL listings here right now (not sales)? A rising rental-DOM trend means longer vacancies and softer asking-rent achievability than the comps imply.
- What's the recent tenant-quality profile in this submarket — average credit score on applications, eviction rate, late-payment / NSF rate, and stable-employment percentage? A property-management company in the area should have these aggregated.
- How much new for-sale + rental construction is in the pipeline within 1–3 miles? Heavy new supply typically softens prices + rents 12–24 months out; constrained supply supports both.
Investment metrics
- 1% rule
- 1.84% ✓
- Cap rate
- 14.32%
- Cash-on-cash
- 28.69%
- DSCR
- 2.28
- GRM
- 4.5
CMA / ARV
- ARV (median comp)
- $282,925
- List price
- $74,900
- Delta
- -73.53%
- Verdict
- UNDERPRICED
- Comps
- 4 within 1.0 mi
Projected returns pro-forma
0.04% appreciation · 3.0% rent growth · sell at horizon
- IRR
- 29.2%
- Equity multiple
- 2.43×
- Total profit
- $29,942
- Equity at exit
- $21,895
- IRR
- 32.9%
- Equity multiple
- 4.69×
- Total profit
- $77,434
- Equity at exit
- $26,436
Cash invested: $20,972 (down + closing). Projections, not guarantees.
Landlord ↔ Tenant lean methodology
- Overall (STATE)
- 18 Strongly Tenant-Friendly
- State California
- 18 Strongly Tenant-Friendly · D+13
- County
- — inherits STATE
- City
- — inherits STATE
ZIP-level market 95428
- Home prices YoY
- 0.0%
- Active inventory
- 52
- Price-to-rent
- 4.5×
Monthly cashflow live
- Estimated rent
- $1,381 medium interval (Pro) →
- Mortgage (P&I)
- −$393
- Tax from tax record
- −$166 /mo · $1,987/yr
- Insurance
- −$31
- HOA
- −$0
- Vacancy / Maint / Mgmt
- −$290
- Net cashflow
- $501
Break-even live
UW: 25.0% down · 7.5% · 30yr · 1.5% tax · 5.0% vac · 8.0% maint · 8.0% mgmt
Financing live
Cash to close
- Down payment
- $18,725
- Closing costs
- $2,247
- Reserves months
- —
- Total cash needed
- —
Loan-product check · same deal, 3 products live
Conventional
25% down · 7.5% · 30yr
- Down + closing
- —
- Monthly P&I
- —
- Monthly cashflow
- —
- DSCR
- —
- Eligible?
- —
Personal DTI + credit; lowest rate.
DSCR
20% down · 8.5% · 30yr
- Down + closing
- —
- Monthly P&I
- —
- Monthly cashflow
- —
- DSCR
- —
- Eligible?
- —
No personal income docs; deal must DSCR.
Hard money
10% down · 12.0% · 12mo
- Down + closing
- —
- Monthly P&I
- —
- Monthly cashflow
- —
- DSCR
- —
- Eligible?
- —
Short-term bridge; refi at stabilization.
Listing history 12 events
-
2026-06-12statusdays on market $74,900 Pending 305 DOM
-
2026-06-09days on market $74,900 Active 304 DOM
-
2026-06-08days on market $74,900 Active 303 DOM
-
2026-06-07days on market $74,900 Active 302 DOM
-
2026-06-07days on market $74,900 Active 301 DOM
-
2026-06-04days on market $74,900 Active 298 DOM
-
2026-06-02days on market $74,900 Active 297 DOM
-
2026-06-01days on market $74,900 Active 296 DOM
-
2026-05-31days on market $74,900 Active 295 DOM
-
2026-05-31days on market $74,900 Active 294 DOM
-
2001-07-05soldstatus $110,000
-
1986-08-01soldstatus $30,000
ⓘ Source: listings_history table (triggers on properties + properties_extension) + one-shot
backfill from property_details.listing_events for pre-trigger history.
Tax reassessment forecast CA · Resets to sale price
- Current annual tax
- $1,987 · $166/mo
- Projected year-2 tax
- $1,987 · $166/mo
- Expected delta
- $0/yr ($0/mo · 0.0%)
ⓘ Screening estimate from a state-policy table — verify with the county assessor before closing.
Climate risk First Street
- Flood 3/10 Moderate FEMA zone X (unshaded) · 20% chance over 30 yrs
- Wildfire 9/10 Extreme
- Heat 6/10 Major 6 d/yr ≥101°F today · 12 d/yr by 30 yrs out
- Wind 1/10 Low
- Air quality 10/10 Extreme 46 unhealthy d/yr today · 47 by 30 yrs out
Nearby sold comps map
Loading sold comps map…
Walkable amenities ~0.75 mi
Loading nearby amenities…
Taxation est. · year 1
- Rental income
- $16,571
- − Mortgage interest
- −$4,196
- − Property taxes
- −$1,987
- − Insurance
- −$374
- − Repairs & maintenance
- −$1,326
- − Management
- −$1,326
- − Depreciation
- −$2,179
- Taxable income
- $5,183
- Est. tax owed @ 24.0%
- −$1,244
- After-tax cash flow
- $4,772/yr
For passive investors: Depreciation is non-cash, so a rental often shows a tax loss while cash-flowing — sheltering income. Rental losses are passive: they offset passive income freely, and up to $25,000/yr can offset ordinary (W-2) income if you actively participate and your MAGI is under $100k (phasing out to $0 by $150k); unused losses carry forward. On sale, claimed depreciation is recaptured at up to 25%, and gains may owe capital-gains tax (a 1031 exchange can defer both). Figures are a year-1 estimate at your 24.0% rate — not tax advice; consult a CPA.
Schools (NCES district)
- District
- Round Valley Unified
- NCES district ID
- 0633720
- Math proficiency
- 11% ▲ 1.00%
- Reading proficiency
- 26% ▲ 6.00%
- Median HH income
- $32,309
- Composite
- 18.26/100
- National rank
- #14063
- State rank
- #1281 of 1400 in CA
Livability — Covelo
- Score
- 56/100
- State rank
- #806
- US rank
- #22831
Category grades
Schools grade is shown separately in the Schools card above.
Census & demographics
- Population (ZIP)
- 2,667
Population outlook (Mendocino County) Hauer SSP2
- Today (2025)
- 84,643 people
- By 2030
- 82,138 · -3.0%
- By 2040
- 76,402 · -9.7%
- By 2050
- 71,759 · -15.2%
- By 2075
- 61,454 · -27.4%
- By 2100
- 50,130 · -40.8%
Race, ethnicity, and origin ACS 2023
- Neighborhood character
- Highly diverse neighborhood (Simpson 0.80)
- Race & ethnicity
- White 34% Hispanic / Latino 30% Native American 29% Two or more races 13%
- Hispanic origin (detail)
- Mexican 28%
- Common ancestry
- Serbian 4% Italian 2% Slovak 2%
- Foreign-born
- 13% · Canada
- Languages at home
- 78% English-only · Spanish 21% Other Indo-European 1%
Political lean MEDSL · Mendocino
- 2024 margin
- Strong D (+26.8) · D 61.3% · R 34.5% · Other 4.2%
- 2008→2024 swing
- -16.0pp toward R · 2008: 42.8pp · 2024: 26.8pp
- All cycles
- 2024: D+26.8 2020: D+35.8 2016: D+29.1 2012: D+37.6 2008: D+42.8
Not yet ingested
- Civics
- —
Market trends
- HPI YoY
- ▬ 0.04%
- Current HPI
- 151.0199
- Rent YoY
- —
- Metro
- —
- State GDP YoY
- ▲ 3.21%
- F500 in state
- 116
Industry mix (Fortune 500 HQ in CA)
| Industry | F500 HQs | Revenue |
|---|---|---|
| Technology | 27 | $1,492B |
|
||
| Financial Services | 3 | $174B |
|
||
| Retail | 3 | $44B |
|
||
| Insurance | 3 | $26B |
|
||
| Media / Entertainment | 2 | $115B |
|
||
| Pharmaceuticals / Biotech | 2 | $62B |
|
||
Price history
+266.7% since first listed2 events — show timeline
- 2001-07-05 Sold (Public Records) $110,000 Public Records
- 1986-08-01 Sold (Public Records) $30,000 Public Records
Property tax history
+3.5%/yrLatest (2025): $1,987 · +14.8% YoY. Source: county tax records.
Cash-flow waterfall
monthlySold comps — $/sqft
last 12 mo · ≤1 miLoading sold comps…