 Duplex
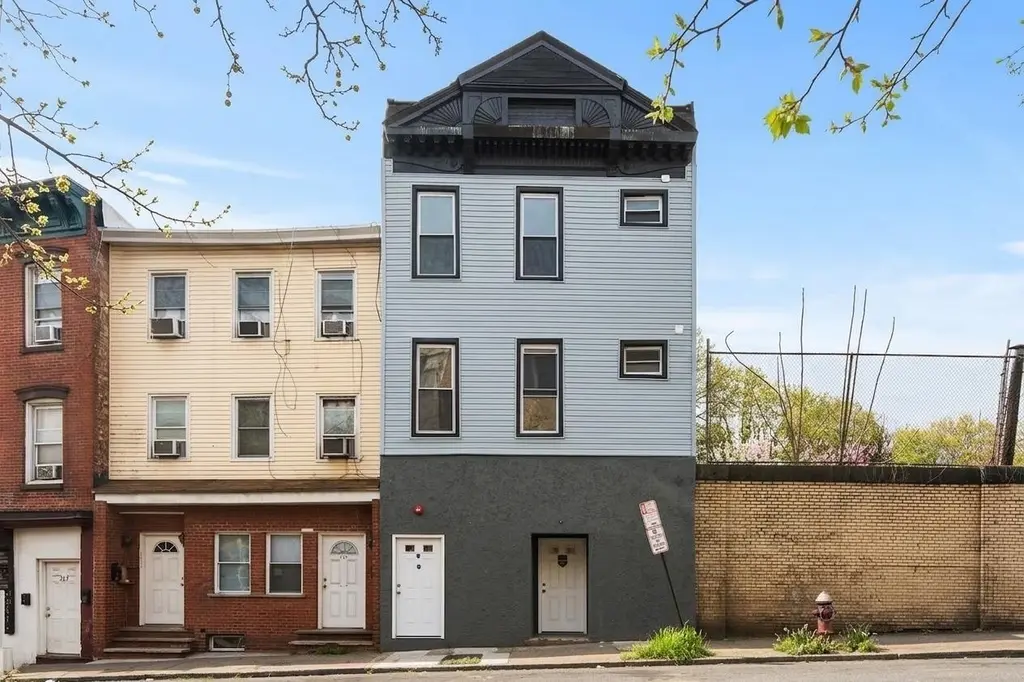
529 COMMUNIPAW Ave · Jersey City, NJ
Flood risk 4/10 · Minor
- FEMA flood zone
- X (unshaded)
- Chance of flooding over 30 yrs
- 0.24%
- Est. flood insurance / yr
- $507 – $1,088
Fire risk 1/10 · Minimal
- Est. fire insurance / yr
- $526 – $976
Heat risk 7/10 · Major
- Hot days now (above 98°F)
- 7 days/yr
- Hot days in 30 yrs
- 15 days/yr
Wind risk 6/10 · Moderate
- Chance of severe wind over 30 yrs
- 27.0%
Air-quality risk 4/10 · Minor
- Unhealthy air days now
- 5 days/yr
- Unhealthy air days in 30 yrs
- 6 days/yr
Risk factors via First Street. Map © Google.
Why this score? — see what drove the C+ grade
The composite is a weighted blend of 9 inputs, each scored 0–100. Each bar is that input's sub-score; the figure is the points it added to the 100-point composite (weight × sub-score).
- Cash flow +27.0/30.0
- DSCR +9.3/10.0
- ARV discount +7.5/15.0
- 1% rule +7.3/10.0
- Livability +3.9/5.0
- Rent growth +3.3/5.0
- Condition / age +2.5/5.0
- Schools +2.4/10.0
- Appreciation +0.0/10.0
$549,900
🖨 Deal sheet 📄 Offer letter ✓ Due diligence
Multi-family units
County records classify this as Multi-Family (2-4 Unit). Listing-text estimate: 2 units. confirmed
Listing remarks
Great Investment Opportunity in Jersey City's Bergen-Lafayette Section! Presenting an exciting mixed-use property with endless potential in the heart of Jersey City! This 3-story building is zoned for a street-level commercial unit and two residential units on the second and third floors. Whether you're an investor, entrepreneur, or someone with a vision, this property offers tremendous upside potential to renovate and customize to your specific needs. The ground floor is perfectly suited for a commercial space—ideal for a retail shop, café, office, or any business that would benefit from high visibility and foot traffic. The upper floors are ready to be transformed into two r
Key facts
- Foot traffic
- Mixed-use property
- High visibility
Tags
Property features AI
Exterior
- Parking: No parking available
- Home design: Property located in Jersey City (Bergen-Lafayette); Between Crescent Ave and Arlington Ave
- Construction: Lead paint form acknowledged
- Exterior features: Aluminum or vinyl exterior; Stucco exterior; Lot 10
Interior
- Kitchen: Six kitchens total; Two kitchens on the first floor; Two kitchens on the second floor; Two kitchens on the third floor
- Bedrooms: Three bedrooms on the first floor; Two bedrooms on the second floor; Two bedrooms on the third floor
- Bathrooms: Seven full bathrooms total; Three full bathrooms on the first floor; Two full bathrooms on the second floor; Two full bathrooms on the third floor
- Heating & cooling: Gas heating/cooling
- Interior features: Unfinished basement; Gas heating
Neighborhood map
What this means for you Summary
Snapshot
- This is a 2 × 4-bed/?-bath units multifamily listed at $550k.
Deal economics
- At list price, monthly cash flow is $2k ($18k/yr) — positive. Per door: $770/mo.
- The deal already cash-flows at list — no discount required.
- Meets the 1% rule at list price ($7k rent vs $550k).
- Cap rate 9.7% vs local median 1.8% in Jersey City — top-decile yield for the area; either an underpriced asset or a hidden risk that comps aren't pricing in. Stress-test before assuming the spread holds.
Location & tenants
- Location reads 77/100 on livability (#116 in NJ, #2,955 nationally) — a middle-class / working-renter tenant base. Strengths: amenities A+, commute A+, employment A+; Watch: crime F, cost of living F.
- Jersey City Public Schools (urban): math 16% / reading 38% proficiency, ranked #369 of 472 in NJ (top 78%) — low school quality limits family demand, transient renter base, plan for 1-2y turnover; 69% free/reduced lunch — lower-income household profile, screen leases tightly.
- Market conditions: Rents rising (+3.3%/yr); 203 active listings in the ZIP; 5,310 units permitted in Hudson County in 2024 (4,154 in 5+ unit buildings).
- At $6,761/mo this rent would consume 114% of the median local household income ($71k/yr) (locally 3598% of renters already pay >50% of income on rent) — very limited rent-growth headroom before tenants either downsize or default.
Forward outlook
- Local home prices are declining (-3.0%/yr); year-one equity from $4k of loan paydown is wiped out by about $16k of value loss. Plan a longer hold.
- Hudson County population projected at +29% by 2050 — long-run rental-demand tailwind backs the buy-and-hold thesis.
- At projected returns (-3.0% appreciation + 3.3% rent growth), your $154k cash investment doubles in ~10 years — after that, you're playing with house money.
Negotiation context
- Only 6 days on market — expect competitive offers; lowballing is unlikely to land.
- 4 sale attempts since 14y ago with the ask held roughly flat each time — persistent listings suggest the price (not the market) is what's stuck; bring a comps-based counter.
Risks & watch-outs
- Climate carrying-cost: major wind risk, 27% chance of damaging wind over 30y; extreme-heat days projected 7→15/yr by 2055 (HVAC capex compounding) — expect insurance premiums to compound above CPI over the hold.
Questions for the listing agent
- Can we see the unit-by-unit rent roll, current vacancy, and any below-market leases? What's the average tenancy length?
- What capital expenditures (roof, boiler, parking lot, exteriors) have been made in the last 5 years, and what's planned in the next 2?
- Is there a deadline driving the sale (1031 exchange, divorce, estate, relocation)? That informs how much negotiation room exists.
- Schools are B-rated — typically a magnet for longer-tenancy family renters. What's the average tenant stay here, and is there a school-zone premium baked into asking?
- Crime grade is F in this area — have there been break-ins, vandalism, or insurance claims at this property in the last 3 years? What carrier currently insures it and at what premium?
- What's the average days-on-market for RENTAL listings here right now (not sales)? A rising rental-DOM trend means longer vacancies and softer asking-rent achievability than the comps imply.
- What's the recent tenant-quality profile in this submarket — average credit score on applications, eviction rate, late-payment / NSF rate, and stable-employment percentage? A property-management company in the area should have these aggregated.
- How much new apartment / multifamily construction is in the pipeline within 1–3 miles? Heavy new supply (>2% of stock underway) typically softens rents 12–24 months out; light construction supports rent growth.
Investment metrics
- 1% rule
- 1.23% ✓
- Cap rate
- 9.66%
- Cash-on-cash
- 12.01%
- DSCR
- 1.53
- GRM
- 6.8
CMA / ARV
No comps found within radius.
Show comp detail 12 sales within ~0.75 mi
| Address | Dist | Beds/Ba | Sqft | Sold | Price | $/sf | Match |
|---|---|---|---|---|---|---|---|
| 437 BRAMHALL Ave | 0.26mi | 8/5.0 | — | 4mo | $1,616,000 | — | 64 |
| 63 BRINKERHOFF St | 0.26mi | 8/5.0 | — | 4mo | $1,100,000 | — | 64 |
| 221 CLERK St | 0.43mi | 8/6.0 | — | 2mo | $1,250,000 | — | 62 |
| 18 BRINKERHOFF St | 0.16mi | 7/4.0 (-1) | — | 4mo | $950,000 | — | 60 |
| 212 CLERK St | 0.44mi | 8/5.0 | — | 4mo | $954,000 | — | 56 |
| 19 CLENDENNY Ave Unit 1 & 2 | 0.49mi | 7/4.5 (-1) | — | 1mo | $851,000 | — | 49 |
| 114 OAK St | 0.49mi | 7/4.0 (-1) | — | 1mo | $855,000 | — | 47 |
| 157 VIRGINIA Ave | 0.62mi | 8/4.0 | — | 1mo | $725,000 | — | 46 |
| 68 LEXINGTON Ave | 0.55mi | 8/3.0 | — | 4mo | $870,000 | — | 43 |
| 103 ORIENT Ave | 0.68mi | 7/4.5 (-1) | — | 1mo | $1,280,000 | — | 40 |
| 203 VIRGINIA Ave | 0.71mi | 8/3.0 | — | 1mo | $750,000 | — | 38 |
| 189A-191 CLAREMONT Ave | 0.73mi | 7/3.0 (-1) | — | 3mo | $700,000 | — | 31 |
Match score weights: distance 35% · size 25% · config 20% · recency 20%. Top-matched comps best support the ARV.
Projected returns pro-forma
-3.0% appreciation · 3.32% rent growth · sell at horizon
- IRR
- 1.9%
- Equity multiple
- 1.07×
- Total profit
- $11,323
- Equity at exit
- $81,992
- IRR
- 11.8%
- Equity multiple
- 1.95×
- Total profit
- $145,670
- Equity at exit
- $47,545
Cash invested: $153,972 (down + closing). Projections, not guarantees.
Landlord ↔ Tenant lean methodology
- Overall (CITY)
- 6 Strongly Tenant-Friendly
- State New Jersey
- 21 Tenant-Leaning · D+6
- County
- — inherits STATE
- City Jersey City
- 6 Strongly Tenant-Friendly · D+34
ZIP-level market 07304
- Home prices YoY
- -34.5%
- Rents YoY
- 3.3%
- Active inventory
- 203
- Price-to-rent
- 13.6×
Monthly cashflow live
- Estimated rent
- $6,761 high interval (Pro) →
- Mortgage (P&I)
- −$2,884
- Tax est. 1.5%
- −$687 /mo · $8,248/yr
- Insurance
- −$229
- HOA
- −$0
- Vacancy / Maint / Mgmt
- −$1,420
- Net cashflow
- $1,541
Break-even live
2-unit breakdown (identical units grouped — click to expand)
| Units | Beds | Baths | Est. rent |
|---|---|---|---|
| 2× units | 4 | — | $6,760 |
| #1 | 4 | — | $3,380 |
| #2 | 4 | — | $3,380 |
| Total (2 units) | $6,761 | ||
UW: 25.0% down · 7.5% · 30yr · 1.5% tax · 5.0% vac · 8.0% maint · 8.0% mgmt
Financing live
Cash to close
- Down payment
- $137,475
- Closing costs
- $16,497
- Reserves months
- —
- Total cash needed
- —
Loan-product check · same deal, 3 products live
Conventional
25% down · 7.5% · 30yr
- Down + closing
- —
- Monthly P&I
- —
- Monthly cashflow
- —
- DSCR
- —
- Eligible?
- —
Personal DTI + credit; lowest rate.
DSCR
20% down · 8.5% · 30yr
- Down + closing
- —
- Monthly P&I
- —
- Monthly cashflow
- —
- DSCR
- —
- Eligible?
- —
No personal income docs; deal must DSCR.
Hard money
10% down · 12.0% · 12mo
- Down + closing
- —
- Monthly P&I
- —
- Monthly cashflow
- —
- DSCR
- —
- Eligible?
- —
Short-term bridge; refi at stabilization.
Listing history 16 events
-
2026-05-06status Under Contract
-
2026-04-29$549,900 Active
-
2026-02-24historical
-
2026-02-17status Back On Market
-
2026-02-02status Under Contract
-
2025-11-20price $699,900
-
2025-09-26price $750,000
-
2025-08-22price $850,000
-
2025-07-09price $925,000
-
2025-06-14price $965,000
-
2025-03-10price $1,035,500
-
2025-02-06price $1,090,000
-
2025-01-09price $1,215,000
-
2024-12-26$1,335,000 Active
-
2012-11-25historical
-
2012-05-24$325,000
ⓘ Source: listings_history table (triggers on properties + properties_extension) + one-shot
backfill from property_details.listing_events for pre-trigger history.
Climate risk First Street
- Flood 4/10 Moderate FEMA zone X (unshaded) · 24% chance over 30 yrs
- Wildfire 1/10 Low
- Heat 7/10 Severe 7 d/yr ≥98°F today · 15 d/yr by 30 yrs out
- Wind 6/10 Major 27% chance of damaging wind over 30 yrs
- Air quality 4/10 Moderate 5 unhealthy d/yr today · 6 by 30 yrs out
Nearby sold comps map
Loading sold comps map…
Walkable amenities ~0.75 mi
Loading nearby amenities…
Taxation est. · year 1
- Rental income
- $81,132
- − Mortgage interest
- −$30,803
- − Property taxes
- −$8,248
- − Insurance
- −$2,750
- − Repairs & maintenance
- −$6,491
- − Management
- −$6,491
- − Depreciation
- −$15,997
- Taxable income
- $10,353
- Est. tax owed @ 24.0%
- −$2,485
- After-tax cash flow
- $16,007/yr
For passive investors: Depreciation is non-cash, so a rental often shows a tax loss while cash-flowing — sheltering income. Rental losses are passive: they offset passive income freely, and up to $25,000/yr can offset ordinary (W-2) income if you actively participate and your MAGI is under $100k (phasing out to $0 by $150k); unused losses carry forward. On sale, claimed depreciation is recaptured at up to 25%, and gains may owe capital-gains tax (a 1031 exchange can defer both). Figures are a year-1 estimate at your 24.0% rate — not tax advice; consult a CPA.
Schools (NCES district)
- District
- Jersey City Public Schools
- NCES district ID
- 3407830
- Math proficiency
- 16% ▼ -17.00%
- Reading proficiency
- 38% ▼ -11.00%
- Median HH income
- $58,431
- Composite
- 24.43/100
- National rank
- #7678
- State rank
- #369 of 472 in NJ
Livability — Jersey City
- Score
- 77/100
- State rank
- #116
- US rank
- #2955
Category grades
Schools grade is shown separately in the Schools card above.
Census & demographics
- Census place
- Jersey City, NJ
- County
- Hudson County · 718,323 people
- City population
- 294,078
- Metro
- New York-Newark-Jersey City, NY-NJ-PA
- Population (ZIP)
- 51,306
- Household income
- $70,986
- Rent vs Own
- Severe rent burden
- 3598.0
Population outlook (Hudson County) Hauer SSP2
- Today (2025)
- 771,834 people
- By 2030
- 818,028 · +6.0%
- By 2040
- 907,866 · +17.6%
- By 2050
- 994,480 · +28.8%
- By 2075
- 1,163,301 · +50.7%
- By 2100
- 1,254,703 · +62.6%
Race, ethnicity, and origin ACS 2023
- Neighborhood character
- Highly diverse neighborhood (Simpson 0.75)
- Race & ethnicity
- Black 33% Hispanic / Latino 28% White 20% Two or more races 15% Asian 14%
- Hispanic origin (detail)
- Mexican 2% Puerto Rican 9% Dominican 10%
- Common ancestry
- Scotch-Irish 1% Hispanic 1% Romanian 1%
- Foreign-born
- 36% · Canada, Vietnam, China
- Languages at home
- 52% English-only · Spanish 22% Arabic 8% Tagalog/Filipino 5%
Political lean MEDSL · Hudson
- 2024 margin
- Strong D (+28.1) · D 62.6% · R 34.6% · Other 2.8%
- 2008→2024 swing
- -18.7pp toward R · 2008: 46.7pp · 2024: 28.1pp
- All cycles
- 2024: D+28.1 2020: D+46.2 2016: D+51.8 2012: D+55.7 2008: D+46.7
Not yet ingested
- Civics
- —
Market trends
- HPI YoY
- ▼ -212.51%
- Current HPI
- 402.9557
- Rent YoY
- ▲ 3.32%
- Metro
- New York-Newark-Jersey City, NY-NJ-PA
- State GDP YoY
- ▲ 2.05%
- F500 in state
- 34
Industry mix (Fortune 500 HQ in NJ)
| Industry | F500 HQs | Revenue |
|---|---|---|
| Consumer Goods | 3 | $31B |
|
||
| Pharmaceuticals | 2 | $153B |
|
||
| Technology | 2 | $21B |
|
||
| Insurance | 2 | $20B |
|
||
| Healthcare | 2 | $19B |
|
||
| Financial Services | 1 | $70B |
|
||
Price history
+69.2% since first listed16 events — show timeline
- 2026-05-06 Pending — HCMLS
- 2026-04-29 Listed $549,900 HCMLS
- 2026-02-24 Listing Removed — HCMLS
- 2026-02-17 Relisted — HCMLS
- 2026-02-02 Pending — HCMLS
- 2025-11-20 Price Changed $699,900 HCMLS
- 2025-09-26 Price Changed $750,000 HCMLS
- 2025-08-22 Price Changed $850,000 HCMLS
- 2025-07-09 Price Changed $925,000 HCMLS
- 2025-06-14 Price Changed $965,000 HCMLS
- 2025-03-10 Price Changed $1,035,500 HCMLS
- 2025-02-06 Price Changed $1,090,000 HCMLS
- 2025-01-09 Price Changed $1,215,000 HCMLS
- 2024-12-26 Listed $1,335,000 HCMLS
- 2012-11-25 Listing Removed — HCMLS
- 2012-05-24 Listed $325,000 HCMLS
Cash-flow waterfall
monthlySold comps — $/sqft
last 12 mo · ≤1 miLoading sold comps…