322 County Highway 26 · Cooperstown, NY
Flood risk 1/10 · Minimal
- FEMA flood zone
- X (unshaded)
- Chance of flooding over 30 yrs
- 0.0%
- Est. flood insurance / yr
- $473 – $860
Fire risk 1/10 · Minimal
- Est. fire insurance / yr
- $691 – $1,283
Heat risk 1/10 · Minimal
- Hot days now (above 93°F)
- 7 days/yr
- Hot days in 30 yrs
- 16 days/yr
Wind risk 2/10 · Minimal
- Chance of severe wind over 30 yrs
- 1.0%
Air-quality risk 2/10 · Minimal
- Unhealthy air days now
- 0 days/yr
- Unhealthy air days in 30 yrs
- 1 days/yr
Risk factors via First Street. Map © Google.
Why this score? — see what drove the A- grade
The composite is a weighted blend of 9 inputs, each scored 0–100. Each bar is that input's sub-score; the figure is the points it added to the 100-point composite (weight × sub-score).
- Cash flow +30.0/30.0
- 1% rule +10.0/10.0
- DSCR +10.0/10.0
- Appreciation +10.0/10.0
- ARV discount +7.5/15.0
- Schools +5.9/10.0
- Livability +3.8/5.0
- Rent growth +2.5/5.0
- Condition / age +2.5/5.0
$39,900
🖨 Deal sheet (PDF) 📄 Offer letter ✓ Due diligence
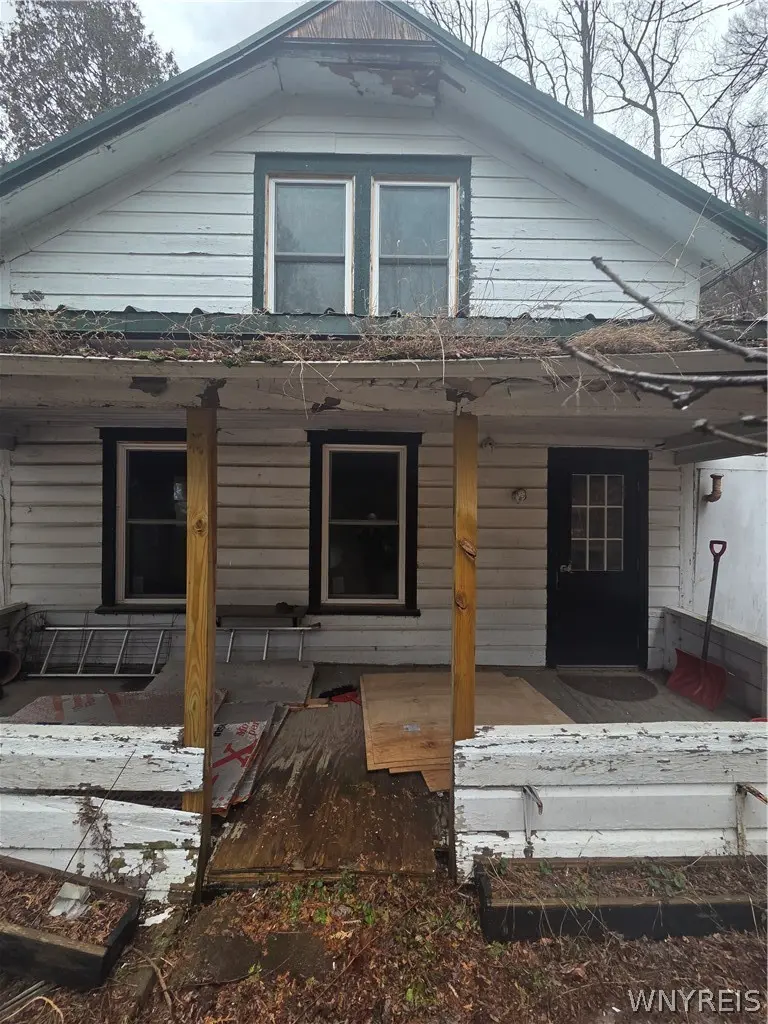
Listing remarks
Attention investors and DIY enthusiasts! Multiple exit strategies: finish this remodel then either flip, rent or move in! Home being sold as is.
Key facts
- 1.47 acre lot
- Built 1870
- Listed 38 days
Neighborhood map
What this means for you Summary
Snapshot
- This is a 3-bed/1.0-bath single-family listed at $40k.
Deal economics
- At list price, monthly cash flow is $572 ($7k/yr) — positive.
- The deal already cash-flows at list — no discount required.
- Meets the 1% rule at list price ($1k rent vs $40k).
- Recommended offer: $39k (3.0% below list) — sets the bar for market timing.
Location & tenants
- Location reads 76/100 on livability (#235 in NY, #3,678 nationally) — a middle-class / working-renter tenant base. Strengths: schools A+, crime A+, health & safety A+; Watch: amenities F, commute F, cost of living F.
- Cooperstown Central School District (rural): math 67% / reading 71% proficiency, ranked #153 of 590 in NY (top 26%) — acceptable for families but not a draw, mixed tenant base, ~2y average lease; only 19% free/reduced lunch — higher-income household profile.
- Market conditions: 37 active listings in the ZIP; 133 units permitted in Otsego County in 2024 (10 in 5+ unit buildings).
Forward outlook
- In year one you build about $4k of equity ($276 loan paydown + $4k appreciation (10.0% local appreciation)).
- Otsego County population projected at -21% by 2050 — secular population decline; favor cash flow + early exit over multi-decade hold.
- At projected returns (10.0% appreciation + 3.0% rent growth), your $11k cash investment doubles in ~2 years — after that, you're playing with house money.
- By year 7, paydown + projected appreciation supports a ~$31k cash-out refi (75% LTV) — recoverable capital for the next deal without selling this one.
Negotiation context
- It's been on market 38 days — a 3% lower offer ($39k) is reasonable based on typical stale-listing flexibility.
Risks & watch-outs
- Watch-outs: property tax is 4.5% of price; built in 1870 — expect roof / HVAC / electrical / plumbing capex.
Questions for the listing agent
- It's been on market 38 days. Have you received any prior offers? Is the seller open to a 3% concession, seller financing, or rate buy-down credit?
- Built in 1870 — when were the roof, HVAC, electrical panel, plumbing, and water heater last replaced?
- Property tax is high relative to price — has the assessment been appealed recently, and will the sale trigger a re-assessment?
- Is there a deadline driving the sale (1031 exchange, divorce, estate, relocation)? That informs how much negotiation room exists.
- Schools are A-rated — typically a magnet for longer-tenancy family renters. What's the average tenant stay here, and is there a school-zone premium baked into asking?
- What's the average days-on-market for RENTAL listings here right now (not sales)? A rising rental-DOM trend means longer vacancies and softer asking-rent achievability than the comps imply.
- What's the recent tenant-quality profile in this submarket — average credit score on applications, eviction rate, late-payment / NSF rate, and stable-employment percentage? A property-management company in the area should have these aggregated.
- How much new for-sale + rental construction is in the pipeline within 1–3 miles? Heavy new supply typically softens prices + rents 12–24 months out; constrained supply supports both.
Investment metrics
- 1% rule
- 3.01% ✓
- Cap rate
- 23.49%
- Cash-on-cash
- 61.43%
- DSCR
- 3.73
- GRM
- 2.8
CMA / ARV
- ARV (on-the-fly)
- $271,362
- Comps found
- 1
Show comp detail 1 sale within ~0.75 mi
| Address | Dist | Beds/Ba | Sqft | Sold | Price | $/sf | Match |
|---|---|---|---|---|---|---|---|
| 593 Greenough Rd | 0.20mi | 2/2.0 (-1) | 943 (-5%) | 3mo | $257,000 | $273 | 71 |
Match score weights: distance 35% · size 25% · config 20% · recency 20%. Top-matched comps best support the ARV.
Projected returns pro-forma
10.0% appreciation · 3.0% rent growth · sell at horizon
- IRR
- 73.5%
- Equity multiple
- 6.21×
- Total profit
- $58,237
- Equity at exit
- $35,945
- IRR
- 67.4%
- Equity multiple
- 13.80×
- Total profit
- $143,012
- Equity at exit
- $77,517
Cash invested: $11,172 (down + closing). Projections, not guarantees.
Landlord ↔ Tenant lean methodology
- Overall (STATE)
- 15 Strongly Tenant-Friendly
- State New York
- 15 Strongly Tenant-Friendly · D+10
- County
- — inherits STATE
- City
- — inherits STATE
ZIP-level market 13326
- Home prices YoY
- 10.9%
- Active inventory
- 37
- Price-to-rent
- 2.8×
Monthly cashflow live
- Estimated rent
- $1,200 medium interval (Pro) →
- Mortgage (P&I)
- −$209
- Tax from tax record
- −$150 /mo · $1,805/yr
- Insurance
- −$17
- HOA
- −$0
- Vacancy / Maint / Mgmt
- −$252
- Net cashflow
- $572
Break-even live
Sensitivity live
| Price | -10% $700 | -5% $583 | +0% $572 | +5% $561 | +10% $549 |
|---|---|---|---|---|---|
| Rent | -10% $477 | -5% $525 | +0% $572 | +5% $619 | +10% $667 |
| Rate | -1.0pp $592 | -0.5pp $582 | base $572 | +0.5pp $562 | +1.0pp $551 |
UW: 25.0% down · 7.5% · 30yr · 1.5% tax · 5.0% vac · 8.0% maint · 8.0% mgmt
Financing live
Cash to close
- Down payment
- $9,975
- Closing costs
- $1,197
- Reserves months
- —
- Total cash needed
- —
Loan-product check · same deal, 3 products live
Conventional
25% down · 7.5% · 30yr
- Down + closing
- —
- Monthly P&I
- —
- Monthly cashflow
- —
- DSCR
- —
- Eligible?
- —
Personal DTI + credit; lowest rate.
DSCR
20% down · 8.5% · 30yr
- Down + closing
- —
- Monthly P&I
- —
- Monthly cashflow
- —
- DSCR
- —
- Eligible?
- —
No personal income docs; deal must DSCR.
Hard money
10% down · 12.0% · 12mo
- Down + closing
- —
- Monthly P&I
- —
- Monthly cashflow
- —
- DSCR
- —
- Eligible?
- —
Short-term bridge; refi at stabilization.
Listing history 3 events
-
2026-04-27status Pending
-
2026-03-25price $39,900
-
2026-03-20$54,900 Active
ⓘ Source: listings_history table (triggers on properties + properties_extension) + one-shot
backfill from property_details.listing_events for pre-trigger history.
Tax reassessment forecast NY · Partial reset (capped growth)
- Current annual tax
- $1,805 · $150/mo
- Projected year-2 tax
- $1,805 · $150/mo
- Expected delta
- $0/yr ($0/mo · 0.0%)
ⓘ Screening estimate from a state-policy table — verify with the county assessor before closing.
Climate risk First Street
- Flood 1/10 Low FEMA zone X (unshaded) · 0% chance over 30 yrs
- Wildfire 1/10 Low
- Heat 1/10 Low 7 d/yr ≥93°F today · 16 d/yr by 30 yrs out
- Wind 2/10 Low 100% chance of damaging wind over 30 yrs
- Air quality 2/10 Low 0 unhealthy d/yr today · 1 by 30 yrs out
Nearby sold comps map
Loading sold comps map…
Walkable amenities ~0.75 mi
Loading nearby amenities…
Taxation est. · year 1
- Rental income
- $14,404
- − Mortgage interest
- −$2,235
- − Property taxes
- −$1,805
- − Insurance
- −$200
- − Repairs & maintenance
- −$1,152
- − Management
- −$1,152
- − Depreciation
- −$1,161
- Taxable income
- $6,698
- Est. tax owed @ 24.0%
- −$1,608
- After-tax cash flow
- $5,256/yr
For passive investors: Depreciation is non-cash, so a rental often shows a tax loss while cash-flowing — sheltering income. Rental losses are passive: they offset passive income freely, and up to $25,000/yr can offset ordinary (W-2) income if you actively participate and your MAGI is under $100k (phasing out to $0 by $150k); unused losses carry forward. On sale, claimed depreciation is recaptured at up to 25%, and gains may owe capital-gains tax (a 1031 exchange can defer both). Figures are a year-1 estimate at your 24.0% rate — not tax advice; consult a CPA.
Schools (NCES district)
- District
- Cooperstown Central School District
- NCES district ID
- 3608250
- Math proficiency
- 67% ▼ -5.00%
- Reading proficiency
- 71% ▲ 2.00%
- Median HH income
- $56,099
- Composite
- 59.11/100
- National rank
- #954
- State rank
- #153 of 590 in NY
Livability — Cooperstown
- Score
- 76/100
- State rank
- #235
- US rank
- #3678
Category grades
Schools grade is shown separately in the Schools card above.
Census & demographics
- Population (ZIP)
- 4,536
Population outlook (Otsego County) Hauer SSP2
- Today (2025)
- 57,987 people
- By 2030
- 55,403 · -4.5%
- By 2040
- 50,336 · -13.2%
- By 2050
- 45,715 · -21.2%
- By 2075
- 38,769 · -33.1%
- By 2100
- 33,468 · -42.3%
Race, ethnicity, and origin ACS 2023
- Neighborhood character
- Predominantly White (85%)
- Race & ethnicity
- White 85% Asian 5% Two or more races 4% Hispanic / Latino 4% Black 2%
- Common ancestry
- Slovak 8% Romanian 5% Portuguese 3%
- Foreign-born
- 10% · Canada, China
- Languages at home
- 89% English-only · Other Indo-European 4% Spanish 2% Tagalog/Filipino 1%
Political lean MEDSL · Otsego
- 2024 margin
- Lean R (+7.9) · D 46.1% · R 53.9%
- 2008→2024 swing
- -13.8pp toward R · 2008: 5.9pp · 2024: -7.9pp
- All cycles
- 2024: R+7.9 2020: R+5.0 2016: R+13.0 2012: D+2.0 2008: D+5.9
Not yet ingested
- Civics
- —
Market trends
- HPI YoY
- ▲ 40.77%
- Current HPI
- 415.0073
- Rent YoY
- —
- Metro
- —
- State GDP YoY
- ▲ 2.60%
- F500 in state
- 92
Industry mix (Fortune 500 HQ in NY)
| Industry | F500 HQs | Revenue |
|---|---|---|
| Financial Services | 10 | $950B |
|
||
| Consumer Goods | 9 | $162B |
|
||
| Insurance | 4 | $225B |
|
||
| Telecommunications | 2 | $144B |
|
||
| Pharmaceuticals | 2 | $112B |
|
||
| Media / Entertainment | 2 | $69B |
|
||
Price history
-27.3% since first listed3 events — show timeline
- 2026-04-27 Pending — WNYREIS
- 2026-03-25 Price Changed $39,900 WNYREIS
- 2026-03-20 Listed $54,900 WNYREIS
Property tax history
+4.4%/yrLatest (2025): $1,805 · +5.9% YoY. Source: county tax records.
Cash-flow waterfall
monthlySold comps — $/sqft
last 12 mo · ≤1 miLoading sold comps…