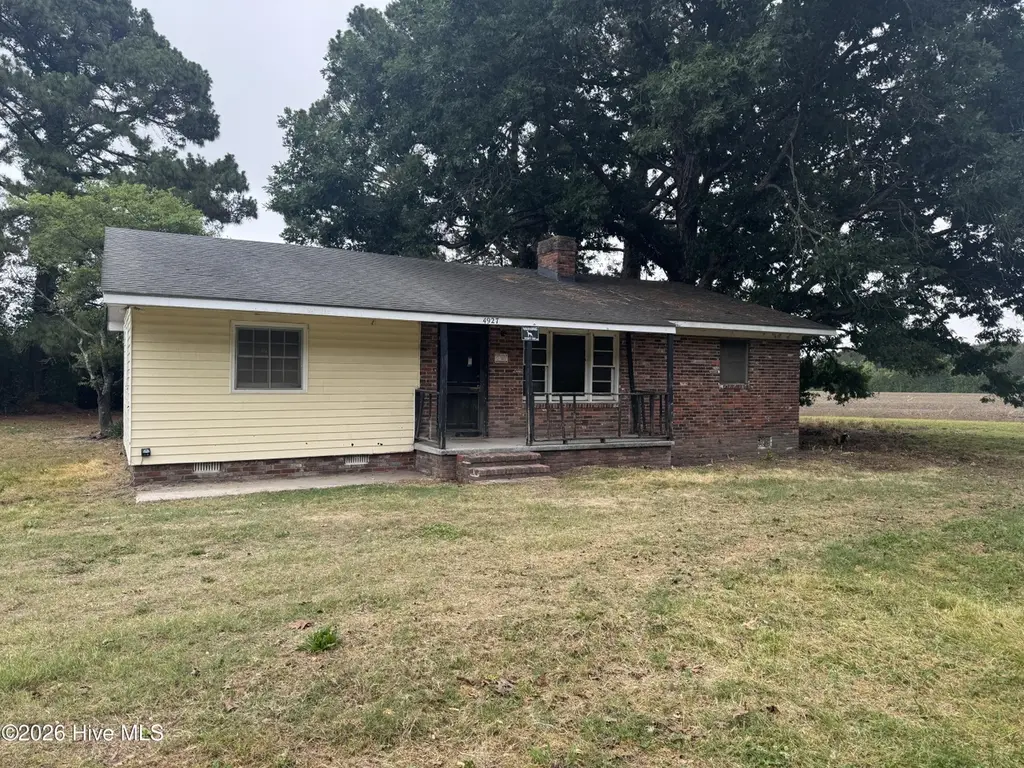
4927 Tartts Mill Rd · Wilson, NC
Flood risk 1/10 · Minimal
- FEMA flood zone
- X (unshaded)
- Chance of flooding over 30 yrs
- 0.0%
- Est. flood insurance / yr
- $507 – $1,088
Fire risk 3/10 · Minor
- Est. fire insurance / yr
- $906 – $1,684
Heat risk 7/10 · Major
- Hot days now (above 107°F)
- 7 days/yr
- Hot days in 30 yrs
- 17 days/yr
Wind risk 8/10 · Major
- Chance of severe wind over 30 yrs
- 80.0%
Air-quality risk 2/10 · Minimal
- Unhealthy air days now
- 2 days/yr
- Unhealthy air days in 30 yrs
- 2 days/yr
Risk factors via First Street. Map © Google.
Why this score? — see what drove the C+ grade
The composite is a weighted blend of 9 inputs, each scored 0–100. Each bar is that input's sub-score; the figure is the points it added to the 100-point composite (weight × sub-score).
- Cash flow +26.3/30.0
- DSCR +8.9/10.0
- ARV discount +7.5/15.0
- 1% rule +6.1/10.0
- Rent growth +4.3/5.0
- Schools +3.3/10.0
- Livability +3.2/5.0
- Condition / age +2.5/5.0
- Appreciation +0.0/10.0
$115,000
🖨 Deal sheet 📄 Offer letter ✓ Due diligence
Listing remarks
NO CITY TAXES!! Perfect remodel home. Needs lots of updates but a good floor plan. 3BR/1BA, 1 acre lot home located in Wilson County. Call for your private showing today.
Key facts
- 1 acre lot
- Built 1960
- Listed 26 days
Property features AI
Finance
- Other: Lot approximately 1 acre (approx. 200 x 217); Road frontage on city street and state road; Not in a subdivision
Exterior
- Parking: Unpaved parking
- Utilities: Water from well; Septic tank; Water available
- Home design: Single-family residence; One story, entry level 1; Residential zoning
- Construction: Brick veneer and vinyl siding over frame construction; Composition roof; Built on crawl space
- Exterior features: Covered porch; Shed(s); Has a view
Interior
- Kitchen: No appliances listed
- Bedrooms: 5 total rooms (includes bedrooms and living spaces)
- Flooring: Hardwood floors
- Bathrooms: 1 full bathroom
- Heating & cooling: Electric forced-air heating; Central air conditioning
- Interior features: Electric water heater; Crawl space foundation
- Laundry & utility: No laundry appliances listed
Neighborhood map
What this means for you Summary
Snapshot
- This is a 2-bed/1.0-bath land listed at $115k.
Deal economics
- At list price, monthly cash flow is $297 ($4k/yr) — positive.
- The deal already cash-flows at list — no discount required.
- Meets the 1% rule at list price ($1k rent vs $115k).
- Recommended offer: $113k (1.5% below list) — sets the bar for market timing.
- Cap rate 9.4% vs local median 3.4% in Wilson — top-decile yield for the area; either an underpriced asset or a hidden risk that comps aren't pricing in. Stress-test before assuming the spread holds.
Location & tenants
- Location reads 64/100 on livability (#374 in NC) — a middle-class / working-renter tenant base. Strengths: cost of living A+, housing A+, health & safety A; Watch: crime F, amenities F, commute F.
- Wilson County Schools (rural): math 38% / reading 40% proficiency, ranked #119 of 178 in NC (top 67%) — families likely to look elsewhere, expect single-tenant / working-renter base with shorter leases.
- Zoned schools: Gardners Elementary (math 47% / reading 47%, grade D-, #497 of 1,410 statewide, top 38%, 219 students, 99% FRL); Speight Middle (math 23% / reading 33%, grade F, #360 of 475 statewide, top 77%, 294 students, 99% FRL); Beddingfield High (math 57% / reading 32%, grade F, #352 of 535 statewide, top 68%, 682 students, 98% FRL) — zoned schools average 99% FRL vs 58% district-wide (40 pts higher); higher-poverty schools than district average — tighter screening recommended.
- Market conditions: Rents rising fast (+7.0%/yr); 261 active listings in the ZIP; lower-income renter base — watch delinquency; 580 units permitted in Wilson County in 2024 (168 in 5+ unit buildings).
- This rent runs 36% of the median local income ($43k/yr) — at the standard rent-burdened threshold; future hikes will face affordability resistance.
Forward outlook
- Local home prices are declining (-3.0%/yr); year-one equity from $795 of loan paydown is wiped out by about $3k of value loss. Plan a longer hold.
- Wilson County population projected to shrink 5% by 2050 — rents likely to lag national; underwrite the cash flow, not the appreciation.
- At projected returns (-3.0% appreciation + 7.0% rent growth), your $32k cash investment doubles in ~8 years — after that, you're playing with house money.
Negotiation context
- It's been on market 26 days — a 2% lower offer ($113k) is reasonable based on typical stale-listing flexibility.
Risks & watch-outs
- Climate carrying-cost: severe wind risk, 80% chance of damaging wind over 30y; extreme-heat days projected 7→17/yr by 2055 (HVAC capex compounding) — expect insurance premiums to compound above CPI over the hold.
Questions for the listing agent
- Built in 1960 — when were the roof, HVAC, electrical panel, plumbing, and water heater last replaced?
- Is there a deadline driving the sale (1031 exchange, divorce, estate, relocation)? That informs how much negotiation room exists.
- Schools are F-rated, which usually means shorter tenancies and higher turnover. Who's the typical renter profile here, and what's been the actual vacancy rate?
- Crime grade is F in this area — have there been break-ins, vandalism, or insurance claims at this property in the last 3 years? What carrier currently insures it and at what premium?
- What's the average days-on-market for RENTAL listings here right now (not sales)? A rising rental-DOM trend means longer vacancies and softer asking-rent achievability than the comps imply.
- What's the recent tenant-quality profile in this submarket — average credit score on applications, eviction rate, late-payment / NSF rate, and stable-employment percentage? A property-management company in the area should have these aggregated.
- How much new for-sale + rental construction is in the pipeline within 1–3 miles? Heavy new supply typically softens prices + rents 12–24 months out; constrained supply supports both.
Investment metrics
- 1% rule
- 1.11% ✓
- Cap rate
- 9.39%
- Cash-on-cash
- 11.06%
- DSCR
- 1.49
- GRM
- 7.5
CMA / ARV
No comps found within radius.
Projected returns pro-forma
-3.0% appreciation · 7.01% rent growth · sell at horizon
- IRR
- 4.3%
- Equity multiple
- 1.17×
- Total profit
- $5,571
- Equity at exit
- $17,147
- IRR
- 17.0%
- Equity multiple
- 2.64×
- Total profit
- $52,854
- Equity at exit
- $9,943
Cash invested: $32,200 (down + closing). Projections, not guarantees.
Landlord ↔ Tenant lean methodology
- Overall (STATE)
- 85 Strongly Landlord-Friendly
- State North Carolina
- 85 Strongly Landlord-Friendly · R+3
- County
- — inherits STATE
- City
- — inherits STATE
ZIP-level market 27893
- Rents YoY
- 7.0%
- Active inventory
- 261
- Price-to-rent
- 7.5×
Monthly cashflow live
- Estimated rent
- $1,272 medium interval (Pro) →
- Mortgage (P&I)
- −$603
- Tax from tax record
- −$57 /mo · $688/yr
- Insurance
- −$48
- HOA
- −$0
- Vacancy / Maint / Mgmt
- −$267
- Net cashflow
- $297
Break-even live
UW: 25.0% down · 7.5% · 30yr · 1.5% tax · 5.0% vac · 8.0% maint · 8.0% mgmt
Financing live
Cash to close
- Down payment
- $28,750
- Closing costs
- $3,450
- Reserves months
- —
- Total cash needed
- —
Loan-product check · same deal, 3 products live
Conventional
25% down · 7.5% · 30yr
- Down + closing
- —
- Monthly P&I
- —
- Monthly cashflow
- —
- DSCR
- —
- Eligible?
- —
Personal DTI + credit; lowest rate.
DSCR
20% down · 8.5% · 30yr
- Down + closing
- —
- Monthly P&I
- —
- Monthly cashflow
- —
- DSCR
- —
- Eligible?
- —
No personal income docs; deal must DSCR.
Hard money
10% down · 12.0% · 12mo
- Down + closing
- —
- Monthly P&I
- —
- Monthly cashflow
- —
- DSCR
- —
- Eligible?
- —
Short-term bridge; refi at stabilization.
Listing history 17 events
-
2026-06-17status $115,000 Pending 26 DOM
-
2026-06-17days on market $115,000 Active 26 DOM
-
2026-06-16days on market $115,000 Active 25 DOM
-
2026-06-15days on market $115,000 Active 24 DOM
-
2026-06-14days on market $115,000 Active 22 DOM
-
2026-06-13days on market $115,000 Active 21 DOM
-
2026-06-10days on market $115,000 Active 19 DOM
-
2026-06-09days on market $115,000 Active 18 DOM
-
2026-06-08days on market $115,000 Active 17 DOM
-
2026-06-07days on market $115,000 Active 16 DOM
-
2026-06-05days on market $115,000 Active 13 DOM
-
2026-06-03days on market $115,000 Active 12 DOM
-
2026-06-02days on market $115,000 Active 11 DOM
-
2026-06-01days on market $115,000 Active 10 DOM
-
2026-05-31days on market $115,000 Active 9 DOM
-
2026-05-30days on market $115,000 Active 8 DOM
-
2026-05-22$115,000 Active
ⓘ Source: listings_history table (triggers on properties + properties_extension) + one-shot
backfill from property_details.listing_events for pre-trigger history.
Tax reassessment forecast NC · Resets to sale price
- Current annual tax
- $688 · $57/mo
- Projected year-2 tax
- $943 · $79/mo
- Expected delta
- +$255/yr (+$21/mo · 37.0%)
ⓘ Screening estimate from a state-policy table — verify with the county assessor before closing.
Climate risk First Street
- Flood 1/10 Low FEMA zone X (unshaded) · 0% chance over 30 yrs
- Wildfire 3/10 Moderate
- Heat 7/10 Severe 7 d/yr ≥107°F today · 17 d/yr by 30 yrs out
- Wind 8/10 Severe 80% chance of damaging wind over 30 yrs
- Air quality 2/10 Low 2 unhealthy d/yr today · 2 by 30 yrs out
Nearby sold comps map
Loading sold comps map…
Walkable amenities ~0.75 mi
Loading nearby amenities…
Taxation est. · year 1
- Rental income
- $15,267
- − Mortgage interest
- −$6,442
- − Property taxes
- −$688
- − Insurance
- −$575
- − Repairs & maintenance
- −$1,221
- − Management
- −$1,221
- − Depreciation
- −$3,345
- Taxable income
- $1,774
- Est. tax owed @ 24.0%
- −$426
- After-tax cash flow
- $3,135/yr
For passive investors: Depreciation is non-cash, so a rental often shows a tax loss while cash-flowing — sheltering income. Rental losses are passive: they offset passive income freely, and up to $25,000/yr can offset ordinary (W-2) income if you actively participate and your MAGI is under $100k (phasing out to $0 by $150k); unused losses carry forward. On sale, claimed depreciation is recaptured at up to 25%, and gains may owe capital-gains tax (a 1031 exchange can defer both). Figures are a year-1 estimate at your 24.0% rate — not tax advice; consult a CPA.
Schools (NCES district)
- District
- Wilson County Schools
- NCES district ID
- 3705020
- Math proficiency
- 38% ▲ 2.00%
- Reading proficiency
- 40% ▼ -1.00%
- Median HH income
- $39,342
- Composite
- 32.64/100
- National rank
- #5665
- State rank
- #119 of 178 in NC
Livability — Wilson
- Score
- 64/100
- State rank
- #374
- US rank
- #14674
Category grades
Schools grade is shown separately in the Schools card above.
Census & demographics
- County
- Wilson County · 57,967 people
- City population
- 57,967
- Metro
- Wilson, NC
- Population (ZIP)
- 38,512
- Household income
- $42,810
- Rent vs Own
- Severe rent burden
- 2175.0
Population outlook (Wilson County) Hauer SSP2
- Today (2025)
- 82,765 people
- By 2030
- 82,492 · -0.3%
- By 2040
- 81,054 · -2.1%
- By 2050
- 78,610 · -5.0%
- By 2075
- 71,865 · -13.2%
- By 2100
- 62,792 · -24.1%
Race, ethnicity, and origin ACS 2023
- Neighborhood character
- Diverse neighborhood (Simpson 0.61)
- Race & ethnicity
- Black 55% White 27% Hispanic / Latino 16% Two or more races 5%
- Hispanic origin (detail)
- Mexican 13%
- Common ancestry
- Serbian 1% Slovak 1% Lithuanian 1%
- Foreign-born
- 6% · Canada, Jamaica
- Languages at home
- 86% English-only · Spanish 13%
Political lean MEDSL · Wilson
- 2024 margin
- Toss-up / Even · D 49.8% · R 49.4%
- 2008→2024 swing
- -5.7pp toward R · 2008: 6.1pp · 2024: 0.4pp
- All cycles
- 2024: D+0.4 2020: D+2.9 2016: D+5.6 2012: D+7.3 2008: D+6.1
Not yet ingested
- Civics
- —
Market trends
- HPI YoY
- ▼ -149.54%
- Current HPI
- 211.4136
- Rent YoY
- ▲ 7.01%
- Metro
- Wilson, NC
- State GDP YoY
- ▲ 3.28%
- F500 in state
- 26
Industry mix (Fortune 500 HQ in NC)
| Industry | F500 HQs | Revenue |
|---|---|---|
| Financial Services | 2 | $213B |
|
||
| Retail | 2 | $95B |
|
||
| Industrial Conglomerate | 1 | $38B |
|
||
| Metals / Steel | 1 | $35B |
|
||
| Utilities | 1 | $30B |
|
||
| Industrial Machinery | 1 | $19B |
|
||
Price history
1 event — show timeline
- 2026-05-22 Listed $115,000 Hive MLS
Property tax history
+2.3%/yrLatest (2025): $688 · -0.0% YoY. Source: county tax records.
Cash-flow waterfall
monthlySold comps — $/sqft
last 12 mo · ≤1 miLoading sold comps…