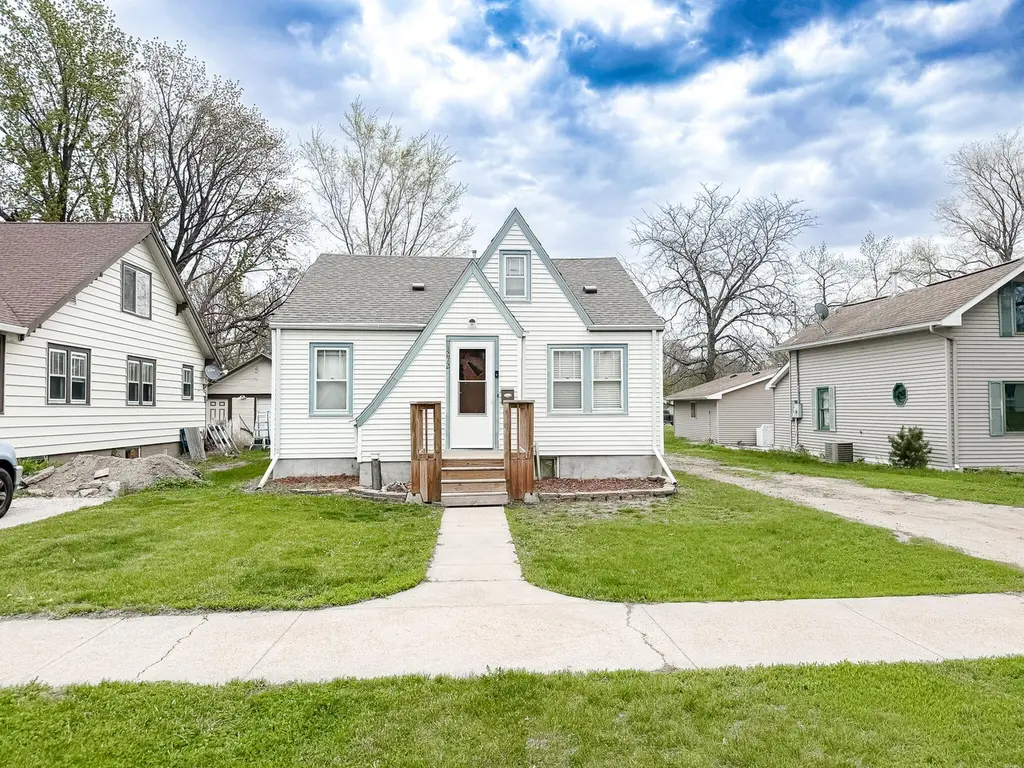
1272 Kansas Ave SE · Huron, SD
Flood risk 1/10 · Minimal
- FEMA flood zone
- X (unshaded)
- Chance of flooding over 30 yrs
- 0.0%
- Est. flood insurance / yr
- $473 – $860
Fire risk 4/10 · Minor
- Est. fire insurance / yr
- $1,342 – $2,492
Heat risk 3/10 · Minor
- Hot days now (above 100°F)
- 7 days/yr
- Hot days in 30 yrs
- 14 days/yr
Wind risk 2/10 · Minimal
- Chance of severe wind over 30 yrs
- —
Air-quality risk 2/10 · Minimal
- Unhealthy air days now
- 1 days/yr
- Unhealthy air days in 30 yrs
- 1 days/yr
Risk factors via First Street. Map © Google.
Why this score? — see what drove the D grade
The composite is a weighted blend of 9 inputs, each scored 0–100. Each bar is that input's sub-score; the figure is the points it added to the 100-point composite (weight × sub-score).
- Cash flow +15.9/30.0
- ARV discount +8.5/15.0
- DSCR +4.9/10.0
- 1% rule +3.7/10.0
- Livability +3.6/5.0
- Schools +3.1/10.0
- Rent growth +2.5/5.0
- Condition / age +2.5/5.0
- Appreciation +0.0/10.0
$161,000
🖨 Deal sheet (PDF) 📄 Offer letter ✓ Due diligence
Listing remarks MLS
Charming Home with 3+ Bedrooms & 1 Bath. Great Starter Home! Many Updates Including: Bathroom, Kitchen, Flooring, Central Air, Breaker Box, Water Heater & Front Deck. Maintenance Free Vinyl Siding. Detached Single Garage. The Upper Level Offers So Many Options! Move In Ready! Call Now for Your Private Showing!
Key facts
- 7,260 sq ft lot
- Garage
- Built 1921
Property features AI
Exterior
- Parking: 1-car garage
- Home design: Residential property; Vinyl siding
- Construction: Vinyl siding construction
- Exterior features: Paved road frontage
Interior
- Kitchen: Microwave; Refrigerator; Standard kitchen appliances
- Bathrooms: 1 full bathroom
- Heating & cooling: Central air conditioning
- Interior features: Basement with sump pump; Dryer; Microwave; Refrigerator; Washer
- Laundry & utility: Washer and dryer; Basement utility access (sump pump)
Neighborhood map
What this means for you Summary
Snapshot
- This is a 3-bed/1.0-bath single-family listed at $161k.
Deal economics
- At list price, monthly cash flow is $77 ($921/yr) — positive.
- The deal already cash-flows at list — no discount required.
- To meet the 1% rule (rent ≥ 1% of price), the offer needs to be $140k (13.3% below list).
- Recommended offer: $140k (13.3% below list) — sets the bar for 1% rule.
- Cap rate 6.9% vs local median 4.0% in Huron — top-decile yield for the area; either an underpriced asset or a hidden risk that comps aren't pricing in. Stress-test before assuming the spread holds.
Location & tenants
- Location reads 72/100 on livability (#48 in SD) — a middle-class / working-renter tenant base. Strengths: cost of living A+, housing A+; Watch: employment C-, health & safety C-, amenities F.
- Huron School District 02-2 (town): math 30% / reading 44% proficiency, ranked #55 of 59 in SD (top 93%) — families likely to look elsewhere, expect single-tenant / working-renter base with shorter leases.
- Zoned schools: Huron Colony Elementary - 13 (math 24% / reading 24%, 17 students, 0% FRL); Huron Middle School - 02 (math 33% / reading 51%, grade D-, #93 of 143 statewide, top 67%, 695 students, 59% FRL); Huron High School - 01 (math 32% / reading 62%, grade D-, #108 of 151 statewide, top 71%, 836 students, 46% FRL).
- Market conditions: 149 active listings in the ZIP; 30 units permitted in Beadle County in 2024 (6 in 5+ unit buildings).
Forward outlook
- Local home prices are declining (-3.0%/yr); year-one equity from $1k of loan paydown is wiped out by about $5k of value loss. Plan a longer hold.
- Beadle County population projected at +39% by 2050 — long-run rental-demand tailwind backs the buy-and-hold thesis.
Negotiation context
- It's been on market 40 days — a 3% lower offer ($156k) is reasonable based on typical stale-listing flexibility.
- 2 sale attempts since 3y ago with the ask held roughly flat each time — persistent listings suggest the price (not the market) is what's stuck; bring a comps-based counter.
- Current owner paid $139k; 16% above their basis — modest negotiation headroom, anchor on the comps not their cost.
Risks & watch-outs
- Watch-outs: built in 1921 — expect roof / HVAC / electrical / plumbing capex.
Questions for the listing agent
- It's been on market 40 days. Have you received any prior offers? Is the seller open to a 13% concession, seller financing, or rate buy-down credit?
- Built in 1921 — when were the roof, HVAC, electrical panel, plumbing, and water heater last replaced?
- Is there a deadline driving the sale (1031 exchange, divorce, estate, relocation)? That informs how much negotiation room exists.
- Schools are D-rated, which usually means shorter tenancies and higher turnover. Who's the typical renter profile here, and what's been the actual vacancy rate?
- The area grade is low — what's the realistic commute time and amenity access for the typical tenant pool here? Any planned neighborhood developments (good or bad) we should know about?
- What's the average days-on-market for RENTAL listings here right now (not sales)? A rising rental-DOM trend means longer vacancies and softer asking-rent achievability than the comps imply.
- What's the recent tenant-quality profile in this submarket — average credit score on applications, eviction rate, late-payment / NSF rate, and stable-employment percentage? A property-management company in the area should have these aggregated.
- How much new for-sale + rental construction is in the pipeline within 1–3 miles? Heavy new supply typically softens prices + rents 12–24 months out; constrained supply supports both.
Investment metrics
- 1% rule
- 0.87% ✗
- Cap rate
- 6.86%
- Cash-on-cash
- 2.04%
- DSCR
- 1.09
- GRM
- 9.6
CMA / ARV
- ARV (median comp)
- $164,586
- List price
- $161,000
- Delta
- -2.18%
- Verdict
- FAIR
- Comps
- 20 within 1.0 mi
Show comp detail 12 sales within ~0.75 mi
| Address | Dist | Beds/Ba | Sqft | Sold | Price | $/sf | Match |
|---|---|---|---|---|---|---|---|
| 1378 Iowa Ave SE | 0.11mi | 2/1.0 (-1) | 1,792 (-6%) | 7mo | $142,500 | $80 | 75 |
| 1104 Kansas Ave SE | 0.14mi | 3/2.0 | 1,848 (-2%) | 12mo | $180,000 | $97 | 75 |
| 1264 Iowa Ave SE | 0.07mi | 4/2.0 (+1) | 1,792 (-6%) | 6mo | $200,000 | $112 | 73 |
| 1157 Wisconsin Ave SW | 0.23mi | 2/1.0 (-1) | 1,840 (-3%) | 12mo | $75,000 | $41 | 69 |
| 1108 Beach Ave SE | 0.35mi | 3/2.0 | 1,768 (-7%) | 8mo | $210,000 | $119 | 62 |
| 1118 Beach Ave SE | 0.35mi | 4/2.0 (+1) | 2,088 (+10%) | 10mo | $205,000 | $98 | 50 |
| 845 Madison Blvd SE | 0.60mi | 3/2.0 | 2,028 (+7%) | 8mo | $238,000 | $117 | 50 |
| 840 Colorado Ave SW | 0.61mi | 3/1.5 | 2,112 (+11%) | 5mo | $185,000 | $88 | 46 |
| 645 10th St SW | 0.69mi | 3/2.5 | 1,964 (+4%) | 12mo | $171,000 | $87 | 46 |
| 1130 Simmons Ave SE | 0.47mi | 4/2.0 (+1) | 2,112 (+11%) | 6mo | $196,000 | $93 | 45 |
| 643 Beach Ave SE | 0.60mi | 3/2.0 | 2,089 (+10%) | 9mo | $150,000 | $72 | 44 |
| 555 Idaho Ave SE | 0.61mi | 4/2.0 (+1) | 2,176 (+15%) | 9mo | $245,000 | $113 | 31 |
Match score weights: distance 35% · size 25% · config 20% · recency 20%. Top-matched comps best support the ARV.
Projected returns pro-forma
-3.0% appreciation · 3.0% rent growth · sell at horizon
- IRR
- -13.1%
- Equity multiple
- 0.53×
- Total profit
- $-21,233
- Equity at exit
- $24,006
- IRR
- -4.1%
- Equity multiple
- 0.73×
- Total profit
- $-12,325
- Equity at exit
- $13,920
Cash invested: $45,080 (down + closing). Projections, not guarantees.
Landlord ↔ Tenant lean methodology
- Overall (STATE)
- 83 Strongly Landlord-Friendly
- State South Dakota
- 83 Strongly Landlord-Friendly · R+16
- County
- — inherits STATE
- City
- — inherits STATE
ZIP-level market 57350
- Active inventory
- 149
- Price-to-rent
- 9.6×
Monthly cashflow live
- Estimated rent
- $1,396 medium interval (Pro) →
- Mortgage (P&I)
- −$844
- Tax from tax record
- −$115 /mo · $1,377/yr
- Insurance
- −$67
- HOA
- −$0
- Vacancy / Maint / Mgmt
- −$293
- Net cashflow
- $77
Break-even live
Sensitivity live
| Price | -10% $168 | -5% $122 | +0% $77 | +5% $31 | +10% $-14 |
|---|---|---|---|---|---|
| Rent | -10% $-34 | -5% $22 | +0% $77 | +5% $132 | +10% $187 |
| Rate | -1.0pp $158 | -0.5pp $118 | base $77 | +0.5pp $35 | +1.0pp $-7 |
UW: 25.0% down · 7.5% · 30yr · 1.5% tax · 5.0% vac · 8.0% maint · 8.0% mgmt
Financing live
Cash to close
- Down payment
- $40,250
- Closing costs
- $4,830
- Reserves months
- —
- Total cash needed
- —
Loan-product check · same deal, 3 products live
Conventional
25% down · 7.5% · 30yr
- Down + closing
- —
- Monthly P&I
- —
- Monthly cashflow
- —
- DSCR
- —
- Eligible?
- —
Personal DTI + credit; lowest rate.
DSCR
20% down · 8.5% · 30yr
- Down + closing
- —
- Monthly P&I
- —
- Monthly cashflow
- —
- DSCR
- —
- Eligible?
- —
No personal income docs; deal must DSCR.
Hard money
10% down · 12.0% · 12mo
- Down + closing
- —
- Monthly P&I
- —
- Monthly cashflow
- —
- DSCR
- —
- Eligible?
- —
Short-term bridge; refi at stabilization.
Listing history 16 events
-
2026-06-16status $161,000 Pending 40 DOM
-
2026-06-15days on market $161,000 Active 40 DOM
-
2026-06-13days on market $161,000 Active 38 DOM
-
2026-06-12days on market $161,000 Active 37 DOM
-
2026-06-09days on market $161,000 Active 34 DOM
-
2026-06-08days on market $161,000 Active 33 DOM
-
2026-06-08days on market $161,000 Active 32 DOM
-
2026-06-05days on market $161,000 Active 30 DOM
-
2026-06-04days on market $161,000 Active 28 DOM
-
2026-06-02days on market $161,000 Active 27 DOM
-
2026-06-01days on market $161,000 Active 26 DOM
-
2026-05-31days on market $161,000 Active 25 DOM
-
2026-05-06$161,000 Active 632-char remark
-
2023-07-10soldstatus $139,000
-
2023-07-07soldstatus Closed 323-char remark
Show marketing remark (323 chars)
Charming Home with 3+ Bedrooms & 1 Bath. Great Starter Home! Many Updates Including: Bathroom, Kitchen, Flooring, Central Air, Breaker Box, Water Heater & Front Deck. Maintenance Free Vinyl Siding. Detached Single Garage. The Upper Level Offers So Many Options! Move In Ready! Call Now for Your Private Showing!
-
2023-05-14$144,900 Active 323-char remark
Show marketing remark (323 chars)
Charming Home with 3+ Bedrooms & 1 Bath. Great Starter Home! Many Updates Including: Bathroom, Kitchen, Flooring, Central Air, Breaker Box, Water Heater & Front Deck. Maintenance Free Vinyl Siding. Detached Single Garage. The Upper Level Offers So Many Options! Move In Ready! Call Now for Your Private Showing!
ⓘ Source: listings_history table (triggers on properties + properties_extension) + one-shot
backfill from property_details.listing_events for pre-trigger history.
Tax reassessment forecast SD · Resets to sale price
- Current annual tax
- $1,377 · $115/mo
- Projected year-2 tax
- $2,109 · $176/mo
- Expected delta
- +$732/yr (+$61/mo · 53.2%)
ⓘ Screening estimate from a state-policy table — verify with the county assessor before closing.
Climate risk First Street
- Flood 1/10 Low FEMA zone X (unshaded) · 0% chance over 30 yrs
- Wildfire 4/10 Moderate
- Heat 3/10 Moderate 7 d/yr ≥100°F today · 14 d/yr by 30 yrs out
- Wind 2/10 Low
- Air quality 2/10 Low 1 unhealthy d/yr today · 1 by 30 yrs out
Nearby sold comps map
Loading sold comps map…
Walkable amenities ~0.75 mi
Loading nearby amenities…
Taxation est. · year 1
- Rental income
- $16,753
- − Mortgage interest
- −$9,019
- − Property taxes
- −$1,377
- − Insurance
- −$805
- − Repairs & maintenance
- −$1,340
- − Management
- −$1,340
- − Depreciation
- −$4,684
- Taxable loss
- −$1,812
- Est. tax savings @ 24.0%
- +$435
- After-tax cash flow
- $1,356/yr
For passive investors: Depreciation is non-cash, so a rental often shows a tax loss while cash-flowing — sheltering income. Rental losses are passive: they offset passive income freely, and up to $25,000/yr can offset ordinary (W-2) income if you actively participate and your MAGI is under $100k (phasing out to $0 by $150k); unused losses carry forward. On sale, claimed depreciation is recaptured at up to 25%, and gains may owe capital-gains tax (a 1031 exchange can defer both). Figures are a year-1 estimate at your 24.0% rate — not tax advice; consult a CPA.
Schools (NCES district)
- District
- Huron School District 02-2
- NCES district ID
- 4635480
- Math proficiency
- 30% ▼ -7.00%
- Reading proficiency
- 44% ▼ -2.00%
- Median HH income
- $43,613
- Composite
- 31.35/100
- National rank
- #5998
- State rank
- #55 of 59 in SD
Livability — Huron
- Score
- 72/100
- State rank
- #48
- US rank
- #6463
Category grades
Schools grade is shown separately in the Schools card above.
Census & demographics
- Census place
- Huron, SD
- Population (ZIP)
- 16,148
Population outlook (Beadle County) Hauer SSP2
- Today (2025)
- 20,094 people
- By 2030
- 21,218 · +5.6%
- By 2040
- 24,042 · +19.6%
- By 2050
- 27,931 · +39.0%
- By 2075
- 43,296 · +115.5%
- By 2100
- 65,888 · +227.9%
Race, ethnicity, and origin ACS 2023
- Neighborhood character
- Majority White (65%)
- Race & ethnicity
- White 65% Hispanic / Latino 16% Asian 11% Two or more races 7% Pacific Islander 2% Native American 1% Black 1%
- Hispanic origin (detail)
- Mexican 7% Puerto Rican 2%
- Common ancestry
- Portuguese 8% Iranian 4% Lithuanian 2%
- Foreign-born
- 15% · Canada, Philippines, Vietnam
- Languages at home
- 80% English-only · Spanish 9% Other Asian/Pacific 7% Vietnamese 2%
Political lean MEDSL · Beadle
- 2024 margin
- Solid R (+40.1) · D 28.8% · R 68.8% · Other 2.4%
- 2008→2024 swing
- -32.8pp toward R · 2008: -7.3pp · 2024: -40.1pp
- All cycles
- 2024: R+40.1 2020: R+38.1 2016: R+37.6 2012: R+18.6 2008: R+7.3
Not yet ingested
- Civics
- —
Market trends
- HPI YoY
- ▼ -116.91%
- Current HPI
- 141.3376
- Rent YoY
- —
- Metro
- —
- State GDP YoY
- ▲ 0.70%
- F500 in state
- 2
Industry mix (Fortune 500 HQ in SD)
| Industry | F500 HQs | Revenue |
|---|---|---|
| Utilities | 1 | $1B |
|
||
Price history
+11.1% since first listed5 events — show timeline
- 2026-06-15 Pending — HBOR
- 2026-05-06 Listed $161,000 HBOR
- 2023-07-10 Sold (Public Records) $139,000 Public Records
- 2023-07-07 Sold (MLS) — HBOR
- 2023-05-14 Listed $144,900 HBOR
Property tax history
+2.7%/yrLatest (2026): $1,377 · -2.3% YoY. Source: county tax records.
Cash-flow waterfall
monthlySold comps — $/sqft
last 12 mo · ≤1 miLoading sold comps…