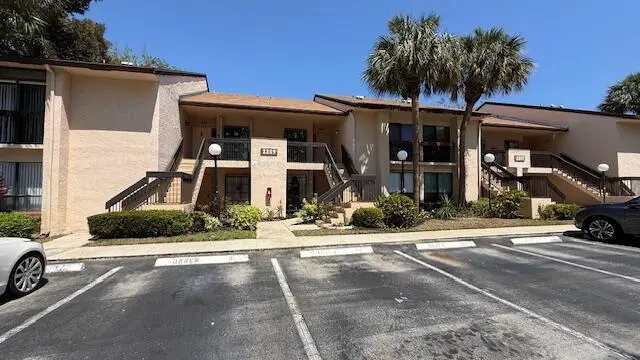
2209 SW 15th St #241 · Deerfield Beach, FL
Flood risk 4/10 · Minor
- FEMA flood zone
- AH
- Chance of flooding over 30 yrs
- 0.2%
- Est. flood insurance / yr
- $1,142 – $2,507
Fire risk 1/10 · Minimal
- Est. fire insurance / yr
- $947 – $1,759
Heat risk 10/10 · Severe
- Hot days now (above 107°F)
- 7 days/yr
- Hot days in 30 yrs
- 28 days/yr
Wind risk 10/10 · Severe
- Chance of severe wind over 30 yrs
- 99.0%
Air-quality risk 2/10 · Minimal
- Unhealthy air days now
- 1 days/yr
- Unhealthy air days in 30 yrs
- 3 days/yr
Risk factors via First Street. Map © Google.
Why this score? — see what drove the D grade
The composite is a weighted blend of 9 inputs, each scored 0–100. Each bar is that input's sub-score; the figure is the points it added to the 100-point composite (weight × sub-score).
- Cash flow +14.6/30.0
- ARV discount +7.5/15.0
- 1% rule +4.9/10.0
- DSCR +4.5/10.0
- Schools +4.1/10.0
- Livability +3.8/5.0
- Rent growth +2.5/5.0
- Condition / age +2.5/5.0
- Appreciation +0.0/10.0
$264,777
🖨 Deal sheet 📄 Offer letter ✓ Due diligence
Listing remarks
This is a must see and very well-priced, 1st floor, 3BR/2BA (currently being used as a 2/2 with a spacious open den which can easily be converted back in to a bedroom) and an in-unit, FULL SIZE washer/dryer. Best of all the parking space is very convenient and only a few steps from the front door in space #346. The master bedroom is spacious and features a large walk-in closet. The condo has an updated kitchen and baths, and newer plush carpet in the bedrooms. The community is a short drive to amazing beaches, shopping, grocery stores, dining, and major highways. The screened in patio overlooks a lush and tropical garden and also features a large and private storage room. The hot water tank
Key facts
- Updated baths
- Updated kitchen
- In-unit washer dryer
Tags
Property features AI
Finance
- Financial info: Pets allowed (with number limit)
- HOA & community: Meadowridge Association; Quarterly HOA fee; Association amenities: Clubhouse, Pool, Spa/Hot Tub, Shuffleboard court, Picnic area, Library; HOA covers insurance, grounds maintenance, structure maintenance, sewer, trash, water, reserve funds, and roof repairs
Exterior
- Parking: Assigned parking; Asphalt parking area; Guest parking (1 open space total)
- Security: Smoke detector(s)
- Utilities: Public water; Public sewer; Circuit breaker electric panel; Cable available; Electricity connected; Phone connected; Sewer connected
- Home design: Condominium; One level (entry level 1); South-facing; Resale condition
- Construction: CBS construction; Shingle roof; Block foundation; Built as a 2-story building
- Exterior features: Covered patio; Screened patio; Patio; Storage
Interior
- Kitchen: Dishwasher; Disposal; Electric range; Microwave; Refrigerator; Electric water heater
- Bedrooms: 3 bedrooms on the main level
- Flooring: Carpet; Laminate; Tile
- Bathrooms: 2 full bathrooms on the main level
- Heating & cooling: Electric heating; Central air conditioning; Ceiling fan(s)
- Interior features: Entrance foyer; Walk-in closet(s); Split bedroom layout; Partially furnished; Single-hung metal windows
- Laundry & utility: In-unit laundry room
Neighborhood map
What this means for you Summary
Snapshot
- This is a 3-bed/2.0-bath condo listed at $265k.
Deal economics
- At list price, monthly cash flow is $-88 ($-1k/yr) — negative.
- To cash-flow at today's rent, offer at most $249k (5.9% below list).
- To meet the 1% rule (rent ≥ 1% of price), the offer needs to be $263k (0.7% below list).
- Recommended offer: $249k (6.0% below list) — sets the bar for market timing.
- Cap rate 6.6% vs local median 4.2% in Deerfield Beach — top-decile yield for the area; either an underpriced asset or a hidden risk that comps aren't pricing in. Stress-test before assuming the spread holds.
Location & tenants
- Location reads 75/100 on livability (#250 in FL, #3,970 nationally) — a middle-class / working-renter tenant base. Strengths: housing A+, health & safety A+, cost of living A; Watch: amenities D-, employment D-.
- Broward (suburban): math 42% / reading 53% proficiency, ranked #46 of 73 in FL (top 63%) — families likely to look elsewhere, expect single-tenant / working-renter base with shorter leases.
- Zoned schools: Park Ridge Elementary School (math 26% / reading 24%, grade F, #2,030 of 2,144 statewide, top 95%, 577 students, 79% FRL); Lyons Creek Middle School (math 49% / reading 53%, grade C, #237 of 571 statewide, top 43%, 1,757 students, 60% FRL); Deerfield Beach High School (math 12% / reading 37%, grade F, #505 of 667 statewide, top 79%, 2,251 students, 69% FRL) — zoned schools average 69% FRL vs 51% district-wide (18 pts higher); higher-poverty schools than district average — tighter screening recommended.
- Zoned-school proficiency averages 34% at this address vs 48% district-wide (-14 pts) — the specific schools serving this property underperform the Broward average; the district grade overstates school quality for this exact location.
- Market conditions: Rents flat; 586 active listings in the ZIP; 40 comparable units currently listed for rent nearby; rentals at typical pace (median 24d on market — plan ~3-4 weeks tenant-placement turnaround); 2,111 units permitted in Broward County in 2024 (1,265 in 5+ unit buildings).
- At $2,630/mo this rent would consume 59% of the median local household income ($53k/yr) (locally 2169% of renters already pay >50% of income on rent) — very limited rent-growth headroom before tenants either downsize or default.
Forward outlook
- Local home prices are declining (-3.0%/yr); year-one equity from $2k of loan paydown is wiped out by about $8k of value loss. Plan a longer hold.
- Broward County population projected at +34% by 2050 — long-run rental-demand tailwind backs the buy-and-hold thesis.
Negotiation context
- It's been on market 82 days — a 6% lower offer ($249k) is reasonable based on typical stale-listing flexibility.
- Current owner paid $60k; list at $265k implies a 341% gain — meaningful room to come down on a strong offer.
Risks & watch-outs
- Watch-outs: flood insurance adds $152/mo.
- Climate carrying-cost: in FEMA flood zone AH (mandatory federal flood insurance); severe wind risk, 99% chance of damaging wind over 30y; extreme-heat days projected 7→28/yr by 2055 (HVAC capex compounding) — expect insurance premiums to compound above CPI over the hold.
Questions for the listing agent
- What do current leases actually rent for vs. the listed asking? Can we see a recent rent roll and the last 12 months of T-12 income?
- It's been on market 82 days. Have you received any prior offers? Is the seller open to a 6% concession, seller financing, or rate buy-down credit?
- What's the actual annual flood-insurance premium (NFIP or private), and is the property in a SFHA with mandatory coverage?
- What does the HOA fee cover, when was the last increase, and are there any pending special assessments or reserve-fund shortfalls?
- Any open or pending special assessments — roof, HVAC, plumbing, elevator, façade? What's the per-unit balance and payoff schedule, and is the seller paying it off at close or rolling it to the buyer?
- Why hasn't it sold? Are there any deal-killer items the seller is aware of (foundation, flood, title, zoning, code violations)?
- Is there a deadline driving the sale (1031 exchange, divorce, estate, relocation)? That informs how much negotiation room exists.
- Schools are D-rated, which usually means shorter tenancies and higher turnover. Who's the typical renter profile here, and what's been the actual vacancy rate?
- The area grade is low — what's the realistic commute time and amenity access for the typical tenant pool here? Any planned neighborhood developments (good or bad) we should know about?
- What's the average days-on-market for RENTAL listings here right now (not sales)? A rising rental-DOM trend means longer vacancies and softer asking-rent achievability than the comps imply.
- What's the recent tenant-quality profile in this submarket — average credit score on applications, eviction rate, late-payment / NSF rate, and stable-employment percentage? A property-management company in the area should have these aggregated.
- How much new apartment / multifamily construction is in the pipeline within 1–3 miles? Heavy new supply (>2% of stock underway) typically softens rents 12–24 months out; light construction supports rent growth.
Investment metrics
- 1% rule
- 0.99% ✗
- Cap rate
- 6.58%
- Cash-on-cash
- 1.03%
- DSCR
- 1.05
- GRM
- 8.4
CMA / ARV
No comps found within radius.
Projected returns pro-forma
-3.0% appreciation · 0.1% rent growth · sell at horizon
- IRR
- -22.5%
- Equity multiple
- 0.25×
- Total profit
- $-55,743
- Equity at exit
- $39,479
- IRR
- -29.0%
- Equity multiple
- -0.13×
- Total profit
- $-83,664
- Equity at exit
- $22,893
Cash invested: $74,138 (down + closing). Projections, not guarantees.
Landlord ↔ Tenant lean methodology
- Overall (STATE)
- 87 Strongly Landlord-Friendly
- State Florida
- 87 Strongly Landlord-Friendly · R+3
- County
- — inherits STATE
- City
- — inherits STATE
ZIP-level market 33442
- Rents YoY
- 0.1%
- Active inventory
- 586
- Price-to-rent
- 8.4×
Monthly cashflow live
- Estimated rent
- $2,630 high interval (Pro) →
- Mortgage (P&I)
- −$1,389
- Tax from tax record
- −$69 /mo · $831/yr
- Insurance
- −$110
- Flood insurance flood zone
- −$152 /mo · $1,824/yr
- HOA
- −$446
- Vacancy / Maint / Mgmt
- −$552
- Net cashflow
- $-88
Break-even live
UW: 25.0% down · 7.5% · 30yr · 1.5% tax · 5.0% vac · 8.0% maint · 8.0% mgmt
Financing live
Cash to close
- Down payment
- $66,194
- Closing costs
- $7,943
- Reserves months
- —
- Total cash needed
- —
Loan-product check · same deal, 3 products live
Conventional
25% down · 7.5% · 30yr
- Down + closing
- —
- Monthly P&I
- —
- Monthly cashflow
- —
- DSCR
- —
- Eligible?
- —
Personal DTI + credit; lowest rate.
DSCR
20% down · 8.5% · 30yr
- Down + closing
- —
- Monthly P&I
- —
- Monthly cashflow
- —
- DSCR
- —
- Eligible?
- —
No personal income docs; deal must DSCR.
Hard money
10% down · 12.0% · 12mo
- Down + closing
- —
- Monthly P&I
- —
- Monthly cashflow
- —
- DSCR
- —
- Eligible?
- —
Short-term bridge; refi at stabilization.
Rent comps 40 comps
| Address | Beds | Baths | Sqft | Rent | $/sqft | DOM | Units | Dist |
|---|---|---|---|---|---|---|---|---|
| 2067 SW 15th St Deerfield Beach, FL | 2.0 | 2.0 | 1150 | $2,300 | $2.00 | 20d | 2 | 0.05mi |
| 2265 SW 15th St #165 Deerfield Beach, FL | 3.0 | 2.0 | 1350 | $2,400 | $1.78 | 24d | 1 | 0.07mi |
| 2297 SW 15th St #122 Deerfield Beach, FL | 2.0 | 2.0 | 1200 | $2,200 | $1.83 | 12d | 1 | 0.08mi |
| 1266 S Military Trl Deerfield Beach, FL | 1.0–2.0 | 1.0–2.0 | 1050 | $2,550 | $2.43 | 21d | 2 | 0.12mi |
| 1272 S Military Trl #313 Deerfield Beach, FL | 2.0 | 2.0 | 900 | $2,390 | $2.66 | 21d | 1 | 0.13mi |
| 2355 SW 15th St Deerfield Beach, FL | 2.0 | 2.0 | 1100 | $2,098 | $1.91 | 24d | 2 | 0.15mi |
| 1929 SW 15th St #41 Deerfield Beach, FL | 2.0 | 2.0 | 1150 | $2,400 | $2.09 | 24d | 1 | 0.18mi |
| 1244 S Military Trl #724 Deerfield Beach, FL | 2.0 | 1.5 | 916 | $1,950 | $2.13 | 13d | 1 | 0.21mi |
| 1250 S Military Trl #1612 Deerfield Beach, FL | 2.0 | 1.5 | 1035 | $2,500 | $2.42 | 5d | 1 | 0.21mi |
| 1234 S Military Trl #1811 Deerfield Beach, FL | 2.0 | 2.0 | 1099 | $2,500 | $2.27 | 24d | 1 | 0.21mi |
| 1398 SW 24th Ter Deerfield Beach, FL | 3.0 | 2.0 | 1865 | $5,000 | $2.68 | 24d | 1 | 0.22mi |
| 1230 S Military Trl #2014 Deerfield Beach, FL | 2.0 | 2.0 | 937 | $2,400 | $2.56 | 24d | 1 | 0.26mi |
| 1230 S Military Trl #2014 Deerfield Beach, FL | 2.0 | 2.0 | 937 | $2,400 | $2.56 | 16d | 1 | 0.26mi |
| 2217 Discovery Cir W Deerfield Beach, FL | 2.0 | 2.5 | 1429 | $2,400 | $1.68 | 14d | 1 | 0.36mi |
| 2246 Discovery Cir W Deerfield Beach, FL | 2.0 | 2.5 | 1300 | $2,650 | $2.04 | 24d | 1 | 0.37mi |
| 2149 Discovery Cir W Unit 1 Deerfield Beach, FL | 2.0 | 2.5 | 1300 | $2,850 | $2.19 | 21d | 1 | 0.42mi |
| 2173 Discovery Cir W Deerfield Beach, FL | 2.0 | 2.0 | 1126 | $2,950 | $2.62 | 2d | 1 | 0.45mi |
| 5161 NW 11th Ln Deerfield Beach, FL | 3.0 | 2.0 | 1486 | $2,925 | $1.97 | 24d | 1 | 0.45mi |
| 1100 S Military Trl Deerfield Beach, FL | 2.0–3.0 | 1.0–2.0 | 1119 | $2,828 | $2.53 | 24d | 2 | 0.46mi |
| 1947 Discovery Cir E Deerfield Beach, FL | 2.0 | 2.0 | 1126 | $2,450 | $2.18 | 24d | 1 | 0.47mi |
| 5140 NW 11th Dr Deerfield Beach, FL | 3.0 | 2.0 | 1324 | $3,000 | $2.27 | 13d | 1 | 0.47mi |
| 2776 SW 15th St Deerfield Beach, FL | 2.0 | 2.5 | 1236 | $2,900 | $2.35 | 24d | 1 | 0.50mi |
| 640 Cypress Club Way Unit G Pompano Beach, FL | 2.0 | 2.0 | 891 | $1,950 | $2.19 | 24d | 1 | 0.55mi |
| 2826 SW 12th St Deerfield Beach, FL | 2.0 | 2.5 | 1236 | $2,600 | $2.10 | 3d | 1 | 0.57mi |
| 671 Cypress Lake Blvd Unit D21 Deerfield Beach, FL | 3.0 | 2.0 | 974 | $2,250 | $2.31 | 11d | 1 | 0.57mi |
| 661 Cypress Lake Blvd Unit I20 Deerfield Beach, FL | 3.0 | 2.0 | 974 | $2,250 | $2.31 | 1d | 1 | 0.60mi |
| 661 Cypress Lake Blvd Unit I20 Deerfield Beach, FL | 3.0 | 2.0 | 974 | $2,300 | $2.36 | 24d | 1 | 0.60mi |
| 2903 Waterford Dr N Deerfield Beach, FL | 2.0 | 2.5 | 1236 | $2,600 | $2.10 | 18d | 1 | 0.71mi |
| 551 NW 46th St Deerfield Beach, FL | 2.0 | 2.0 | 952 | $2,485 | $2.61 | 24d | 1 | 0.75mi |
| 1280 NW 49th St Deerfield Beach, FL | 3.0 | 2.0 | 1575 | $2,700 | $1.71 | 24d | 1 | 0.76mi |
| 4503 NW 6th Ave Deerfield Beach, FL | 3.0 | 2.0 | 1148 | $2,850 | $2.48 | 24d | 1 | 0.76mi |
| 4450 Military Trl Unit 22 Pompano Beach, FL | 2.0 | 1.0 | 940 | $1,950 | $2.07 | 24d | 1 | 0.90mi |
| 4905 NE 2nd Way Pompano Beach, FL | 2.0 | 1.0 | 1100 | $2,150 | $1.95 | 24d | 1 | 0.92mi |
| 4325 NW 5th Ave Deerfield Beach, FL | 2.0 | 2.0 | 953 | $2,249 | $2.36 | 10d | 1 | 0.92mi |
| 4313 NW 6th Ave Deerfield Beach, FL | 3.0 | 2.0 | 1348 | $2,850 | $2.11 | 21d | 1 | 0.94mi |
| 4740 NE 2nd Ter Deerfield Beach, FL | 3.0 | 2.0 | 1000 | $3,250 | $3.25 | 3d | 1 | 0.97mi |
| 4740 NE 2nd Ter Deerfield Beach, FL | 3.0 | 2.0 | 1000 | $3,250 | $3.25 | 24d | 1 | 0.97mi |
| 4394 NW 9th Ave Unit 20-1A Deerfield Beach, FL | 2.0 | 2.0 | 950 | $1,700 | $1.79 | 24d | 1 | 0.99mi |
| 4354 NW 9th Ave Unit 12-3D Pompano Beach, FL | 2.0 | 2.0 | 1040 | $2,000 | $1.92 | 24d | 1 | 0.99mi |
| 4314 NW 9th Ave Deerfield Beach, FL | 1.0–2.0 | 1.5–2.0 | 992 | $1,940 | $1.95 | 14d | 2 | 0.99mi |
HOA detail condo
- Monthly dues
- $446 · $5,352/yr
- Likely covers
- water
- Assessments
- None detected in remarks — confirm with the listing agent.
Listing history 17 events
-
2026-06-18days on market $264,777 Active 82 DOM
-
2026-06-17days on market $264,777 Active 81 DOM
-
2026-06-16days on market $264,777 Active 80 DOM
-
2026-06-15days on market $264,777 Active 79 DOM
-
2026-06-13days on market $264,777 Active 77 DOM
-
2026-06-09days on market $264,777 Active 73 DOM
-
2026-06-08days on market $264,777 Active 72 DOM
-
2026-06-07days on market $264,777 Active 71 DOM
-
2026-06-04days on market $264,777 Active 68 DOM
-
2026-06-03days on market $264,777 Active 67 DOM
-
2026-06-02days on market $264,777 Active 66 DOM
-
2026-06-01days on market $264,777 Active 65 DOM
-
2026-05-31days on market $264,777 Active 64 DOM
-
2026-04-28price $264,777
-
2026-03-28$269,777 Active
-
1987-06-09soldstatus $60,000
-
1980-12-01soldstatus $70,900
ⓘ Source: listings_history table (triggers on properties + properties_extension) + one-shot
backfill from property_details.listing_events for pre-trigger history.
Tax reassessment forecast FL · Resets to sale price
- Current annual tax
- $831 · $69/mo
- Projected year-2 tax
- $2,198 · $183/mo
- Expected delta
- +$1,366/yr (+$114/mo · 164.4%)
ⓘ Screening estimate from a state-policy table — verify with the county assessor before closing.
Climate risk First Street
- Flood 4/10 Moderate FEMA zone AH · 20% chance over 30 yrs
- Wildfire 1/10 Low
- Heat 10/10 Extreme 7 d/yr ≥107°F today · 28 d/yr by 30 yrs out
- Wind 10/10 Extreme 99% chance of damaging wind over 30 yrs
- Air quality 2/10 Low 1 unhealthy d/yr today · 3 by 30 yrs out
Nearby sold comps map
Loading sold comps map…
Walkable amenities ~0.75 mi
Loading nearby amenities…
Taxation est. · year 1
- Rental income
- $31,562
- − Mortgage interest
- −$14,832
- − Property taxes
- −$831
- − Insurance
- −$3,148
- − Repairs & maintenance
- −$2,525
- − Management
- −$2,525
- − HOA
- −$5,352
- − Depreciation
- −$7,703
- Taxable loss
- −$5,354
- Est. tax savings @ 24.0%
- +$1,285
- After-tax cash flow
- $225/yr
For passive investors: Depreciation is non-cash, so a rental often shows a tax loss while cash-flowing — sheltering income. Rental losses are passive: they offset passive income freely, and up to $25,000/yr can offset ordinary (W-2) income if you actively participate and your MAGI is under $100k (phasing out to $0 by $150k); unused losses carry forward. On sale, claimed depreciation is recaptured at up to 25%, and gains may owe capital-gains tax (a 1031 exchange can defer both). Figures are a year-1 estimate at your 24.0% rate — not tax advice; consult a CPA.
Schools (NCES district)
- District
- Broward
- NCES district ID
- 1200180
- Math proficiency
- 42% ▼ -18.00%
- Reading proficiency
- 53% ▼ -5.00%
- Median HH income
- $52,139
- Composite
- 40.88/100
- National rank
- #3621
- State rank
- #46 of 73 in FL
Livability — Deerfield Beach
- Score
- 75/100
- State rank
- #250
- US rank
- #3970
Category grades
Schools grade is shown separately in the Schools card above.
Census & demographics
- Census place
- Deerfield Beach, FL
- County
- Broward County · 1,963,430 people
- City population
- 61,449
- Metro
- Miami-Fort Lauderdale-Pompano Beach, FL
- Population (ZIP)
- 31,296
- Household income
- $53,254
- Rent vs Own
- Severe rent burden
- 2169.0
Population outlook (Broward County) Hauer SSP2
- Today (2025)
- 2,207,033 people
- By 2030
- 2,360,704 · +7.0%
- By 2040
- 2,661,208 · +20.6%
- By 2050
- 2,946,698 · +33.5%
- By 2075
- 3,602,273 · +63.2%
- By 2100
- 3,970,984 · +79.9%
Race, ethnicity, and origin ACS 2023
- Neighborhood character
- Diverse neighborhood (Simpson 0.61)
- Race & ethnicity
- White 57% Hispanic / Latino 23% Two or more races 19% Black 10% Asian 2%
- Hispanic origin (detail)
- Mexican 1% Puerto Rican 4% Cuban 3%
- Common ancestry
- Estonian 7% Romanian 4% Hispanic 3%
- Foreign-born
- 34% · Canada, Jamaica, Dominican Republic
- Languages at home
- 59% English-only · Spanish 20% Other Indo-European 13% French/Haitian/Cajun 4%
Political lean MEDSL · Broward
- 2024 margin
- D (+17.0) · D 58.0% · R 41.0%
- 2008→2024 swing
- -17.8pp toward R · 2008: 34.7pp · 2024: 17.0pp
- All cycles
- 2024: D+17.0 2020: D+29.8 2016: D+35.0 2012: D+34.9 2008: D+34.7
Not yet ingested
- Civics
- —
Market trends
- HPI YoY
- ▼ -280.44%
- Current HPI
- 323.0166
- Rent YoY
- ▲ 0.10%
- Metro
- Miami-Fort Lauderdale-Pompano Beach, FL
- State GDP YoY
- ▲ 3.28%
- F500 in state
- 36
Industry mix (Fortune 500 HQ in FL)
| Industry | F500 HQs | Revenue |
|---|---|---|
| Industrial Technology | 2 | $29B |
|
||
| Insurance | 2 | $17B |
|
||
| Retail | 1 | $60B |
|
||
| Technology Distribution | 1 | $58B |
|
||
| Homebuilding | 1 | $35B |
|
||
| Technology Manufacturing | 1 | $35B |
|
||
Price history
+273.5% since first listed4 events — show timeline
- 2026-04-28 Price Changed $264,777 Beaches MLS
- 2026-03-28 Listed $269,777 Beaches MLS
- 1987-06-09 Sold (Public Records) $60,000 Public Records
- 1980-12-01 Sold (Public Records) $70,900 Public Records
Property tax history
+0.5%/yrLatest (2025): $831 · -28.3% YoY. Source: county tax records.
Cash-flow waterfall
monthlySold comps — $/sqft
last 12 mo · ≤1 miLoading sold comps…