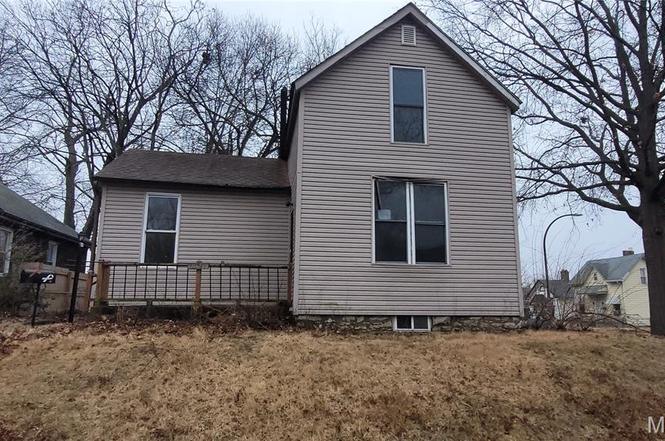
3726 Osceola St · St. Louis, MO
Flood risk 1/10 · Minimal
- FEMA flood zone
- X (unshaded)
- Chance of flooding over 30 yrs
- 0.0%
- Est. flood insurance / yr
- $473 – $860
Fire risk 1/10 · Minimal
- Est. fire insurance / yr
- $1,054 – $1,958
Heat risk 5/10 · Moderate
- Hot days now (above 108°F)
- 7 days/yr
- Hot days in 30 yrs
- 21 days/yr
Wind risk 2/10 · Minimal
- Chance of severe wind over 30 yrs
- 1.0%
Air-quality risk 3/10 · Minor
- Unhealthy air days now
- 3 days/yr
- Unhealthy air days in 30 yrs
- 4 days/yr
Risk factors via First Street. Map © Google.
Why this score? — see what drove the B- grade
The composite is a weighted blend of 9 inputs, each scored 0–100. Each bar is that input's sub-score; the figure is the points it added to the 100-point composite (weight × sub-score).
- Cash flow +30.0/30.0
- 1% rule +10.0/10.0
- DSCR +10.0/10.0
- ARV discount +7.5/15.0
- Rent growth +3.2/5.0
- Livability +2.5/5.0
- Condition / age +2.5/5.0
- Schools +1.2/10.0
- Appreciation +0.0/10.0
$64,900
🖨 Deal sheet (PDF) 📄 Offer letter ✓ Due diligence
Listing remarks
Opportunity awaits with this 3 bed, 1 bath home on a corner lot in a great location. This home has a fenced backyard and some custom landscaping and water features. The main floor has a large bedroom, living room, kitchen, full bathroom and mud room. The upstairs has 2 dormer style bedrooms with closets. Large walk-up & out basement with laundry area and separate storage room. Home needs some updates. If your offer is accepted, you agree to an offer submission technology fee of $212.00. The fee will be collected & disbursed by the settlement agent at closing. An AGENT MUST BE PRESENT FOR ALL SHOWINGS. Do not Trespass.
Key facts
- Custom landscaping
- Water features
- Fenced backyard
Tags
Neighborhood map
What this means for you Summary
Snapshot
- This is a 3-bed/1.0-bath single-family listed at $65k.
Deal economics
- At list price, monthly cash flow is $469 ($6k/yr) — positive.
- The deal already cash-flows at list — no discount required.
- Meets the 1% rule at list price ($1k rent vs $65k).
- Recommended offer: $59k (9.0% below list) — sets the bar for market timing.
- Cap rate 15.0% vs local median 5.0% in St. Louis — top-decile yield for the area; either an underpriced asset or a hidden risk that comps aren't pricing in. Stress-test before assuming the spread holds.
Location & tenants
- Location reads: area grade B — affects rentability + tenant quality, not the cash-flow math above.
- St. Louis City (urban): math 10% / reading 18% proficiency, ranked #312 of 324 in MO (top 96%) — low school quality limits family demand, transient renter base, plan for 1-2y turnover; 80% free/reduced lunch — lower-income household profile, screen leases tightly.
- Zoned schools: Woodward Elem. (math 2% / reading 8%, grade F, #1,072 of 1,115 statewide, top 98%, 239 students, 99% FRL); Gateway Middle (math 0% / reading 8%, grade F, #389 of 391 statewide, top 100%, 506 students, 99% FRL); Roosevelt High (math 2% / reading 8%, grade F, #517 of 521 statewide, top 100%, 460 students, 99% FRL) — zoned schools average 99% FRL vs 80% district-wide (19 pts higher); higher-poverty schools than district average — tighter screening recommended.
- Market conditions: Rents rising (+2.6%/yr); 261 active listings in the ZIP; 40 comparable units currently listed for rent nearby; rentals at typical pace (median 26d on market — plan ~3-4 weeks tenant-placement turnaround); 45% of comp listings sitting > 30 days — soft ceiling on asking rent; 294 units permitted in St. Louis city in 2024 (227 in 5+ unit buildings).
Forward outlook
- Local home prices are declining (-3.0%/yr); year-one equity from $449 of loan paydown is wiped out by about $2k of value loss. Plan a longer hold.
- St. Louis County population projected to shrink 6% by 2050 — rents likely to lag national; underwrite the cash flow, not the appreciation.
- At projected returns (-3.0% appreciation + 2.6% rent growth), your $18k cash investment doubles in ~4 years — after that, you're playing with house money.
Negotiation context
- It's been on market 114 days — a 9% lower offer ($59k) is reasonable based on typical stale-listing flexibility.
Risks & watch-outs
- Watch-outs: built in 1896 — expect roof / HVAC / electrical / plumbing capex.
- Climate carrying-cost: extreme-heat days projected 7→21/yr by 2055 (HVAC capex compounding) — expect insurance premiums to compound above CPI over the hold.
Questions for the listing agent
- It's been on market 114 days. Have you received any prior offers? Is the seller open to a 9% concession, seller financing, or rate buy-down credit?
- Built in 1896 — when were the roof, HVAC, electrical panel, plumbing, and water heater last replaced?
- Why hasn't it sold? Are there any deal-killer items the seller is aware of (foundation, flood, title, zoning, code violations)?
- Is there a deadline driving the sale (1031 exchange, divorce, estate, relocation)? That informs how much negotiation room exists.
- What's the average days-on-market for RENTAL listings here right now (not sales)? A rising rental-DOM trend means longer vacancies and softer asking-rent achievability than the comps imply.
- What's the recent tenant-quality profile in this submarket — average credit score on applications, eviction rate, late-payment / NSF rate, and stable-employment percentage? A property-management company in the area should have these aggregated.
- How much new for-sale + rental construction is in the pipeline within 1–3 miles? Heavy new supply typically softens prices + rents 12–24 months out; constrained supply supports both.
Investment metrics
- 1% rule
- 1.79% ✓
- Cap rate
- 14.96%
- Cash-on-cash
- 30.94%
- DSCR
- 2.38
- GRM
- 4.7
CMA / ARV
- ARV (on-the-fly)
- $166,464
- Comps found
- 12
Show comp detail 12 sales within ~0.75 mi
| Address | Dist | Beds/Ba | Sqft | Sold | Price | $/sf | Match |
|---|---|---|---|---|---|---|---|
| 4410 S Spring Ave | 0.14mi | 3/1.0 | 1,101 (-5%) | 0mo | $169,900 | $154 | 86 |
| 4471 S Spring Ave | 0.21mi | 3/2.0 | 1,152 (-0%) | 1mo | $135,000 | $117 | 85 |
| 3628 Neosho St | 0.26mi | 3/2.0 | 1,158 (+0%) | 1mo | $189,900 | $164 | 82 |
| 4659 Tennessee Ave | 0.36mi | 2/1.0 (-1) | 1,215 (+5%) | 1mo | $109,000 | $90 | 69 |
| 3855 Bingham Ave | 0.21mi | 2/1.5 (-1) | 1,050 (-9%) | 1mo | $159,900 | $152 | 67 |
| 3940 Randall St | 0.54mi | 3/1.0 | 1,008 (-13%) | 1mo | $165,000 | $164 | 53 |
| 5007 Alabama Ave | 0.71mi | 2/1.0 (-1) | 1,096 (-5%) | 1mo | $157,500 | $144 | 53 |
| 3724 Bamberger Ave | 0.65mi | 3/2.0 | 1,069 (-8%) | 1mo | $110,000 | $103 | 52 |
| 3718 S Spring Ave | 0.69mi | 3/2.0 | 1,071 (-7%) | 1mo | $110,000 | $103 | 51 |
| 3139 Mount Pleasant St | 0.65mi | 3/2.0 | 1,270 (+10%) | 1mo | $175,000 | $138 | 49 |
| 5015 Gerritt Ave | 0.58mi | 2/1.0 (-1) | 1,293 (+12%) | 1mo | $165,000 | $128 | 48 |
| 4533 Ray Ave | 0.60mi | 3/1.5 | 1,000 (-14%) | 1mo | $229,900 | $230 | 47 |
Match score weights: distance 35% · size 25% · config 20% · recency 20%. Top-matched comps best support the ARV.
Projected returns pro-forma
-3.0% appreciation · 2.62% rent growth · sell at horizon
- IRR
- 25.3%
- Equity multiple
- 2.04×
- Total profit
- $18,904
- Equity at exit
- $9,677
- IRR
- 32.8%
- Equity multiple
- 3.93×
- Total profit
- $53,162
- Equity at exit
- $5,611
Cash invested: $18,172 (down + closing). Projections, not guarantees.
Landlord ↔ Tenant lean methodology
- Overall (STATE)
- 81 Strongly Landlord-Friendly
- State Missouri
- 81 Strongly Landlord-Friendly · R+10
- County
- — inherits STATE
- City
- — inherits STATE
ZIP-level market 63116
- Rents YoY
- 2.6%
- Active inventory
- 261
- Price-to-rent
- 4.7×
Monthly cashflow live
- Estimated rent
- $1,163 high interval (Pro) →
- Mortgage (P&I)
- −$340
- Tax from tax record
- −$83 /mo · $991/yr
- Insurance
- −$27
- HOA
- −$0
- Vacancy / Maint / Mgmt
- −$244
- Net cashflow
- $469
Break-even live
Sensitivity live
| Price | -10% $505 | -5% $487 | +0% $469 | +5% $450 | +10% $432 |
|---|---|---|---|---|---|
| Rent | -10% $377 | -5% $423 | +0% $469 | +5% $515 | +10% $560 |
| Rate | -1.0pp $501 | -0.5pp $485 | base $469 | +0.5pp $452 | +1.0pp $435 |
UW: 25.0% down · 7.5% · 30yr · 1.5% tax · 5.0% vac · 8.0% maint · 8.0% mgmt
Financing live
Cash to close
- Down payment
- $16,225
- Closing costs
- $1,947
- Reserves months
- —
- Total cash needed
- —
Loan-product check · same deal, 3 products live
Conventional
25% down · 7.5% · 30yr
- Down + closing
- —
- Monthly P&I
- —
- Monthly cashflow
- —
- DSCR
- —
- Eligible?
- —
Personal DTI + credit; lowest rate.
DSCR
20% down · 8.5% · 30yr
- Down + closing
- —
- Monthly P&I
- —
- Monthly cashflow
- —
- DSCR
- —
- Eligible?
- —
No personal income docs; deal must DSCR.
Hard money
10% down · 12.0% · 12mo
- Down + closing
- —
- Monthly P&I
- —
- Monthly cashflow
- —
- DSCR
- —
- Eligible?
- —
Short-term bridge; refi at stabilization.
Rent comps 40 comps
| Address | Beds | Baths | Sqft | Rent | $/sqft | DOM | Units | Dist |
|---|---|---|---|---|---|---|---|---|
| 4455 S 38th St Saint Louis, MO | 3.0 | 1.0 | 1000 | $1,000 | $1.00 | 25d | 1 | 0.14mi |
| 4451 Grace Ave Saint Louis, MO | 2.0 | 1.0 | 700 | $750 | $1.07 | 19d | 1 | 0.14mi |
| 3702 Meramec St Unit 1e St. Louis, MO | 2.0 | 1.0 | 725 | $950 | $1.31 | 9d | 1 | 0.18mi |
| 3702 Meramec St Unit 1e St. Louis, MO | 2.0 | 1.0 | 725 | $950 | $1.31 | 0d | 1 | 0.18mi |
| 4416 S Grand Blvd Saint Louis, MO | 3.0 | 1.0 | 963 | $1,550 | $1.61 | 25d | 1 | 0.21mi |
| 4217 S Grand Blvd Unit 1 St. Louis, MO | 3.0 | 1.0 | 1250 | $1,400 | $1.12 | 6d | 1 | 0.23mi |
| 3635 Marceline Ter Unit 2ND St. Louis, MO | 3.0 | 1.0 | 1250 | $1,275 | $1.02 | 45d | 1 | 0.28mi |
| 4053 Giles Ave Unit A St. Louis, MO | 2.0 | 1.0 | 1082 | $995 | $0.92 | 12d | 1 | 0.28mi |
| 4005 S Grand Blvd Saint Louis, MO | 4.0 | 1.0 | 1323 | $1,150 | $0.87 | 18d | 1 | 0.38mi |
| 4637 Louisiana Ave Saint Louis, MO | 2.0 | 1.0 | 1104 | $1,175 | $1.06 | 14d | 1 | 0.38mi |
| 3647 Delor St Unit 3647-1F St. Louis, MO | 2.0 | 1.5 | 900 | $1,115 | $1.24 | 45d | 1 | 0.42mi |
| 3707a Delor St Unit 3707-2F St. Louis, MO | 2.0 | 1.5 | 900 | $1,115 | $1.24 | 45d | 1 | 0.42mi |
| 3723 Delor St Unit 3723-1F St. Louis, MO | 2.0 | 1.5 | 900 | $1,225 | $1.36 | 45d | 1 | 0.43mi |
| 3719 Delor St Unit 3719-1F St. Louis, MO | 2.0 | 1.5 | 900 | $1,115 | $1.24 | 45d | 1 | 0.43mi |
| 3761 Delor St St. Louis, MO | 2.0 | 1.5 | 900 | $1,285 | $1.43 | 3d | 2 | 0.43mi |
| 3711 Delor St Unit 3711-1F St. Louis, MO | 2.0 | 1.5 | 900 | $1,225 | $1.36 | 25d | 1 | 0.43mi |
| 3765 Delor St Unit 37651-F St. Louis, MO | 2.0 | 1.5 | 900 | $1,225 | $1.36 | 25d | 1 | 0.43mi |
| 3709 Delor St Unit 3709-1F St. Louis, MO | 2.0 | 1.5 | 900 | $1,225 | $1.36 | 45d | 1 | 0.43mi |
| 3661 Delor St Unit 3661-2F St. Louis, MO | 2.0 | 1.5 | 900 | $1,115 | $1.24 | 45d | 1 | 0.43mi |
| 3661 Delor St Unit 3661-1F St. Louis, MO | 2.0 | 1.5 | 900 | $1,225 | $1.36 | 45d | 1 | 0.43mi |
| 3737 Delor St Unit 3737-1F St. Louis, MO | 2.0 | 1.5 | 900 | $1,115 | $1.24 | 25d | 1 | 0.44mi |
| 3729 Delor St Unit 37292-F St. Louis, MO | 2.0 | 1.5 | 900 | $1,115 | $1.24 | 25d | 1 | 0.44mi |
| 3737 Delor St Unit 3737-2F St. Louis, MO | 2.0 | 1.5 | 900 | $1,115 | $1.24 | 45d | 1 | 0.44mi |
| 3717 Delor St Unit 37172-F St. Louis, MO | 2.0 | 1.5 | 900 | $1,115 | $1.24 | 25d | 1 | 0.45mi |
| 3514 Alberta St Unit 1W St. Louis, MO | 2.0 | 1.0 | 800 | $800 | $1.00 | 45d | 1 | 0.46mi |
| 3705 Delor St Unit 3705-1F St. Louis, MO | 2.0 | 1.5 | 900 | $1,225 | $1.36 | 45d | 1 | 0.46mi |
| 3659 Delor St Unit 3659-1F St. Louis, MO | 2.0 | 1.5 | 900 | $1,115 | $1.24 | 45d | 1 | 0.46mi |
| 3860 Bamberger Ave Unit 1N St. Louis, MO | 2.0 | 1.0 | 850 | $799 | $0.94 | 12d | 1 | 0.49mi |
| 3860 Bamberger Ave Unit 3N St. Louis, MO | 2.0 | 1.0 | 700 | $799 | $1.14 | 19d | 1 | 0.49mi |
| 4716 Louisiana Ave Unit 2F St. Louis, MO | 2.0 | 1.0 | 1200 | $995 | $0.83 | 45d | 1 | 0.50mi |
| 4617 Virginia Ave St. Louis, MO | 2.0 | 1.0 | 700 | $825 | $1.18 | 25d | 1 | 0.56mi |
| 5033 Ulena Ave Saint Louis, MO | 2.0 | 1.0 | 960 | $1,575 | $1.64 | 45d | 1 | 0.57mi |
| 3428 Dunnica Ave Saint Louis, MO | 2.0 | 1.0 | 1050 | $995 | $0.95 | 45d | 1 | 0.61mi |
| 5028 Louisiana Ave Saint Louis, MO | 2.0 | 1.0 | 1200 | $1,100 | $0.92 | 45d | 1 | 0.62mi |
| 4127 Minnesota Ave Unit 2F St. Louis, MO | 3.0 | 1.0 | 1155 | $1,200 | $1.04 | 45d | 1 | 0.62mi |
| 4127 Minnesota Ave Unit 1F St. Louis, MO | 3.0 | 1.0 | 1155 | $1,200 | $1.04 | 45d | 1 | 0.62mi |
| 5217 S Grand Blvd Saint Louis, MO | 2.0 | 1.0 | 870 | $1,125 | $1.29 | 16d | 1 | 0.64mi |
| 3324 Liberty St Saint Louis, MO | 2.0 | 1.0 | 1100 | $950 | $0.86 | 18d | 1 | 0.65mi |
| 4130 Minnesota Ave Saint Louis, MO | 2.0 | 1.0 | 1234 | $975 | $0.79 | 16d | 1 | 0.65mi |
| 4126 Minnesota Ave Unit 2f St. Louis, MO | 2.0 | 1.0 | 1150 | $1,028 | $0.89 | 25d | 1 | 0.65mi |
Listing history 10 events
-
2026-06-08statusdays on market $64,900 Pending 114 DOM
-
2026-06-05days on market $64,900 Active 113 DOM
-
2026-06-03days on market $64,900 Active 112 DOM
-
2026-06-02days on market $64,900 Active 111 DOM
-
2026-06-01days on market $64,900 Active 110 DOM
-
2026-05-31days on market $64,900 Active 109 DOM
-
2026-04-24status Pending
-
2026-03-28price $64,900
-
2026-01-09$74,900 Active
-
2026-01-09historical $74,900
ⓘ Source: listings_history table (triggers on properties + properties_extension) + one-shot
backfill from property_details.listing_events for pre-trigger history.
Tax reassessment forecast MO · Resets to sale price
- Current annual tax
- $991 · $83/mo
- Projected year-2 tax
- $991 · $83/mo
- Expected delta
- $0/yr ($0/mo · 0.0%)
ⓘ Screening estimate from a state-policy table — verify with the county assessor before closing.
Climate risk First Street
- Flood 1/10 Low FEMA zone X (unshaded) · 0% chance over 30 yrs
- Wildfire 1/10 Low
- Heat 5/10 Major 7 d/yr ≥108°F today · 21 d/yr by 30 yrs out
- Wind 2/10 Low 100% chance of damaging wind over 30 yrs
- Air quality 3/10 Moderate 3 unhealthy d/yr today · 4 by 30 yrs out
Nearby sold comps map
Loading sold comps map…
Walkable amenities ~0.75 mi
Loading nearby amenities…
Taxation est. · year 1
- Rental income
- $13,953
- − Mortgage interest
- −$3,635
- − Property taxes
- −$991
- − Insurance
- −$324
- − Repairs & maintenance
- −$1,116
- − Management
- −$1,116
- − Depreciation
- −$1,888
- Taxable income
- $4,881
- Est. tax owed @ 24.0%
- −$1,172
- After-tax cash flow
- $4,452/yr
For passive investors: Depreciation is non-cash, so a rental often shows a tax loss while cash-flowing — sheltering income. Rental losses are passive: they offset passive income freely, and up to $25,000/yr can offset ordinary (W-2) income if you actively participate and your MAGI is under $100k (phasing out to $0 by $150k); unused losses carry forward. On sale, claimed depreciation is recaptured at up to 25%, and gains may owe capital-gains tax (a 1031 exchange can defer both). Figures are a year-1 estimate at your 24.0% rate — not tax advice; consult a CPA.
Schools (NCES district)
- District
- St. Louis City
- NCES district ID
- 2929280
- Math proficiency
- 10% ▼ -6.00%
- Reading proficiency
- 18% ▼ -3.00%
- Median HH income
- $35,685
- Composite
- 11.54/100
- National rank
- #9699
- State rank
- #312 of 324 in MO
Livability — St. Louis
No livability data for this city. (Only ~50 U.S. cities are tracked.)
Census & demographics
- Census place
- St. Louis, MO
- County
- Saint Louis City · 254,015 people
- City population
- 283,259
- Metro
- St. Louis, MO-IL
- Population (ZIP)
- 42,170
- Household income
- $61,433
- Rent vs Own
- Severe rent burden
- 1923.0
Population outlook (St. Louis County) Hauer SSP2
- Today (2025)
- 315,737 people
- By 2030
- 313,865 · -0.6%
- By 2040
- 305,439 · -3.3%
- By 2050
- 296,529 · -6.1%
- By 2075
- 271,028 · -14.2%
- By 2100
- 255,359 · -19.1%
Race, ethnicity, and origin ACS 2023
- Neighborhood character
- Diverse neighborhood (Simpson 0.63)
- Race & ethnicity
- White 54% Black 27% Hispanic / Latino 10% Two or more races 8% Asian 5%
- Hispanic origin (detail)
- Mexican 7%
- Common ancestry
- Lithuanian 4% Romanian 2% Italian 2%
- Foreign-born
- 11% · Canada, Vietnam, Philippines
- Languages at home
- 85% English-only · Spanish 6% Vietnamese 2% Arabic 2%
Political lean MEDSL · St. Louis
- 2024 margin
- Solid D (+64.7) · D 81.4% · R 16.7% · Other 2.0%
- 2008→2024 swing
- -3.5pp toward R · 2008: 68.2pp · 2024: 64.7pp
- All cycles
- 2024: D+64.7 2020: D+66.2 2016: D+63.7 2012: D+66.6 2008: D+68.2
Not yet ingested
- Civics
- —
Market trends
- HPI YoY
- ▼ -271.19%
- Current HPI
- 215.7108
- Rent YoY
- ▲ 2.62%
- Metro
- St. Louis, MO-IL
- State GDP YoY
- ▲ 1.84%
- F500 in state
- 20
Industry mix (Fortune 500 HQ in MO)
| Industry | F500 HQs | Revenue |
|---|---|---|
| Healthcare | 1 | $163B |
|
||
| Insurance | 1 | $21B |
|
||
| Industrial Technology | 1 | $17B |
|
||
| Retail | 1 | $16B |
|
||
| Industrial Distribution | 1 | $10B |
|
||
| Utilities | 1 | $9B |
|
||
Price history
-13.4% since first listed4 events — show timeline
- 2026-04-24 Pending — MARIS as Distributed by MLS Grid
- 2026-03-28 Price Changed $64,900 MARIS as Distributed by MLS Grid
- 2026-01-09 Listed $74,900 MARIS as Distributed by MLS Grid
- 2026-01-09 Coming Soon $74,900 MARIS as Distributed by MLS Grid
Property tax history
+4.7%/yrLatest (2024): $991 · +5.0% YoY. Source: county tax records.
Cash-flow waterfall
monthlySold comps — $/sqft
last 12 mo · ≤1 miLoading sold comps…