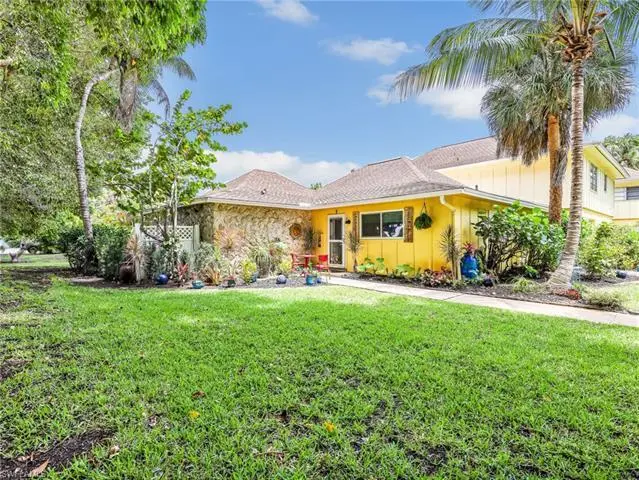
1201 Solana Rd #7 · Naples, FL
Flood risk 5/10 · Moderate
- FEMA flood zone
- AH
- Chance of flooding over 30 yrs
- 0.23%
- Est. flood insurance / yr
- $1,142 – $2,507
Fire risk 1/10 · Minimal
- Est. fire insurance / yr
- $947 – $1,759
Heat risk 10/10 · Severe
- Hot days now (above 107°F)
- 7 days/yr
- Hot days in 30 yrs
- 29 days/yr
Wind risk 10/10 · Severe
- Chance of severe wind over 30 yrs
- 99.0%
Air-quality risk 2/10 · Minimal
- Unhealthy air days now
- 2 days/yr
- Unhealthy air days in 30 yrs
- 2 days/yr
Risk factors via First Street. Map © Google.
Why this score? — see what drove the B grade
The composite is a weighted blend of 9 inputs, each scored 0–100. Each bar is that input's sub-score; the figure is the points it added to the 100-point composite (weight × sub-score).
- Cash flow +30.0/30.0
- 1% rule +10.0/10.0
- DSCR +10.0/10.0
- ARV discount +7.5/15.0
- Rent growth +5.0/5.0
- Schools +5.0/10.0
- Livability +4.0/5.0
- Condition / age +2.5/5.0
- Appreciation +0.0/10.0
$377,700
🖨 Deal sheet (PDF) 📄 Offer letter ✓ Due diligence
Listing remarks MLS
Lovely 3 bedroom, 2 bath condo located within a mile of Park Shore Beaches. Buyer to verify all!
Key facts
- Spacious floor plan
- Single story layout
- $613 HOA
Tags
Property features AI
Finance
- Other: Property type: Residential; 18 units in the complex; 4 units in the building; 1 unit per floor; 1 total floor; Restrictions: Architectural, Deeded, No Commercial, No RV
- Financial info: Details not provided
- HOA & community: Mandatory HOA; Quarterly condo fee of $1,840; Total annual recurring fees $7,360; One-time fees $100; HOA covers insurance, irrigation water, lawn/land maintenance, legal/accounting, exterior pest control, sewer, street maintenance, trash removal, and water; Professional management; Sidewalks in community; Non-gated community
Exterior
- Parking: Details not provided
- Security: Impact-resistant windows; Impact-resistant doors
- Utilities: Central water; Central sewer; Cable available
- Home design: Residential low-rise (1–3 stories); Zero lot line; Rear exposure facing west; Located in the Solana Oaks development
- Construction: Built in 1978; Wood frame construction; Stucco exterior; Shingle roof
- Exterior features: Automatic sprinkler system; Landscaped area view; Reclaimed irrigation
Interior
- Kitchen: Pantry; Dishwasher; Microwave; Range; Self-cleaning oven; Refrigerator/Freezer
- Bedrooms: 3 bedrooms
- Flooring: Laminate; Tile
- Bathrooms: 2 full bathrooms; Master bath with shower only
- Heating & cooling: Central electric heat; Central electric cooling
- Interior features: Cable prewire; Pantry; Window coverings; Split-bedroom floor plan; Screened lanai/porch; Guest room and guest bath; Laundry in residence
- Laundry & utility: Washer; Dryer
Neighborhood map
What this means for you Summary
Snapshot
- This is a 3-bed/2.0-bath condo listed at $378k.
Deal economics
- At list price, monthly cash flow is $2k ($21k/yr) — positive.
- The deal already cash-flows at list — no discount required.
- Meets the 1% rule at list price ($6k rent vs $378k).
- Recommended offer: $372k (1.5% below list) — sets the bar for market timing.
Location & tenants
- Location reads 80/100 on livability (#126 in FL, #1,903 nationally) — a professional / high-income tenant draw. Strengths: crime A+, amenities A+, employment A+; Watch: commute D+, cost of living F.
- Collier (suburban): math 60% / reading 56% proficiency, ranked #16 of 73 in FL (top 22%) — acceptable for families but not a draw, mixed tenant base, ~2y average lease.
- Market conditions: Rents rising fast (+14.6%/yr); 480 active listings in the ZIP; 40 comparable units currently listed for rent nearby; rentals at typical pace (median 25d on market — plan ~3-4 weeks tenant-placement turnaround); high-income renter base; 3,520 units permitted in Collier County in 2024 (959 in 5+ unit buildings).
- At $6,202/mo this rent would consume 64% of the median local household income ($117k/yr) (locally 311% of renters already pay >50% of income on rent) — very limited rent-growth headroom before tenants either downsize or default.
Forward outlook
- Local home prices are declining (-3.0%/yr); year-one equity from $3k of loan paydown is wiped out by about $11k of value loss. Plan a longer hold.
- Collier County population projected at +30% by 2050 — long-run rental-demand tailwind backs the buy-and-hold thesis.
- At projected returns (-3.0% appreciation + 8.0% rent growth), your $106k cash investment doubles in ~5 years — after that, you're playing with house money.
Negotiation context
- It's been on market 25 days — a 2% lower offer ($372k) is reasonable based on typical stale-listing flexibility.
- 2 sale attempts since 16y ago with the ask held roughly flat each time — persistent listings suggest the price (not the market) is what's stuck; bring a comps-based counter.
- Current owner paid $91k; list at $378k implies a 313% gain — meaningful room to come down on a strong offer.
Risks & watch-outs
- Watch-outs: flood insurance adds $152/mo.
- Climate carrying-cost: in FEMA flood zone AH (mandatory federal flood insurance); severe wind risk, 99% chance of damaging wind over 30y; extreme-heat days projected 7→29/yr by 2055 (HVAC capex compounding) — expect insurance premiums to compound above CPI over the hold.
Questions for the listing agent
- Built in 1978 — when were the roof, HVAC, electrical panel, plumbing, and water heater last replaced?
- What's the actual annual flood-insurance premium (NFIP or private), and is the property in a SFHA with mandatory coverage?
- What does the HOA fee cover, when was the last increase, and are there any pending special assessments or reserve-fund shortfalls?
- Any open or pending special assessments — roof, HVAC, plumbing, elevator, façade? What's the per-unit balance and payoff schedule, and is the seller paying it off at close or rolling it to the buyer?
- Is there a deadline driving the sale (1031 exchange, divorce, estate, relocation)? That informs how much negotiation room exists.
- Schools are B-rated — typically a magnet for longer-tenancy family renters. What's the average tenant stay here, and is there a school-zone premium baked into asking?
- What's the average days-on-market for RENTAL listings here right now (not sales)? A rising rental-DOM trend means longer vacancies and softer asking-rent achievability than the comps imply.
- What's the recent tenant-quality profile in this submarket — average credit score on applications, eviction rate, late-payment / NSF rate, and stable-employment percentage? A property-management company in the area should have these aggregated.
- How much new apartment / multifamily construction is in the pipeline within 1–3 miles? Heavy new supply (>2% of stock underway) typically softens rents 12–24 months out; light construction supports rent growth.
Investment metrics
- 1% rule
- 1.64% ✓
- Cap rate
- 12.36%
- Cash-on-cash
- 21.66%
- DSCR
- 1.96
- GRM
- 5.1
CMA / ARV
No comps found within radius.
Projected returns pro-forma
-3.0% appreciation · 8.0% rent growth · sell at horizon
- IRR
- 18.3%
- Equity multiple
- 1.79×
- Total profit
- $83,900
- Equity at exit
- $56,316
- IRR
- 30.4%
- Equity multiple
- 4.48×
- Total profit
- $368,046
- Equity at exit
- $32,657
Cash invested: $105,756 (down + closing). Projections, not guarantees.
Landlord ↔ Tenant lean methodology
- Overall (STATE)
- 87 Strongly Landlord-Friendly
- State Florida
- 87 Strongly Landlord-Friendly · R+3
- County
- — inherits STATE
- City
- — inherits STATE
ZIP-level market 34103
- Rents YoY
- 14.6%
- Active inventory
- 480
- Price-to-rent
- 5.1×
Monthly cashflow live
- Estimated rent
- $6,202 medium interval (Pro) →
- Mortgage (P&I)
- −$1,981
- Tax from tax record
- −$240 /mo · $2,875/yr
- Insurance
- −$157
- Flood insurance flood zone
- −$152 /mo · $1,824/yr
- HOA
- −$613
- Vacancy / Maint / Mgmt
- −$1,302
- Net cashflow
- $1,757
Break-even live
Sensitivity live
| Price | -10% $1,971 | -5% $1,864 | +0% $1,757 | +5% $1,650 | +10% $1,543 |
|---|---|---|---|---|---|
| Rent | -10% $1,267 | -5% $1,512 | +0% $1,757 | +5% $2,002 | +10% $2,247 |
| Rate | -1.0pp $1,947 | -0.5pp $1,853 | base $1,757 | +0.5pp $1,659 | +1.0pp $1,560 |
UW: 25.0% down · 7.5% · 30yr · 1.5% tax · 5.0% vac · 8.0% maint · 8.0% mgmt
Financing live
Cash to close
- Down payment
- $94,425
- Closing costs
- $11,331
- Reserves months
- —
- Total cash needed
- —
Loan-product check · same deal, 3 products live
Conventional
25% down · 7.5% · 30yr
- Down + closing
- —
- Monthly P&I
- —
- Monthly cashflow
- —
- DSCR
- —
- Eligible?
- —
Personal DTI + credit; lowest rate.
DSCR
20% down · 8.5% · 30yr
- Down + closing
- —
- Monthly P&I
- —
- Monthly cashflow
- —
- DSCR
- —
- Eligible?
- —
No personal income docs; deal must DSCR.
Hard money
10% down · 12.0% · 12mo
- Down + closing
- —
- Monthly P&I
- —
- Monthly cashflow
- —
- DSCR
- —
- Eligible?
- —
Short-term bridge; refi at stabilization.
Rent comps 40 comps
| Address | Beds | Baths | Sqft | Rent | $/sqft | DOM | Units | Dist |
|---|---|---|---|---|---|---|---|---|
| 1240 Shady Rest Ln #102 Naples, FL | 3.0 | 2.0 | 1619 | $6,000 | $3.71 | 15d | 1 | 0.09mi |
| 1082 Capri Dr Naples, FL | 3.0 | 2.0 | 1500 | $9,000 | $6.00 | 24d | 1 | 0.29mi |
| 4082 Belair Ln #11 Naples, FL | 3.0 | 2.0 | 1600 | $6,000 | $3.75 | 24d | 1 | 0.32mi |
| 4092 Belair Ln #15 Naples, FL | 3.0 | 3.0 | 1500 | $6,200 | $4.13 | 24d | 1 | 0.34mi |
| 3930 Belair Ln Naples, FL | 2.0 | 2.0 | 1300 | $6,000 | $4.62 | 24d | 1 | 0.36mi |
| 4523 Fluvia Ave Naples, FL | 2.0 | 1.0 | 1050 | $5,500 | $5.24 | 24d | 1 | 0.36mi |
| 4525 Fluvia Ave Naples, FL | 2.0 | 1.0 | 1050 | $5,500 | $5.24 | 24d | 1 | 0.36mi |
| 1097 Frank Whiteman Blvd Naples, FL | 4.0 | 3.0 | 1590 | $10,900 | $6.86 | 24d | 1 | 0.41mi |
| 723 Willowhead Dr Naples, FL | 3.0 | 3.0 | 1776 | $18,000 | $10.14 | 24d | 1 | 0.53mi |
| 4200 Belair Ln Naples, FL | 2.0–3.0 | 2.0 | 1406 | $9,000 | $6.40 | 24d | 5 | 0.53mi |
| 788 Park Shore Dr Naples, FL | 1.0–2.0 | 1.5–2.0 | 931 | $5,500 | $5.90 | 15d | 3 | 0.55mi |
| 4300 Belair Ln Naples, FL | 2.0 | 2.0 | 1200 | $6,750 | $5.62 | 15d | 2 | 0.60mi |
| 555 Park Shore Dr Unit B410 Naples, FL | 2.0 | 2.0 | 1200 | $6,000 | $5.00 | 22d | 1 | 0.62mi |
| 4180 Crayton Rd Unit E7 Naples, FL | 3.0 | 2.0 | 1600 | $8,900 | $5.56 | 24d | 1 | 0.62mi |
| 1400 Pompei Ln Naples, FL | 2.0 | 2.0 | 1012 | $1,888 | $1.86 | 24d | 2 | 0.74mi |
| 1400 Pompei Ln Unit S-21 Naples, FL | 2.0 | 2.0 | 1025 | $3,000 | $2.93 | 24d | 1 | 0.75mi |
| 1400 Pompei Ln Unit O-21 Naples, FL | 2.0 | 2.0 | 1025 | $2,200 | $2.15 | 24d | 1 | 0.75mi |
| 656 Binnacle Dr Naples, FL | 3.0 | 2.0 | 1808 | $10,000 | $5.53 | 24d | 1 | 0.75mi |
| 355 Park Shore Dr Unit 1-114 Naples, FL | 2.0 | 2.0 | 1574 | $13,000 | $8.26 | 24d | 1 | 0.77mi |
| 3200 Binnacle Dr Unit D3 Naples, FL | 2.0 | 2.0 | 1180 | $9,000 | $7.63 | 22d | 1 | 0.82mi |
| 1265 Pompei Ln Naples, FL | 3.0 | 2.0 | 1650 | $3,495 | $2.12 | 15d | 1 | 0.82mi |
| 45 High Point Cir S #303 Naples, FL | 2.0 | 2.0 | 1015 | $5,500 | $5.42 | 24d | 1 | 0.83mi |
| 250 Park Shore Dr #803 Naples, FL | 3.0 | 2.0 | 1690 | $15,000 | $8.88 | 24d | 1 | 0.83mi |
| 3105 Riviera Dr Unit A201 Naples, FL | 2.0 | 2.0 | 1625 | $8,000 | $4.92 | 24d | 1 | 0.91mi |
| 3030 Binnacle Dr #201 Naples, FL | 2.0 | 2.0 | 1092 | $5,000 | $4.58 | 24d | 1 | 0.99mi |
| 4530 Gulf Shore Blvd N Unit 2-122 Naples, FL | 3.0 | 2.5 | 1786 | $15,000 | $8.40 | 24d | 1 | 1.04mi |
| 4560 Gulf Shore Blvd N Unit 3-213 Naples, FL | 2.0 | 2.0 | 1321 | $8,500 | $6.43 | 24d | 1 | 1.06mi |
| 4255 Gulf Shore Blvd N #1403 Naples, FL | 2.0 | 2.0 | 1536 | $12,500 | $8.14 | 24d | 1 | 1.07mi |
| 820 Ketch Dr #2 Naples, FL | 2.0 | 2.0 | 1100 | $5,700 | $5.18 | 24d | 1 | 1.07mi |
| 820 Ketch Dr #3 Naples, FL | 2.0 | 2.0 | 1100 | $5,500 | $5.00 | 24d | 1 | 1.07mi |
| 4041 Gulf Shore Blvd N #105 Naples, FL | 2.0 | 2.0 | 1735 | $6,900 | $3.98 | 24d | 1 | 1.09mi |
| 4041 Gulf Shore Blvd N #305 Naples, FL | 2.0 | 2.0 | 1735 | $12,000 | $6.92 | 24d | 1 | 1.09mi |
| 4041 Gulf Shore Blvd N #1505 Naples, FL | 2.0 | 2.0 | 1735 | $18,000 | $10.37 | 24d | 1 | 1.09mi |
| 4041 Gulf Shore Blvd N #1705 Naples, FL | 2.0 | 2.0 | 1850 | $18,500 | $10.00 | 24d | 1 | 1.09mi |
| 3500 Gulf Shore Blvd N Naples, FL | 2.0 | 2.0 | 1258 | $7,650 | $6.08 | 24d | 2 | 1.13mi |
| 1085 Forest Lakes Dr Unit 8106 Naples, FL | 2.0 | 2.0 | 1000 | $1,900 | $1.90 | 15d | 1 | 1.14mi |
| 1085 Forest Lakes Dr Unit 8202 Naples, FL | 2.0 | 2.0 | 1086 | $2,800 | $2.58 | 15d | 1 | 1.14mi |
| 4551 Gulf Shore Blvd N #306 Naples, FL | 2.0 | 2.0 | 1600 | $7,000 | $4.38 | 24d | 1 | 1.16mi |
| 4551 Gulf Shore Blvd N #301 Naples, FL | 2.0 | 2.0 | 1792 | $11,900 | $6.64 | 24d | 1 | 1.16mi |
| 4551 Gulf Shore Blvd N #1500 Naples, FL | 2.0 | 2.0 | 1671 | $15,000 | $8.98 | 24d | 1 | 1.16mi |
HOA detail condo
- Monthly dues
- $613 · $7,356/yr
- Assessments
- None detected in remarks — confirm with the listing agent.
Listing history 18 events
-
2026-06-21days on market $377,700 Active 25 DOM
-
2026-06-18days on market $377,700 Active 22 DOM
-
2026-06-17days on market $377,700 Active 21 DOM
-
2026-06-16days on market $377,700 Active 20 DOM
-
2026-06-15days on market $377,700 Active 19 DOM
-
2026-06-14days on market $377,700 Active 17 DOM
-
2026-06-10days on market $377,700 Active 14 DOM
-
2026-06-09days on market $377,700 Active 13 DOM
-
2026-06-08days on market $377,700 Active 12 DOM
-
2026-06-07days on market $377,700 Active 11 DOM
-
2026-06-03days on market $377,700 Active 7 DOM
-
2026-06-02days on market $377,700 Active 6 DOM
-
2026-06-01days on market $377,700 Active 5 DOM
-
2026-05-31days on market $377,700 Active 4 DOM
-
2026-05-30days on market $377,700 Active 3 DOM
-
2026-05-27$377,700 Active
-
2011-03-09soldstatus $91,350 96-char remark
Show marketing remark (96 chars)
Lovely 3 bedroom, 2 bath condo located within a mile of Park Shore Beaches. Buyer to verify all!
-
2010-11-18$85,000 96-char remark
Show marketing remark (96 chars)
Lovely 3 bedroom, 2 bath condo located within a mile of Park Shore Beaches. Buyer to verify all!
ⓘ Source: listings_history table (triggers on properties + properties_extension) + one-shot
backfill from property_details.listing_events for pre-trigger history.
Tax reassessment forecast FL · Resets to sale price
- Current annual tax
- $2,875 · $240/mo
- Projected year-2 tax
- $3,135 · $261/mo
- Expected delta
- +$260/yr (+$22/mo · 9.0%)
ⓘ Screening estimate from a state-policy table — verify with the county assessor before closing.
Climate risk First Street
- Flood 5/10 Major FEMA zone AH · 23% chance over 30 yrs
- Wildfire 1/10 Low
- Heat 10/10 Extreme 7 d/yr ≥107°F today · 29 d/yr by 30 yrs out
- Wind 10/10 Extreme 99% chance of damaging wind over 30 yrs
- Air quality 2/10 Low 2 unhealthy d/yr today · 2 by 30 yrs out
Nearby sold comps map
Loading sold comps map…
Walkable amenities ~0.75 mi
Loading nearby amenities…
Taxation est. · year 1
- Rental income
- $74,426
- − Mortgage interest
- −$21,157
- − Property taxes
- −$2,875
- − Insurance
- −$3,713
- − Repairs & maintenance
- −$5,954
- − Management
- −$5,954
- − HOA
- −$7,356
- − Depreciation
- −$10,988
- Taxable income
- $16,429
- Est. tax owed @ 24.0%
- −$3,943
- After-tax cash flow
- $17,141/yr
For passive investors: Depreciation is non-cash, so a rental often shows a tax loss while cash-flowing — sheltering income. Rental losses are passive: they offset passive income freely, and up to $25,000/yr can offset ordinary (W-2) income if you actively participate and your MAGI is under $100k (phasing out to $0 by $150k); unused losses carry forward. On sale, claimed depreciation is recaptured at up to 25%, and gains may owe capital-gains tax (a 1031 exchange can defer both). Figures are a year-1 estimate at your 24.0% rate — not tax advice; consult a CPA.
Schools (NCES district)
- District
- Collier
- NCES district ID
- 1200330
- Math proficiency
- 60% ▼ -4.00%
- Reading proficiency
- 56% ▼ -2.00%
- Median HH income
- $58,275
- Composite
- 50.23/100
- National rank
- #1892
- State rank
- #16 of 73 in FL
Livability — Naples
- Score
- 80/100
- State rank
- #126
- US rank
- #1903
Category grades
Schools grade is shown separately in the Schools card above.
Census & demographics
- County
- Collier County · 396,295 people
- City population
- 344,941
- Metro
- Naples-Marco Island, FL
- Population (ZIP)
- 11,299
- Household income
- $116,875
- Rent vs Own
- Severe rent burden
- 311.0
Population outlook (Collier County) Hauer SSP2
- Today (2025)
- 420,858 people
- By 2030
- 450,054 · +6.9%
- By 2040
- 502,232 · +19.3%
- By 2050
- 544,932 · +29.5%
- By 2075
- 627,203 · +49.0%
- By 2100
- 659,015 · +56.6%
Race, ethnicity, and origin ACS 2023
- Neighborhood character
- Predominantly White (87%)
- Race & ethnicity
- White 87% Hispanic / Latino 10% Two or more races 8% Asian 1%
- Hispanic origin (detail)
- Common ancestry
- Romanian 4% Lithuanian 2% Portuguese 2%
- Foreign-born
- 13% · Canada
- Languages at home
- 87% English-only · Spanish 9% Other Indo-European 2% German/W. Germanic 1%
Political lean MEDSL · Collier
- 2024 margin
- Solid R (+33.1) · D 33.1% · R 66.2%
- 2008→2024 swing
- -10.6pp toward R · 2008: -22.5pp · 2024: -33.1pp
- All cycles
- 2024: R+33.1 2020: R+24.7 2016: R+26.0 2012: R+30.1 2008: R+22.5
Not yet ingested
- Civics
- —
Market trends
- HPI YoY
- ▼ -327.53%
- Current HPI
- 315.1396
- Rent YoY
- ▲ 14.55%
- Metro
- Naples-Marco Island, FL
- State GDP YoY
- ▲ 3.28%
- F500 in state
- 36
Industry mix (Fortune 500 HQ in FL)
| Industry | F500 HQs | Revenue |
|---|---|---|
| Industrial Technology | 2 | $29B |
|
||
| Insurance | 2 | $17B |
|
||
| Retail | 1 | $60B |
|
||
| Technology Distribution | 1 | $58B |
|
||
| Homebuilding | 1 | $35B |
|
||
| Technology Manufacturing | 1 | $35B |
|
||
Price history
+344.4% since first listed3 events — show timeline
- 2026-05-27 Listed $377,700 BEARMLS
- 2011-03-09 Sold (MLS) $91,350 NAPLESMLS
- 2010-11-18 Listed $85,000 NAPLESMLS
Property tax history
+12.0%/yrLatest (2025): $2,875 · -0.8% YoY. Source: county tax records.
Cash-flow waterfall
monthlySold comps — $/sqft
last 12 mo · ≤1 miLoading sold comps…