664 Eastland Ave · Kingstree, SC
Flood risk 1/10 · Minimal
- FEMA flood zone
- X (unshaded)
- Chance of flooding over 30 yrs
- 0.0%
- Est. flood insurance / yr
- $507 – $1,088
Fire risk 7/10 · Major
- Est. fire insurance / yr
- $783 – $1,453
Heat risk 8/10 · Major
- Hot days now (above 108°F)
- 7 days/yr
- Hot days in 30 yrs
- 16 days/yr
Wind risk 8/10 · Major
- Chance of severe wind over 30 yrs
- 80.0%
Air-quality risk 3/10 · Minor
- Unhealthy air days now
- 3 days/yr
- Unhealthy air days in 30 yrs
- 3 days/yr
Risk factors via First Street. Map © Google.
Why this score? — see what drove the B- grade
The composite is a weighted blend of 9 inputs, each scored 0–100. Each bar is that input's sub-score; the figure is the points it added to the 100-point composite (weight × sub-score).
- Cash flow +29.5/30.0
- DSCR +10.0/10.0
- 1% rule +8.6/10.0
- ARV discount +7.5/15.0
- Livability +3.4/5.0
- Rent growth +2.5/5.0
- Condition / age +2.5/5.0
- Schools +1.5/10.0
- Appreciation +0.0/10.0
$75,000
🖨 Deal sheet (PDF) 📄 Offer letter ✓ Due diligence
Listing remarks
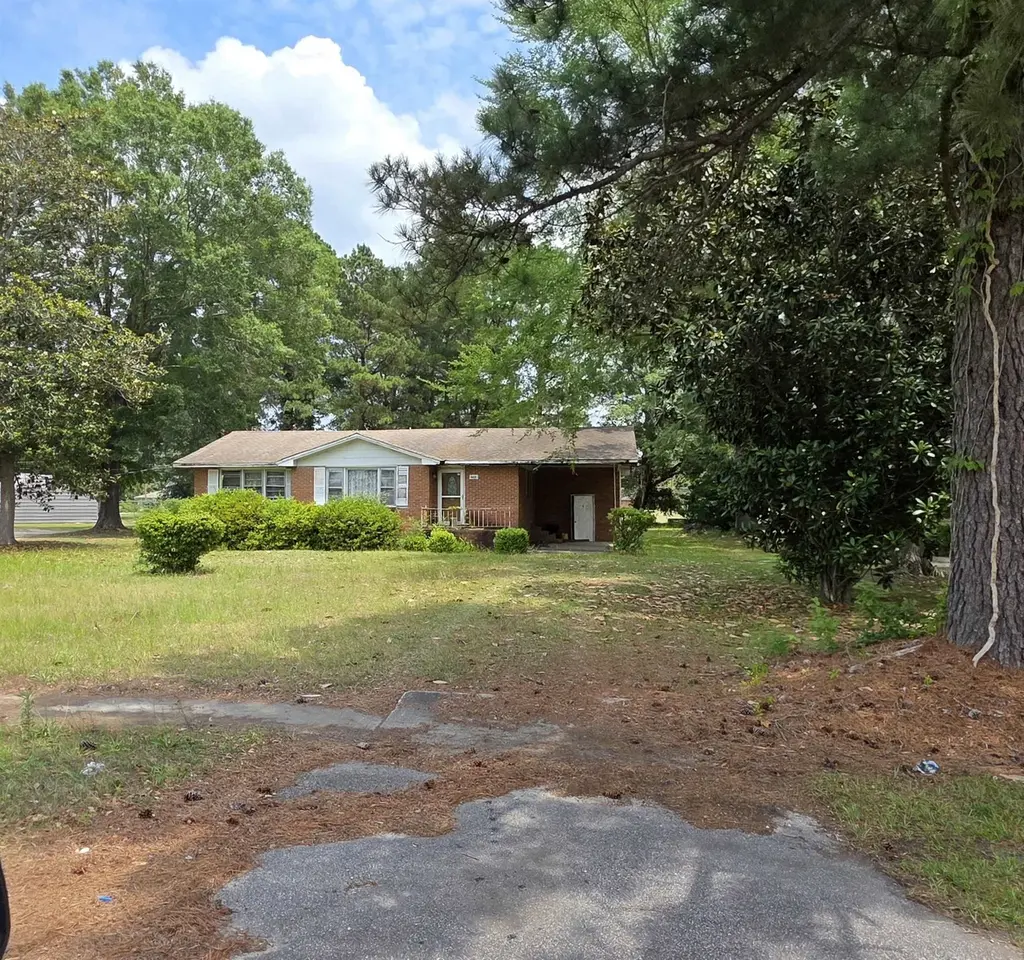
Attention Investors, Contractors, Home Flippers! This all brick, 3 bedroom, 1.5 bath home is located close to downtown. Home sits on 0.40 acres, having a large front and back yard. Home was filled with cherished family memories, but now ready for the next chapter. In need of renovations, this property offers great potential for buyers with a vision to transform it into a unique opportunity!
Key facts
- Large front yard
- Brick home
- Large back yard
Tags
Property features AI
Finance
- HOA & community: Monthly association fee
Exterior
- Parking: Carport; 4 total parking spaces
- Utilities: Electricity available; Sewer available
- Home design: Residential zoning
- Construction: Brick veneer; Crawlspace foundation
- Exterior features: City lot; Rectangular lot
Interior
- Bathrooms: 1 full bathroom; 1 half bathroom
- Interior features: Unfurnished; Crawl space
Neighborhood map
What this means for you Summary
Snapshot
- This is a 3-bed/1.5-bath other listed at $75k.
Deal economics
- At list price, monthly cash flow is $268 ($3k/yr) — positive.
- The deal already cash-flows at list — no discount required.
- Meets the 1% rule at list price ($1k rent vs $75k).
- Cap rate 10.6% vs local median 5.5% in Kingstree — top-decile yield for the area; either an underpriced asset or a hidden risk that comps aren't pricing in. Stress-test before assuming the spread holds.
Location & tenants
- Location reads 67/100 on livability (#88 in SC) — a middle-class / working-renter tenant base. Strengths: cost of living A+, health & safety A+, commute B+; Watch: housing C-, employment D, schools D-.
- Williamsburg 01 (rural): math 13% / reading 26% proficiency, ranked #74 of 80 in SC (top 92%) — low school quality limits family demand, transient renter base, plan for 1-2y turnover; 88% free/reduced lunch — lower-income household profile, screen leases tightly.
- Market conditions: 60 active listings in the ZIP; 35 units permitted in Williamsburg County in 2024 (0 in 5+ unit buildings).
Forward outlook
- Local home prices are declining (-3.0%/yr); year-one equity from $519 of loan paydown is wiped out by about $2k of value loss. Plan a longer hold.
- Williamsburg County population projected at -32% by 2050 — secular population decline; favor cash flow + early exit over multi-decade hold.
- At projected returns (-3.0% appreciation + 3.0% rent growth), your $21k cash investment doubles in ~8 years — after that, you're playing with house money.
Negotiation context
- Only 11 days on market — expect competitive offers; lowballing is unlikely to land.
Risks & watch-outs
- Climate carrying-cost: severe wind risk, 80% chance of damaging wind over 30y; major wildfire risk; extreme-heat days projected 7→16/yr by 2055 (HVAC capex compounding) — expect insurance premiums to compound above CPI over the hold.
Questions for the listing agent
- Built in 1971 — when were the roof, HVAC, electrical panel, plumbing, and water heater last replaced?
- Is there a deadline driving the sale (1031 exchange, divorce, estate, relocation)? That informs how much negotiation room exists.
- Schools are D-rated, which usually means shorter tenancies and higher turnover. Who's the typical renter profile here, and what's been the actual vacancy rate?
- Crime grade is F in this area — have there been break-ins, vandalism, or insurance claims at this property in the last 3 years? What carrier currently insures it and at what premium?
- What's the average days-on-market for RENTAL listings here right now (not sales)? A rising rental-DOM trend means longer vacancies and softer asking-rent achievability than the comps imply.
- What's the recent tenant-quality profile in this submarket — average credit score on applications, eviction rate, late-payment / NSF rate, and stable-employment percentage? A property-management company in the area should have these aggregated.
- How much new for-sale + rental construction is in the pipeline within 1–3 miles? Heavy new supply typically softens prices + rents 12–24 months out; constrained supply supports both.
Investment metrics
- 1% rule
- 1.36% ✓
- Cap rate
- 10.58%
- Cash-on-cash
- 15.30%
- DSCR
- 1.68
- GRM
- 6.1
CMA / ARV
No comps found within radius.
Projected returns pro-forma
-3.0% appreciation · 3.0% rent growth · sell at horizon
- IRR
- 6.0%
- Equity multiple
- 1.23×
- Total profit
- $4,931
- Equity at exit
- $11,183
- IRR
- 15.4%
- Equity multiple
- 2.26×
- Total profit
- $26,367
- Equity at exit
- $6,485
Cash invested: $21,000 (down + closing). Projections, not guarantees.
Landlord ↔ Tenant lean methodology
- Overall (STATE)
- 90 Strongly Landlord-Friendly
- State South Carolina
- 90 Strongly Landlord-Friendly · R+6
- County
- — inherits STATE
- City
- — inherits STATE
ZIP-level market 29556
- Home prices YoY
- -6.5%
- Active inventory
- 60
- Price-to-rent
- 6.1×
Monthly cashflow live
- Estimated rent
- $1,018 medium interval (Pro) →
- Mortgage (P&I)
- −$393
- Tax from tax record
- −$112 /mo · $1,346/yr
- Insurance
- −$31
- HOA
- −$0
- Vacancy / Maint / Mgmt
- −$214
- Net cashflow
- $268
Break-even live
Sensitivity live
| Price | -10% $310 | -5% $289 | +0% $268 | +5% $247 | +10% $225 |
|---|---|---|---|---|---|
| Rent | -10% $187 | -5% $228 | +0% $268 | +5% $308 | +10% $348 |
| Rate | -1.0pp $306 | -0.5pp $287 | base $268 | +0.5pp $248 | +1.0pp $229 |
UW: 25.0% down · 7.5% · 30yr · 1.5% tax · 5.0% vac · 8.0% maint · 8.0% mgmt
Financing live
Cash to close
- Down payment
- $18,750
- Closing costs
- $2,250
- Reserves months
- —
- Total cash needed
- —
Loan-product check · same deal, 3 products live
Conventional
25% down · 7.5% · 30yr
- Down + closing
- —
- Monthly P&I
- —
- Monthly cashflow
- —
- DSCR
- —
- Eligible?
- —
Personal DTI + credit; lowest rate.
DSCR
20% down · 8.5% · 30yr
- Down + closing
- —
- Monthly P&I
- —
- Monthly cashflow
- —
- DSCR
- —
- Eligible?
- —
No personal income docs; deal must DSCR.
Hard money
10% down · 12.0% · 12mo
- Down + closing
- —
- Monthly P&I
- —
- Monthly cashflow
- —
- DSCR
- —
- Eligible?
- —
Short-term bridge; refi at stabilization.
Listing history 9 events
-
2026-06-21days on market $75,000 Active 11 DOM
-
2026-06-21days on market $75,000 Active 10 DOM
-
2026-06-18days on market $75,000 Active 8 DOM
-
2026-06-17days on market $75,000 Active 7 DOM
-
2026-06-16days on market $75,000 Active 6 DOM
-
2026-06-15days on market $75,000 Active 5 DOM
-
2026-06-13days on market $75,000 Active 3 DOM
-
2026-06-12remarks 394-char remark
-
2026-06-12$75,000 Active 2 DOM
ⓘ Source: listings_history table (triggers on properties + properties_extension) + one-shot
backfill from property_details.listing_events for pre-trigger history.
Tax reassessment forecast SC · Resets to sale price
- Current annual tax
- $1,346 · $112/mo
- Projected year-2 tax
- $1,346 · $112/mo
- Expected delta
- $0/yr ($0/mo · 0.0%)
ⓘ Screening estimate from a state-policy table — verify with the county assessor before closing.
Climate risk First Street
- Flood 1/10 Low FEMA zone X (unshaded) · 0% chance over 30 yrs
- Wildfire 7/10 Severe
- Heat 8/10 Severe 7 d/yr ≥108°F today · 16 d/yr by 30 yrs out
- Wind 8/10 Severe 80% chance of damaging wind over 30 yrs
- Air quality 3/10 Moderate 3 unhealthy d/yr today · 3 by 30 yrs out
Nearby sold comps map
Loading sold comps map…
Walkable amenities ~0.75 mi
Loading nearby amenities…
Taxation est. · year 1
- Rental income
- $12,221
- − Mortgage interest
- −$4,201
- − Property taxes
- −$1,346
- − Insurance
- −$375
- − Repairs & maintenance
- −$978
- − Management
- −$978
- − Depreciation
- −$2,182
- Taxable income
- $2,162
- Est. tax owed @ 24.0%
- −$519
- After-tax cash flow
- $2,695/yr
For passive investors: Depreciation is non-cash, so a rental often shows a tax loss while cash-flowing — sheltering income. Rental losses are passive: they offset passive income freely, and up to $25,000/yr can offset ordinary (W-2) income if you actively participate and your MAGI is under $100k (phasing out to $0 by $150k); unused losses carry forward. On sale, claimed depreciation is recaptured at up to 25%, and gains may owe capital-gains tax (a 1031 exchange can defer both). Figures are a year-1 estimate at your 24.0% rate — not tax advice; consult a CPA.
Schools (NCES district)
- District
- Williamsburg 01
- NCES district ID
- 4503780
- Math proficiency
- 13% ▼ -11.00%
- Reading proficiency
- 26% ▼ -4.00%
- Median HH income
- $27,663
- Composite
- 15.32/100
- National rank
- #9328
- State rank
- #74 of 80 in SC
Livability — Kingstree
- Score
- 67/100
- State rank
- #88
- US rank
- #10168
Category grades
Schools grade is shown separately in the Schools card above.
Census & demographics
- Population (ZIP)
- 11,133
Population outlook (Williamsburg County) Hauer SSP2
- Today (2025)
- 29,171 people
- By 2030
- 27,247 · -6.6%
- By 2040
- 23,314 · -20.1%
- By 2050
- 19,798 · -32.1%
- By 2075
- 13,336 · -54.3%
- By 2100
- 8,502 · -70.9%
Race, ethnicity, and origin ACS 2023
- Neighborhood character
- Predominantly Black (71%)
- Race & ethnicity
- Black 71% White 27%
- Common ancestry
- Serbian 3% Lithuanian 1% Slovak 1%
- Foreign-born
- 1% · Canada
- Languages at home
- 99% English-only · Tagalog/Filipino 1%
Political lean MEDSL · Williamsburg
- 2024 margin
- Strong D (+21.7) · D 60.2% · R 38.5% · Other 1.2%
- 2008→2024 swing
- -16.5pp toward R · 2008: 38.2pp · 2024: 21.7pp
- All cycles
- 2024: D+21.7 2020: D+29.8 2016: D+33.8 2012: D+39.9 2008: D+38.2
Not yet ingested
- Civics
- —
Market trends
- HPI YoY
- ▼ -10.24%
- Current HPI
- 147.7604
- Rent YoY
- —
- Metro
- —
- State GDP YoY
- ▲ 4.51%
- F500 in state
- 2
Industry mix (Fortune 500 HQ in SC)
| Industry | F500 HQs | Revenue |
|---|---|---|
| Packaging | 1 | $7B |
|
||
Price history
1 event — show timeline
- 2026-06-10 Listed $75,000 CCAR
Property tax history
+2.1%/yrLatest (2025): $1,346 · +0.1% YoY. Source: county tax records.
Cash-flow waterfall
monthlySold comps — $/sqft
last 12 mo · ≤1 miLoading sold comps…