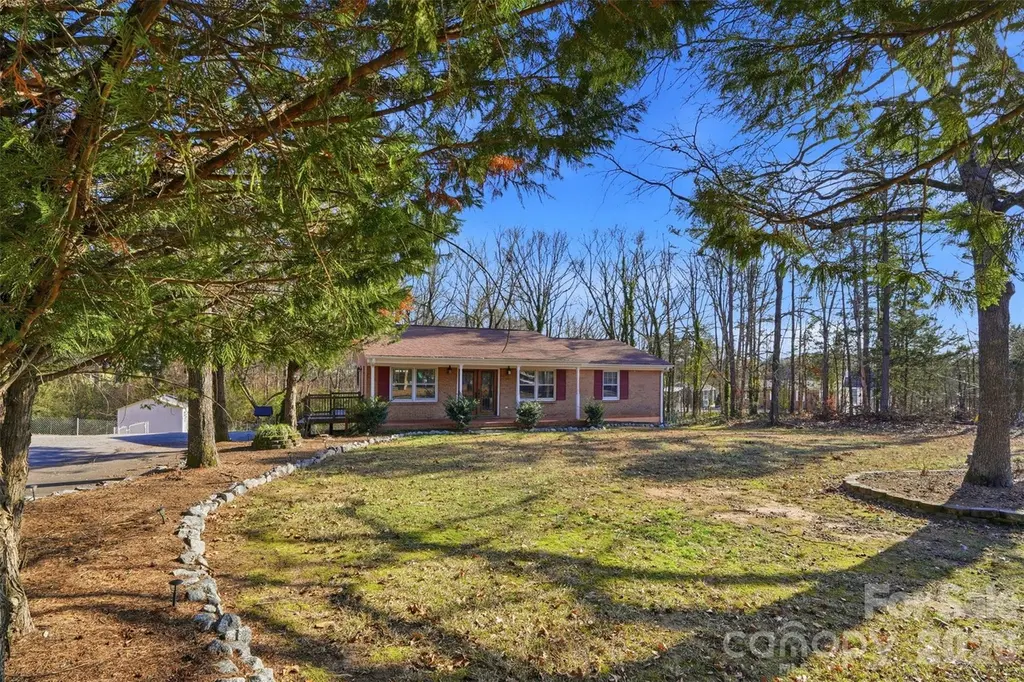
324 Pawley Dr · Charlotte, NC
Flood risk 1/10 · Minimal
- FEMA flood zone
- X (unshaded)
- Chance of flooding over 30 yrs
- 0.0%
- Est. flood insurance / yr
- $507 – $1,088
Fire risk 3/10 · Minor
- Est. fire insurance / yr
- $906 – $1,684
Heat risk 6/10 · Moderate
- Hot days now (above 104°F)
- 7 days/yr
- Hot days in 30 yrs
- 16 days/yr
Wind risk 4/10 · Minor
- Chance of severe wind over 30 yrs
- 20.0%
Air-quality risk 3/10 · Minor
- Unhealthy air days now
- 3 days/yr
- Unhealthy air days in 30 yrs
- 4 days/yr
Risk factors via First Street. Map © Google.
Why this score? — see what drove the D+ grade
The composite is a weighted blend of 9 inputs, each scored 0–100. Each bar is that input's sub-score; the figure is the points it added to the 100-point composite (weight × sub-score).
- ARV discount +15.0/15.0
- Cash flow +13.0/30.0
- DSCR +3.9/10.0
- Livability +3.9/5.0
- Schools +3.8/10.0
- Rent growth +3.3/5.0
- 1% rule +2.8/10.0
- Condition / age +2.5/5.0
- Appreciation +0.0/10.0
$325,000
🖨 Deal sheet 📄 Offer letter ✓ Due diligence
Listing remarks
Qualifies for 100% financing & $10,000 in closing costs!!! This 3-bedroom, 1-bath brick ranch delivers the kind of flexibility and lifestyle today’s buyers are searching for. Move-in ready yet full of potential, the home features a partially finished basement currently used as a den or optional fourth bedroom, plus a large unfinished basement area with exterior access and a garage door—ideal for storage, a workshop, or future finished space. Step outside to a half-acre lot designed for relaxing and entertaining, complete with a backyard tiki bar and storage shed, offering room to host, garden, or expand your outdoor vision. Whether you’re a homeowner looking to perso
Key facts
- Backyard tiki bar
- Exterior access
- Half-acre lot
Tags
Property features AI
Finance
- HOA & community: No HOA
Exterior
- Parking: Driveway; Detached garage with 1 garage space and main-level garage access; Basement garage door
- Utilities: Well water; Septic system installed
- Home design: Single-family residential home; Site-built construction; One level (main living level) with finished basement; Brick exterior
- Construction: Brick construction; Basement foundation; Basement includes partially finished and unfinished areas
- Exterior features: Concrete/paved driveway and road access; Publicly maintained road
Interior
- Kitchen: Electric oven; Electric range
- Bedrooms: 3 bedrooms on the main level
- Bathrooms: 1 full bathroom
- Heating & cooling: Central heating; Central air conditioning
- Interior features: 9 total rooms; Partially finished basement with storage and shop space; Basement offers apartment potential with both interior and exterior entries and walk-up/walk-out access
- Laundry & utility: In-unit laundry located inside; Electric water heater
Neighborhood map
What this means for you Summary
Snapshot
- This is a 3-bed/1.0-bath single-family listed at $325k.
Deal economics
- At list price, monthly cash flow is $-15 ($-184/yr) — negative.
- To cash-flow at today's rent, offer at most $322k (0.8% below list).
- To meet the 1% rule (rent ≥ 1% of price), the offer needs to be $255k (21.5% below list).
- Recommended offer: $255k (21.5% below list) — sets the bar for 1% rule.
- Cap rate 6.2% vs local median 3.1% in Charlotte — top-decile yield for the area; either an underpriced asset or a hidden risk that comps aren't pricing in. Stress-test before assuming the spread holds.
Location & tenants
- Location reads 78/100 on livability (#26 in NC, #2,502 nationally) — a middle-class / working-renter tenant base. Strengths: amenities A+, commute A+, housing A+; Watch: schools D+, crime F.
- Charlotte-Mecklenburg Schools (urban): math 42% / reading 46% proficiency, ranked #85 of 178 in NC (top 48%) — families likely to look elsewhere, expect single-tenant / working-renter base with shorter leases.
- Market conditions: Rents rising (+3.4%/yr); 363 active listings in the ZIP; 9 comparable units currently listed for rent nearby; rentals at typical pace (median 16d on market — plan ~3-4 weeks tenant-placement turnaround); solid renter incomes; 11,969 units permitted in Mecklenburg County in 2024 (5,377 in 5+ unit buildings).
- This rent runs 35% of the median local income ($86k/yr) — at the standard rent-burdened threshold; future hikes will face affordability resistance.
Forward outlook
- Local home prices are declining (-3.0%/yr); year-one equity from $2k of loan paydown is wiped out by about $10k of value loss. Plan a longer hold.
- Mecklenburg County population projected at +53% by 2050 — long-run rental-demand tailwind backs the buy-and-hold thesis.
Negotiation context
- It's been on market 48 days — a 3% lower offer ($315k) is reasonable based on typical stale-listing flexibility.
- 2 sale attempts; this cycle's ask has dropped $25k (7%) from the opening price — seller is motivated, your offer sets the floor, not the list.
Risks & watch-outs
- Climate carrying-cost: extreme-heat days projected 7→16/yr by 2055 (HVAC capex compounding) — expect insurance premiums to compound above CPI over the hold.
Questions for the listing agent
- What do current leases actually rent for vs. the listed asking? Can we see a recent rent roll and the last 12 months of T-12 income?
- It's been on market 48 days. Have you received any prior offers? Is the seller open to a 22% concession, seller financing, or rate buy-down credit?
- Built in 1970 — when were the roof, HVAC, electrical panel, plumbing, and water heater last replaced?
- Is there a deadline driving the sale (1031 exchange, divorce, estate, relocation)? That informs how much negotiation room exists.
- Schools are D-rated, which usually means shorter tenancies and higher turnover. Who's the typical renter profile here, and what's been the actual vacancy rate?
- Crime grade is F in this area — have there been break-ins, vandalism, or insurance claims at this property in the last 3 years? What carrier currently insures it and at what premium?
- The area grade is low — what's the realistic commute time and amenity access for the typical tenant pool here? Any planned neighborhood developments (good or bad) we should know about?
- What's the average days-on-market for RENTAL listings here right now (not sales)? A rising rental-DOM trend means longer vacancies and softer asking-rent achievability than the comps imply.
- What's the recent tenant-quality profile in this submarket — average credit score on applications, eviction rate, late-payment / NSF rate, and stable-employment percentage? A property-management company in the area should have these aggregated.
- How much new for-sale + rental construction is in the pipeline within 1–3 miles? Heavy new supply typically softens prices + rents 12–24 months out; constrained supply supports both.
Investment metrics
- 1% rule
- 0.78% ✗
- Cap rate
- 6.24%
- Cash-on-cash
- -0.20%
- DSCR
- 0.99
- GRM
- 10.6
CMA / ARV
- ARV (on-the-fly)
- $434,280
- Comps found
- 6
Show comp detail 6 sales within ~0.75 mi
| Address | Dist | Beds/Ba | Sqft | Sold | Price | $/sf | Match |
|---|---|---|---|---|---|---|---|
| 10728 Ridge Acres Rd | 0.26mi | 4/2.5 (+1) | 2,451 (-13%) | 8mo | $449,000 | $183 | 48 |
| 10527 River Hollow Ct | 0.72mi | 4/2.5 (+1) | 2,711 (-4%) | 4mo | $415,000 | $153 | 46 |
| 9612 Eagle Feathers Dr | 0.60mi | 4/2.5 (+1) | 2,699 (-4%) | 13mo | $390,000 | $144 | 43 |
| 10738 Ridge Acres Rd | 0.24mi | 4/2.5 (+1) | 2,413 (-14%) | 19mo | $435,000 | $180 | 38 |
| 1119 Chalk Hill Ln | 0.22mi | 4/2.5 (+1) | 2,399 (-15%) | 21mo | $370,000 | $154 | 36 |
| 10600 Appleberry Ln | 0.66mi | 4/2.5 (+1) | 2,659 (-6%) | 20mo | $330,000 | $124 | 32 |
Match score weights: distance 35% · size 25% · config 20% · recency 20%. Top-matched comps best support the ARV.
Projected returns pro-forma
-3.0% appreciation · 3.35% rent growth · sell at horizon
- IRR
- -16.3%
- Equity multiple
- 0.42×
- Total profit
- $-52,832
- Equity at exit
- $48,459
- IRR
- -7.5%
- Equity multiple
- 0.52×
- Total profit
- $-43,919
- Equity at exit
- $28,100
Cash invested: $91,000 (down + closing). Projections, not guarantees.
Landlord ↔ Tenant lean methodology
- Overall (STATE)
- 85 Strongly Landlord-Friendly
- State North Carolina
- 85 Strongly Landlord-Friendly · R+3
- County
- — inherits STATE
- City
- — inherits STATE
ZIP-level market 28214
- Home prices YoY
- -26.7%
- Rents YoY
- 3.4%
- Active inventory
- 363
- Price-to-rent
- 10.6×
Monthly cashflow live
- Estimated rent
- $2,550 high interval (Pro) →
- Mortgage (P&I)
- −$1,704
- Tax from tax record
- −$190 /mo · $2,282/yr
- Insurance
- −$135
- HOA
- −$0
- Vacancy / Maint / Mgmt
- −$536
- Net cashflow
- $-15
Break-even live
UW: 25.0% down · 7.5% · 30yr · 1.5% tax · 5.0% vac · 8.0% maint · 8.0% mgmt
Financing live
Cash to close
- Down payment
- $81,250
- Closing costs
- $9,750
- Reserves months
- —
- Total cash needed
- —
Loan-product check · same deal, 3 products live
Conventional
25% down · 7.5% · 30yr
- Down + closing
- —
- Monthly P&I
- —
- Monthly cashflow
- —
- DSCR
- —
- Eligible?
- —
Personal DTI + credit; lowest rate.
DSCR
20% down · 8.5% · 30yr
- Down + closing
- —
- Monthly P&I
- —
- Monthly cashflow
- —
- DSCR
- —
- Eligible?
- —
No personal income docs; deal must DSCR.
Hard money
10% down · 12.0% · 12mo
- Down + closing
- —
- Monthly P&I
- —
- Monthly cashflow
- —
- DSCR
- —
- Eligible?
- —
Short-term bridge; refi at stabilization.
Rent comps 9 comps
| Address | Beds | Baths | Sqft | Rent | $/sqft | DOM | Units | Dist |
|---|---|---|---|---|---|---|---|---|
| 11124 Pointer Ridge Dr Charlotte, NC | 4.0 | 3.0 | 2080 | $2,050 | $0.99 | 20d | 1 | 0.36mi |
| 806 Pine Forest Rd Charlotte, NC | 4.0 | 2.5 | 3144 | $3,500 | $1.11 | 1d | 1 | 0.36mi |
| 10731 Spruce Mountain Rd Charlotte, NC | 3.0 | 2.5 | 2534 | $2,300 | $0.91 | 20d | 1 | 0.73mi |
| 1513 Pine Mountain Rd Charlotte, NC | 3.0 | 2.5 | 2040 | $1,975 | $0.97 | 16d | 1 | 0.79mi |
| 9572 Turning Wheel Dr Charlotte, NC | 3.0 | 2.5 | 2032 | $2,070 | $1.02 | 3d | 1 | 1.19mi |
| 2307 Harwood Hills Ln Charlotte, NC | 3.0 | 2.5 | 2166 | $2,400 | $1.11 | 16d | 1 | 1.28mi |
| 2405 Harwood Hills Ln Charlotte, NC | 3.0 | 2.5 | 2304 | $2,365 | $1.03 | 7d | 1 | 1.34mi |
| 7005 Bermuda Woods Rd Charlotte, NC | 4.0 | 3.0 | 2350 | $2,700 | $1.15 | 3d | 1 | 1.37mi |
| 9711 Cayenne Dr Charlotte, NC | 4.0 | 2.5 | 2470 | $2,290 | $0.93 | 22d | 1 | 1.48mi |
Listing history 21 events
-
2026-06-18days on market $325,000 Active 48 DOM
-
2026-06-17pricedays on market $325,000 Active 47 DOM
-
2026-06-16days on market $350,000 Active 46 DOM
-
2026-06-15days on market $350,000 Active 45 DOM
-
2026-06-13days on market $350,000 Active 43 DOM
-
2026-06-09days on market $350,000 Active 39 DOM
-
2026-06-08days on market $350,000 Active 38 DOM
-
2026-06-07days on market $350,000 Active 37 DOM
-
2026-06-04days on market $350,000 Active 34 DOM
-
2026-06-03days on market $350,000 Active 33 DOM
-
2026-06-02days on market $350,000 Active 32 DOM
-
2026-06-02days on market $350,000 Active 31 DOM
-
2026-05-31days on market $350,000 Active 30 DOM
-
2026-05-02$350,000 Active
-
2026-02-18historical Active Under Contract
-
2026-01-23price $349,900
-
2026-01-20price $350,000
-
2026-01-17price $349,900
-
2026-01-12$350,000 Active
-
2025-12-05soldstatus $300,000
-
1990-08-01soldstatus $60,000
ⓘ Source: listings_history table (triggers on properties + properties_extension) + one-shot
backfill from property_details.listing_events for pre-trigger history.
Tax reassessment forecast NC · Resets to sale price
- Current annual tax
- $2,282 · $190/mo
- Projected year-2 tax
- $2,665 · $222/mo
- Expected delta
- +$383/yr (+$32/mo · 16.8%)
ⓘ Screening estimate from a state-policy table — verify with the county assessor before closing.
Climate risk First Street
- Flood 1/10 Low FEMA zone X (unshaded) · 0% chance over 30 yrs
- Wildfire 3/10 Moderate
- Heat 6/10 Major 7 d/yr ≥104°F today · 16 d/yr by 30 yrs out
- Wind 4/10 Moderate 20% chance of damaging wind over 30 yrs
- Air quality 3/10 Moderate 3 unhealthy d/yr today · 4 by 30 yrs out
Nearby sold comps map
Loading sold comps map…
Walkable amenities ~0.75 mi
Loading nearby amenities…
Taxation est. · year 1
- Rental income
- $30,602
- − Mortgage interest
- −$18,205
- − Property taxes
- −$2,282
- − Insurance
- −$1,625
- − Repairs & maintenance
- −$2,448
- − Management
- −$2,448
- − Depreciation
- −$9,455
- Taxable loss
- −$5,861
- Est. tax savings @ 24.0%
- +$1,407
- After-tax cash flow
- $1,223/yr
For passive investors: Depreciation is non-cash, so a rental often shows a tax loss while cash-flowing — sheltering income. Rental losses are passive: they offset passive income freely, and up to $25,000/yr can offset ordinary (W-2) income if you actively participate and your MAGI is under $100k (phasing out to $0 by $150k); unused losses carry forward. On sale, claimed depreciation is recaptured at up to 25%, and gains may owe capital-gains tax (a 1031 exchange can defer both). Figures are a year-1 estimate at your 24.0% rate — not tax advice; consult a CPA.
Schools (NCES district)
- District
- Charlotte-Mecklenburg Schools
- NCES district ID
- 3702970
- Math proficiency
- 42% ▼ -6.00%
- Reading proficiency
- 46% ▲ 1.00%
- Median HH income
- $57,175
- Composite
- 38.49/100
- National rank
- #4183
- State rank
- #85 of 178 in NC
Livability — Charlotte
- Score
- 78/100
- State rank
- #26
- US rank
- #2502
Category grades
Schools grade is shown separately in the Schools card above.
Census & demographics
- Census place
- Charlotte, NC
- County
- Mecklenburg County · 1,167,319 people
- City population
- 920,422
- Metro
- Charlotte-Concord-Gastonia, NC-SC
- Population (ZIP)
- 43,837
- Household income
- $86,447
- Rent vs Own
- Severe rent burden
- 671.0
Population outlook (Mecklenburg County) Hauer SSP2
- Today (2025)
- 1,305,740 people
- By 2030
- 1,442,752 · +10.5%
- By 2040
- 1,722,441 · +31.9%
- By 2050
- 1,999,450 · +53.1%
- By 2075
- 2,642,495 · +102.4%
- By 2100
- 3,106,755 · +137.9%
Race, ethnicity, and origin ACS 2023
- Neighborhood character
- Highly diverse neighborhood (Simpson 0.71)
- Race & ethnicity
- Black 40% White 30% Hispanic / Latino 18% Two or more races 9% Asian 6%
- Hispanic origin (detail)
- Mexican 9% Puerto Rican 1% Dominican 1%
- Common ancestry
- Serbian 1% Italian 1% Slovak 1%
- Foreign-born
- 15% · Canada, Vietnam, China
- Languages at home
- 77% English-only · Spanish 15% Vietnamese 2% Other Asian/Pacific 2%
Political lean MEDSL · Mecklenburg
- 2024 margin
- Solid D (+32.9) · D 65.6% · R 32.7% · Other 1.6%
- 2008→2024 swing
- +8.5pp toward D · 2008: 24.4pp · 2024: 32.9pp
- All cycles
- 2024: D+32.9 2020: D+35.1 2016: D+29.9 2012: D+22.5 2008: D+24.4
Not yet ingested
- Civics
- —
Market trends
- HPI YoY
- ▼ -100.82%
- Current HPI
- 277.2903
- Rent YoY
- ▲ 3.35%
- Metro
- Charlotte-Concord-Gastonia, NC-SC
- State GDP YoY
- ▲ 3.28%
- F500 in state
- 26
Industry mix (Fortune 500 HQ in NC)
| Industry | F500 HQs | Revenue |
|---|---|---|
| Financial Services | 2 | $213B |
|
||
| Retail | 2 | $95B |
|
||
| Industrial Conglomerate | 1 | $38B |
|
||
| Metals / Steel | 1 | $35B |
|
||
| Utilities | 1 | $30B |
|
||
| Industrial Machinery | 1 | $19B |
|
||
Price history
+483.3% since first listed8 events — show timeline
- 2026-05-02 Listed $350,000 CANOPYMLS as Distributed by MLS Grid
- 2026-02-18 Contingent — CANOPYMLS as Distributed by MLS Grid
- 2026-01-23 Price Changed $349,900 CANOPYMLS as Distributed by MLS Grid
- 2026-01-20 Price Changed $350,000 CANOPYMLS as Distributed by MLS Grid
- 2026-01-17 Price Changed $349,900 CANOPYMLS as Distributed by MLS Grid
- 2026-01-12 Listed $350,000 CANOPYMLS as Distributed by MLS Grid
- 2025-12-05 Sold (Public Records) $300,000 Public Records
- 1990-08-01 Sold (Public Records) $60,000 Public Records
Property tax history
+4.2%/yrLatest (2025): $2,282 · +2.1% YoY. Source: county tax records.
Cash-flow waterfall
monthlySold comps — $/sqft
last 12 mo · ≤1 miLoading sold comps…