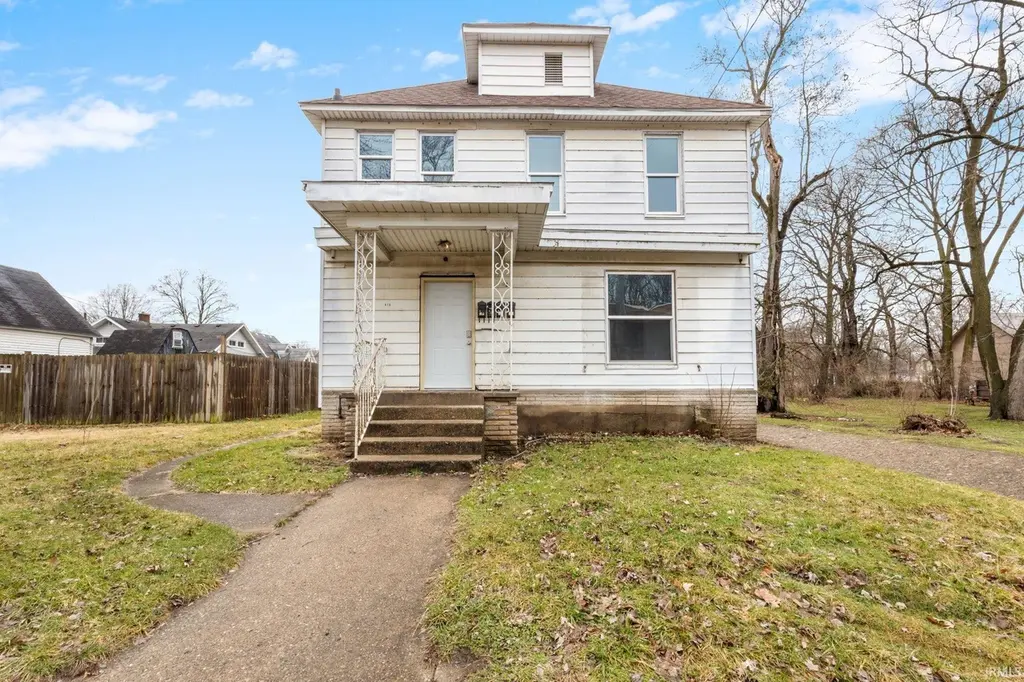
 Fourplex
415 N 2nd St · Elkhart, IN
Flood risk 10/10 · Severe
- FEMA flood zone
- X (shaded)
- Chance of flooding over 30 yrs
- 0.99%
- Est. flood insurance / yr
- $473 – $860
Fire risk 1/10 · Minimal
- Est. fire insurance / yr
- $717 – $1,331
Heat risk 3/10 · Minor
- Hot days now (above 101°F)
- 7 days/yr
- Hot days in 30 yrs
- 16 days/yr
Wind risk 2/10 · Minimal
- Chance of severe wind over 30 yrs
- —
Air-quality risk 3/10 · Minor
- Unhealthy air days now
- 2 days/yr
- Unhealthy air days in 30 yrs
- 3 days/yr
Risk factors via First Street. Map © Google.
Why this score? — see what drove the C+ grade
The composite is a weighted blend of 9 inputs, each scored 0–100. Each bar is that input's sub-score; the figure is the points it added to the 100-point composite (weight × sub-score).
- Cash flow +30.0/30.0
- 1% rule +10.0/10.0
- DSCR +10.0/10.0
- Livability +3.4/5.0
- Rent growth +2.5/5.0
- Condition / age +2.5/5.0
- Schools +1.8/10.0
- ARV discount +0.0/15.0
- Appreciation +0.0/10.0
$179,900
🖨 Deal sheet 📄 Offer letter ✓ Due diligence
Multi-family units
County records classify this as Multi-Family (2-4 Unit). Listing-text estimate: 4 units. confirmed
Listing remarks MLS
Monthly cash flow and potential on this one! This four unit has lots of potential income, growth and many upgrades in the building have already been completed. The building features four apartments. . new roof in 2024 and windows in 2023, flooring, furnace (7yr) water heater (1yr) and kitchen upgrades throughout, the electric has been upgraded and individually metered. Broker Owned . .. Listing Agent is related to Seller Minimum 48 hour notice for showings.
Key facts
- Kitchen upgrades
- Electric upgraded
- Flooring upgrades
Tags
Neighborhood map
What this means for you Summary
Snapshot
- This is a 4 × 4-bed/1.0-bath units multifamily listed at $180k.
Deal economics
- At list price, monthly cash flow is $2k ($29k/yr) — positive. Per door: $610/mo.
- The deal already cash-flows at list — no discount required.
- Meets the 1% rule at list price ($5k rent vs $180k).
- Recommended offer: $164k (9.0% below list) — sets the bar for market timing.
- Cap rate 22.9% vs local median 4.0% in Elkhart — top-decile yield for the area; either an underpriced asset or a hidden risk that comps aren't pricing in. Stress-test before assuming the spread holds.
Location & tenants
- Location reads 68/100 on livability (#224 in IN) — a middle-class / working-renter tenant base. Strengths: cost of living A+, housing A+, health & safety A+; Watch: amenities C-, schools F, crime F.
- Elkhart Community Schools (urban): math 18% / reading 25% proficiency, ranked #271 of 301 in IN (top 90%) — low school quality limits family demand, transient renter base, plan for 1-2y turnover.
- Market conditions: 146 active listings in the ZIP; 1 comparable units currently listed for rent nearby; 484 units permitted in Elkhart County in 2024 (136 in 5+ unit buildings).
- At $4,739/mo this rent would consume 101% of the median local household income ($56k/yr) (locally 995% of renters already pay >50% of income on rent) — very limited rent-growth headroom before tenants either downsize or default.
Forward outlook
- Local home prices are declining (-3.0%/yr); year-one equity from $1k of loan paydown is wiped out by about $5k of value loss. Plan a longer hold.
- Elkhart County population projected at +7% by 2050 — modest demand growth; plan on rents tracking national, not racing it.
- At projected returns (-3.0% appreciation + 3.0% rent growth), your $50k cash investment doubles in ~2 years — after that, you're playing with house money.
Negotiation context
- It's been on market 99 days — a 9% lower offer ($164k) is reasonable based on typical stale-listing flexibility.
- 8 sale attempts since 9y ago; this cycle's ask has dropped $20k (10%) from the opening price — seller is motivated, your offer sets the floor, not the list.
- Current owner paid $22k; list at $180k implies a 733% gain — meaningful room to come down on a strong offer.
Risks & watch-outs
- Watch-outs: flood insurance adds $56/mo; built in 1908 — expect roof / HVAC / electrical / plumbing capex.
- Climate carrying-cost: severe flood risk — expect insurance premiums to compound above CPI over the hold.
Questions for the listing agent
- It's been on market 99 days. Have you received any prior offers? Is the seller open to a 9% concession, seller financing, or rate buy-down credit?
- Can we see the unit-by-unit rent roll, current vacancy, and any below-market leases? What's the average tenancy length?
- What capital expenditures (roof, boiler, parking lot, exteriors) have been made in the last 5 years, and what's planned in the next 2?
- Built in 1908 — when were the roof, HVAC, electrical panel, plumbing, and water heater last replaced?
- What's the actual annual flood-insurance premium (NFIP or private), and is the property in a SFHA with mandatory coverage?
- Why hasn't it sold? Are there any deal-killer items the seller is aware of (foundation, flood, title, zoning, code violations)?
- Is there a deadline driving the sale (1031 exchange, divorce, estate, relocation)? That informs how much negotiation room exists.
- Schools are F-rated, which usually means shorter tenancies and higher turnover. Who's the typical renter profile here, and what's been the actual vacancy rate?
- Crime grade is F in this area — have there been break-ins, vandalism, or insurance claims at this property in the last 3 years? What carrier currently insures it and at what premium?
- What's the average days-on-market for RENTAL listings here right now (not sales)? A rising rental-DOM trend means longer vacancies and softer asking-rent achievability than the comps imply.
- What's the recent tenant-quality profile in this submarket — average credit score on applications, eviction rate, late-payment / NSF rate, and stable-employment percentage? A property-management company in the area should have these aggregated.
- How much new apartment / multifamily construction is in the pipeline within 1–3 miles? Heavy new supply (>2% of stock underway) typically softens rents 12–24 months out; light construction supports rent growth.
Investment metrics
- 1% rule
- 2.63% ✓
- Cap rate
- 22.94%
- Cash-on-cash
- 59.46%
- DSCR
- 3.65
- GRM
- 3.2
CMA / ARV
- ARV (median comp)
- $153,510
- List price
- $179,900
- Delta
- 17.19%
- Verdict
- OVERPRICED
- Comps
- 20 within 1.0 mi
Show comp detail 6 sales within ~0.75 mi
| Address | Dist | Beds/Ba | Sqft | Sold | Price | $/sf | Match |
|---|---|---|---|---|---|---|---|
| 207 N 2nd St | 0.18mi | 4/4.0 (-1) | 2,442 (+12%) | 4mo | $111,100 | $45 | 61 |
| 607 W Marion St | 0.68mi | 4/4.0 (-1) | 2,028 (-7%) | 5mo | $95,000 | $47 | 46 |
| 1041 Cassopolis St | 0.50mi | 4/3.0 (-1) | 1,944 (-11%) | 5mo | $155,000 | $80 | 44 |
| 657 Milwaukee Ave | 0.54mi | 6/2.0 (+1) | 2,016 (-8%) | 9mo | $135,000 | $67 | 39 |
| 313/315 N Riverside Dr | 0.38mi | 6/2.0 (+1) | 2,448 (+12%) | 12mo | $212,000 | $87 | 37 |
| 529 W Marion St | 0.66mi | 4/4.0 (-1) | 2,477 (+14%) | 11mo | $125,000 | $50 | 31 |
Match score weights: distance 35% · size 25% · config 20% · recency 20%. Top-matched comps best support the ARV.
Projected returns pro-forma
-3.0% appreciation · 3.0% rent growth · sell at horizon
- IRR
- 56.7%
- Equity multiple
- 3.51×
- Total profit
- $126,388
- Equity at exit
- $26,824
- IRR
- 61.7%
- Equity multiple
- 7.17×
- Total profit
- $310,639
- Equity at exit
- $15,554
Cash invested: $50,372 (down + closing). Projections, not guarantees.
Landlord ↔ Tenant lean methodology
- Overall (STATE)
- 90 Strongly Landlord-Friendly
- State Indiana
- 90 Strongly Landlord-Friendly · R+11
- County
- — inherits STATE
- City
- — inherits STATE
ZIP-level market 46516
- Active inventory
- 146
- Price-to-rent
- 12.7×
Monthly cashflow live
- Estimated rent
- $4,739 medium interval (Pro) →
- Mortgage (P&I)
- −$943
- Tax from tax record
- −$229 /mo · $2,754/yr
- Insurance
- −$75
- Flood insurance flood zone
- −$56 /mo · $666/yr
- HOA
- −$0
- Vacancy / Maint / Mgmt
- −$995
- Net cashflow
- $2,440
Break-even live
4-unit breakdown (identical units grouped — click to expand)
| Units | Beds | Baths | Est. rent |
|---|---|---|---|
| 4× units | 4 | 1 | $4,740 |
| #1 | 4 | 1 | $1,185 |
| #2 | 4 | 1 | $1,185 |
| #3 | 4 | 1 | $1,185 |
| #4 | 4 | 1 | $1,185 |
| Total (4 units) | $4,739 | ||
UW: 25.0% down · 7.5% · 30yr · 1.5% tax · 5.0% vac · 8.0% maint · 8.0% mgmt
Financing live
Cash to close
- Down payment
- $44,975
- Closing costs
- $5,397
- Reserves months
- —
- Total cash needed
- —
Loan-product check · same deal, 3 products live
Conventional
25% down · 7.5% · 30yr
- Down + closing
- —
- Monthly P&I
- —
- Monthly cashflow
- —
- DSCR
- —
- Eligible?
- —
Personal DTI + credit; lowest rate.
DSCR
20% down · 8.5% · 30yr
- Down + closing
- —
- Monthly P&I
- —
- Monthly cashflow
- —
- DSCR
- —
- Eligible?
- —
No personal income docs; deal must DSCR.
Hard money
10% down · 12.0% · 12mo
- Down + closing
- —
- Monthly P&I
- —
- Monthly cashflow
- —
- DSCR
- —
- Eligible?
- —
Short-term bridge; refi at stabilization.
Rent comps 1 comps
| Address | Beds | Baths | Sqft | Rent | $/sqft | DOM | Units | Dist |
|---|---|---|---|---|---|---|---|---|
| 721 N Michigan St Elkhart, IN | 4.0 | 2.0 | 1952 | $2,499 | $1.28 | 20d | 1 | 0.46mi |
Listing history 40 events
-
2026-06-19days on market $179,900 Active 99 DOM
-
2026-06-18days on market $179,900 Active 98 DOM
-
2026-06-17days on market $179,900 Active 97 DOM
-
2026-06-16days on market $179,900 Active 96 DOM
-
2026-06-15days on market $179,900 Active 95 DOM
-
2026-06-14days on market $179,900 Active 93 DOM
-
2026-06-13remarks 693-char remark
-
2026-06-13days on market $179,900 Active 92 DOM
-
2026-06-10days on market $179,900 Active 90 DOM
-
2026-06-09days on market $179,900 Active 89 DOM
-
2026-06-08days on market $179,900 Active 88 DOM
-
2026-06-07days on market $179,900 Active 87 DOM
-
2026-06-05days on market $179,900 Active 84 DOM
-
2026-06-03days on market $179,900 Active 83 DOM
-
2026-06-03price $179,900 Active 82 DOM
-
2026-06-02days on market $184,900 Active 82 DOM
-
2026-06-01days on market $184,900 Active 81 DOM
-
2026-05-31days on market $184,900 Active 80 DOM
-
2026-05-30days on market $184,900 Active 79 DOM
-
2026-05-07price $184,900 461-char remark
Show marketing remark (461 chars)
Monthly cash flow and potential on this one! This four unit has lots of potential income, growth and many upgrades in the building have already been completed. The building features four apartments. . new roof in 2024 and windows in 2023, flooring, furnace (7yr) water heater (1yr) and kitchen upgrades throughout, the electric has been upgraded and individually metered. Broker Owned . .. Listing Agent is related to Seller Minimum 48 hour notice for showings.
-
2026-04-01price $189,900 461-char remark
Show marketing remark (461 chars)
Monthly cash flow and potential on this one! This four unit has lots of potential income, growth and many upgrades in the building have already been completed. The building features four apartments. . new roof in 2024 and windows in 2023, flooring, furnace (7yr) water heater (1yr) and kitchen upgrades throughout, the electric has been upgraded and individually metered. Broker Owned . .. Listing Agent is related to Seller Minimum 48 hour notice for showings.
-
2026-03-11$199,900 Active 461-char remark
Show marketing remark (461 chars)
Monthly cash flow and potential on this one! This four unit has lots of potential income, growth and many upgrades in the building have already been completed. The building features four apartments. . new roof in 2024 and windows in 2023, flooring, furnace (7yr) water heater (1yr) and kitchen upgrades throughout, the electric has been upgraded and individually metered. Broker Owned . .. Listing Agent is related to Seller Minimum 48 hour notice for showings.
-
2025-11-05historical $700
-
2025-10-14$700
-
2025-10-03historical $700
-
2025-09-18$700
-
2025-07-27historical $700
-
2025-07-05$700
-
2024-08-16historical $700
-
2024-07-31$700
-
2024-03-24historical $600
-
2024-02-23price $600
-
2023-11-06$650
-
2023-10-29historical $650
-
2023-10-20price $650
-
2023-09-03
-
2023-08-30historical
-
2022-11-18historical
-
2017-07-28soldstatus $21,600 255-char remark
Show marketing remark (255 chars)
Good rental history on this 4 unit. Currently rented for $1800 per month ($21,600/yr). Owner is selling his portfolio of 21 buildings. Subject to tenant's rights. Cash offers only! Wants them all gone by August 1st. Proof of funds required before showing
-
2017-06-01$24,900 255-char remark
Show marketing remark (255 chars)
Good rental history on this 4 unit. Currently rented for $1800 per month ($21,600/yr). Owner is selling his portfolio of 21 buildings. Subject to tenant's rights. Cash offers only! Wants them all gone by August 1st. Proof of funds required before showing
ⓘ Source: listings_history table (triggers on properties + properties_extension) + one-shot
backfill from property_details.listing_events for pre-trigger history.
Tax reassessment forecast IN · Partial reset (capped growth)
- Current annual tax
- $2,754 · $229/mo
- Projected year-2 tax
- $2,754 · $229/mo
- Expected delta
- $0/yr ($0/mo · 0.0%)
ⓘ Screening estimate from a state-policy table — verify with the county assessor before closing.
Climate risk First Street
- Flood 10/10 Extreme FEMA zone X (shaded) · 99% chance over 30 yrs
- Wildfire 1/10 Low
- Heat 3/10 Moderate 7 d/yr ≥101°F today · 16 d/yr by 30 yrs out
- Wind 2/10 Low
- Air quality 3/10 Moderate 2 unhealthy d/yr today · 3 by 30 yrs out
Nearby sold comps map
Loading sold comps map…
Walkable amenities ~0.75 mi
Loading nearby amenities…
Taxation est. · year 1
- Rental income
- $56,868
- − Mortgage interest
- −$10,077
- − Property taxes
- −$2,754
- − Insurance
- −$1,566
- − Repairs & maintenance
- −$4,549
- − Management
- −$4,549
- − Depreciation
- −$5,233
- Taxable income
- $28,139
- Est. tax owed @ 24.0%
- −$6,753
- After-tax cash flow
- $22,532/yr
For passive investors: Depreciation is non-cash, so a rental often shows a tax loss while cash-flowing — sheltering income. Rental losses are passive: they offset passive income freely, and up to $25,000/yr can offset ordinary (W-2) income if you actively participate and your MAGI is under $100k (phasing out to $0 by $150k); unused losses carry forward. On sale, claimed depreciation is recaptured at up to 25%, and gains may owe capital-gains tax (a 1031 exchange can defer both). Figures are a year-1 estimate at your 24.0% rate — not tax advice; consult a CPA.
Schools (NCES district)
- District
- Elkhart Community Schools
- NCES district ID
- 1803270
- Math proficiency
- 18% ▼ -12.00%
- Reading proficiency
- 25% ▼ -9.00%
- Median HH income
- $42,881
- Composite
- 18.45/100
- National rank
- #8928
- State rank
- #271 of 301 in IN
Livability — Elkhart
- Score
- 68/100
- State rank
- #224
- US rank
- #9852
Category grades
Schools grade is shown separately in the Schools card above.
Census & demographics
- Census place
- Elkhart, IN
- County
- Elkhart County · 107,928 people
- City population
- 74,260
- Metro
- Elkhart-Goshen, IN
- Population (ZIP)
- 31,871
- Household income
- $56,492
- Rent vs Own
- Severe rent burden
- 995.0
Population outlook (Elkhart County) Hauer SSP2
- Today (2025)
- 213,761 people
- By 2030
- 218,103 · +2.0%
- By 2040
- 225,381 · +5.4%
- By 2050
- 229,447 · +7.3%
- By 2075
- 232,856 · +8.9%
- By 2100
- 214,088 · +0.2%
Race, ethnicity, and origin ACS 2023
- Neighborhood character
- Diverse neighborhood (Simpson 0.56)
- Race & ethnicity
- White 60% Hispanic / Latino 26% Black 9% Two or more races 8% Asian 1%
- Hispanic origin (detail)
- Mexican 15%
- Common ancestry
- Romanian 2% Iranian 2% Lithuanian 2%
- Foreign-born
- 15% · Canada
- Languages at home
- 77% English-only · Spanish 19% Other Indo-European 3%
Political lean MEDSL · Elkhart
- 2024 margin
- Solid R (+32.4) · D 33.1% · R 65.5% · Other 1.4%
- 2008→2024 swing
- -21.2pp toward R · 2008: -11.2pp · 2024: -32.4pp
- All cycles
- 2024: R+32.4 2020: R+28.1 2016: R+32.4 2012: R+26.5 2008: R+11.2
Not yet ingested
- Civics
- —
Market trends
- HPI YoY
- ▼ -233.42%
- Current HPI
- 239.2508
- Rent YoY
- —
- Metro
- Elkhart-Goshen, IN
- State GDP YoY
- ▲ 2.90%
- F500 in state
- 18
Industry mix (Fortune 500 HQ in IN)
| Industry | F500 HQs | Revenue |
|---|---|---|
| Industrial Machinery | 2 | $37B |
|
||
| Healthcare | 1 | $177B |
|
||
| Pharmaceuticals | 1 | $45B |
|
||
| Metals / Steel | 1 | $18B |
|
||
| Agriculture | 1 | $17B |
|
||
| Packaging | 1 | $12B |
|
||
Price history
+642.6% since first listed21 events — show timeline
- 2026-05-07 Price Changed $184,900 IRMLS
- 2026-04-01 Price Changed $189,900 IRMLS
- 2026-03-11 Listed $199,900 IRMLS
- 2025-11-05 Rental Removed $700 APPFOLIO
- 2025-10-14 Listed for Rent $700 APPFOLIO
- 2025-10-03 Rental Removed $700 APPFOLIO
- 2025-09-18 Listed for Rent $700 APPFOLIO
- 2025-07-27 Rental Removed $700 APPFOLIO
- 2025-07-05 Listed for Rent $700 APPFOLIO
- 2024-08-16 Rental Removed $700 APPFOLIO
- 2024-07-31 Listed for Rent $700 APPFOLIO
- 2024-03-24 Rental Removed $600 BUILDIUM
- 2024-02-23 Price Changed $600 BUILDIUM
- 2023-11-06 Listed for Rent $650 BUILDIUM
- 2023-10-29 Rental Removed $650 BUILDIUM
- 2023-10-20 Price Changed $650 BUILDIUM
- 2023-09-03 Listed for Rent — BUILDIUM
- 2023-08-30 Rental Removed — BUILDIUM
- 2022-11-18 Rental Removed — BUILDIUM
- 2017-07-28 Sold (MLS) $21,600 IRMLS
- 2017-06-01 Listed $24,900 IRMLS
Property tax history
+1.6%/yrLatest (2025): $2,754 · +20.9% YoY. Source: county tax records.
Cash-flow waterfall
monthlySold comps — $/sqft
last 12 mo · ≤1 miLoading sold comps…