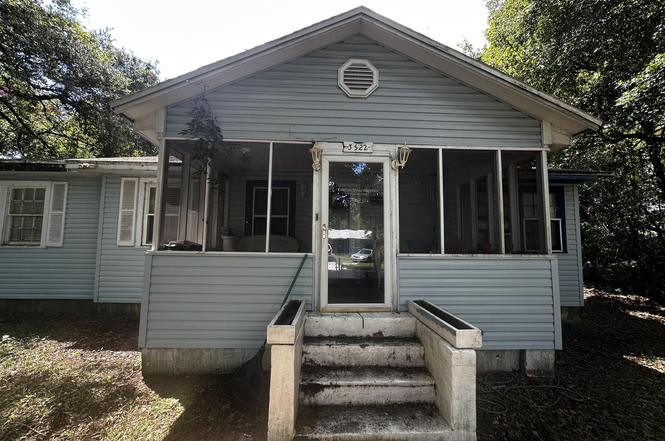
3522 Edison Ave · Jacksonville, FL
Flood risk 6/10 · Moderate
- FEMA flood zone
- X (unshaded)
- Chance of flooding over 30 yrs
- 0.72%
- Est. flood insurance / yr
- $507 – $1,088
Fire risk 1/10 · Minimal
- Est. fire insurance / yr
- $947 – $1,759
Heat risk 9/10 · Severe
- Hot days now (above 107°F)
- 7 days/yr
- Hot days in 30 yrs
- 20 days/yr
Wind risk 10/10 · Severe
- Chance of severe wind over 30 yrs
- 99.0%
Air-quality risk 5/10 · Moderate
- Unhealthy air days now
- 7 days/yr
- Unhealthy air days in 30 yrs
- 7 days/yr
Risk factors via First Street. Map © Google.
Why this score? — see what drove the B+ grade
The composite is a weighted blend of 9 inputs, each scored 0–100. Each bar is that input's sub-score; the figure is the points it added to the 100-point composite (weight × sub-score).
- Cash flow +30.0/30.0
- 1% rule +10.0/10.0
- DSCR +10.0/10.0
- ARV discount +7.5/15.0
- Appreciation +6.7/10.0
- Livability +4.2/5.0
- Schools +3.9/10.0
- Rent growth +2.9/5.0
- Condition / age +2.5/5.0
$40,000
🖨 Deal sheet 📄 Offer letter ✓ Due diligence
Listing remarks MLS
**************BANK REPO*********** 1 STORY BUNGALOW, FRAME CONSTRUCTION, FRONT PORCH. IN NEED OF REPAIRS, SELLING AS IS WHERE IS. SELLER HAS NO KNOWLEDGE OF LEAD BASE PAINT OR LBP HAZARDS. ALL OFFERS MUST HAVE PROOF OF FUNDS OR LENDER PRE QUAL LETTER. SPECIAL CONTRACT ADDENDUM REQUIRED. CALL LISTING AGENT TO FAX.
Key facts
- 0.36 acre lot
- Built 1928
Neighborhood map
What this means for you Summary
Snapshot
- This is a 3-bed/2.0-bath single-family listed at $40k.
Deal economics
- At list price, monthly cash flow is $870 ($10k/yr) — positive.
- The deal already cash-flows at list — no discount required.
- Meets the 1% rule at list price ($1k rent vs $40k).
- Cap rate 32.4% vs local median 4.0% in Jacksonville — top-decile yield for the area; either an underpriced asset or a hidden risk that comps aren't pricing in. Stress-test before assuming the spread holds.
Location & tenants
- Location reads 83/100 on livability (#50 in FL, #911 nationally) — a professional / high-income tenant draw. Strengths: amenities A+, commute A+, housing A+.
- Duval (urban): math 46% / reading 45% proficiency, ranked #48 of 73 in FL (top 66%) — families likely to look elsewhere, expect single-tenant / working-renter base with shorter leases.
- Market conditions: Rents rising (+1.7%/yr); 172 active listings in the ZIP; 40 comparable units currently listed for rent nearby; rentals at typical pace (median 24d on market — plan ~3-4 weeks tenant-placement turnaround); lower-income renter base — watch delinquency; 6,503 units permitted in Duval County in 2024 (1,131 in 5+ unit buildings).
- At $1,445/mo this rent would consume 50% of the median local household income ($35k/yr) (locally 882% of renters already pay >50% of income on rent) — very limited rent-growth headroom before tenants either downsize or default.
Forward outlook
- In year one you build about $2k of equity ($277 loan paydown + $1k appreciation (3.4% local appreciation)).
- Duval County population projected at +19% by 2050 — long-run rental-demand tailwind backs the buy-and-hold thesis.
- At projected returns (3.4% appreciation + 1.7% rent growth), your $11k cash investment doubles in ~1 year — after that, you're playing with house money.
Negotiation context
- Only 1 days on market — expect competitive offers; lowballing is unlikely to land.
- 2 sale attempts since 24y ago with the ask held roughly flat each time — persistent listings suggest the price (not the market) is what's stuck; bring a comps-based counter.
Risks & watch-outs
- Watch-outs: built in 1928 — expect roof / HVAC / electrical / plumbing capex.
- Climate carrying-cost: major flood risk; severe wind risk, 99% chance of damaging wind over 30y; extreme-heat days projected 7→20/yr by 2055 (HVAC capex compounding) — expect insurance premiums to compound above CPI over the hold.
Questions for the listing agent
- Built in 1928 — when were the roof, HVAC, electrical panel, plumbing, and water heater last replaced?
- Is there a deadline driving the sale (1031 exchange, divorce, estate, relocation)? That informs how much negotiation room exists.
- Schools are B-rated — typically a magnet for longer-tenancy family renters. What's the average tenant stay here, and is there a school-zone premium baked into asking?
- What's the average days-on-market for RENTAL listings here right now (not sales)? A rising rental-DOM trend means longer vacancies and softer asking-rent achievability than the comps imply.
- What's the recent tenant-quality profile in this submarket — average credit score on applications, eviction rate, late-payment / NSF rate, and stable-employment percentage? A property-management company in the area should have these aggregated.
- How much new for-sale + rental construction is in the pipeline within 1–3 miles? Heavy new supply typically softens prices + rents 12–24 months out; constrained supply supports both.
Investment metrics
- 1% rule
- 3.61% ✓
- Cap rate
- 32.39%
- Cash-on-cash
- 93.19%
- DSCR
- 5.15
- GRM
- 2.3
CMA / ARV
- ARV (on-the-fly)
- $211,200
- Comps found
- 12
Show comp detail 12 sales within ~0.75 mi
| Address | Dist | Beds/Ba | Sqft | Sold | Price | $/sf | Match |
|---|---|---|---|---|---|---|---|
| 470 Winter St | 0.20mi | 3/2.0 | 1,340 (+2%) | 3mo | $215,000 | $160 | 86 |
| 3329 Nolan St | 0.16mi | 3/2.0 | 1,442 (+9%) | 4mo | $76,500 | $53 | 74 |
| 4014 Dellwood Ave | 0.46mi | 3/2.0 | 1,288 (-2%) | 5mo | $152,000 | $118 | 71 |
| 3127 Dignan St | 0.42mi | 3/2.0 | 1,197 (-9%) | 2mo | $210,000 | $175 | 63 |
| 2908 Broadway Ave | 0.71mi | 3/2.5 | 1,268 (-4%) | 1mo | $185,000 | $146 | 58 |
| 560 Comet St | 0.56mi | 3/2.0 | 1,190 (-10%) | 1mo | $270,000 | $227 | 57 |
| 4614 Hunt St | 0.60mi | 3/2.0 | 1,196 (-9%) | 1mo | $223,000 | $186 | 56 |
| 156 Willow Branch Ave | 0.74mi | 4/2.0 (+1) | 1,268 (-4%) | 0mo | $105,000 | $83 | 54 |
| 3502 Dellwood Ave | 0.40mi | 3/1.0 | 1,131 (-14%) | 2mo | $155,000 | $137 | 51 |
| 4055 Myra St | 0.52mi | 3/1.0 | 1,176 (-11%) | 5mo | $229,500 | $195 | 49 |
| 2989 Rexford St | 0.63mi | 4/2.0 (+1) | 1,148 (-13%) | 6mo | $223,020 | $194 | 39 |
| 3151 Sunnybrook Ct | 0.70mi | 4/2.0 (+1) | 1,516 (+15%) | 4mo | $199,000 | $131 | 34 |
Match score weights: distance 35% · size 25% · config 20% · recency 20%. Top-matched comps best support the ARV.
Projected returns pro-forma
3.41% appreciation · 1.7% rent growth · sell at horizon
- IRR
- 96.3%
- Equity multiple
- 6.29×
- Total profit
- $59,248
- Equity at exit
- $18,923
- IRR
- 95.4%
- Equity multiple
- 12.59×
- Total profit
- $129,800
- Equity at exit
- $29,912
Cash invested: $11,200 (down + closing). Projections, not guarantees.
Landlord ↔ Tenant lean methodology
- Overall (STATE)
- 87 Strongly Landlord-Friendly
- State Florida
- 87 Strongly Landlord-Friendly · R+3
- County
- — inherits STATE
- City
- — inherits STATE
ZIP-level market 32254
- Home prices YoY
- 1.2%
- Rents YoY
- 1.7%
- Active inventory
- 172
- Price-to-rent
- 2.3×
Monthly cashflow live
- Estimated rent
- $1,445 high interval (Pro) →
- Mortgage (P&I)
- −$210
- Tax from tax record
- −$45 /mo · $545/yr
- Insurance
- −$17
- HOA
- −$0
- Vacancy / Maint / Mgmt
- −$303
- Net cashflow
- $870
Break-even live
UW: 25.0% down · 7.5% · 30yr · 1.5% tax · 5.0% vac · 8.0% maint · 8.0% mgmt
Financing live
Cash to close
- Down payment
- $10,000
- Closing costs
- $1,200
- Reserves months
- —
- Total cash needed
- —
Loan-product check · same deal, 3 products live
Conventional
25% down · 7.5% · 30yr
- Down + closing
- —
- Monthly P&I
- —
- Monthly cashflow
- —
- DSCR
- —
- Eligible?
- —
Personal DTI + credit; lowest rate.
DSCR
20% down · 8.5% · 30yr
- Down + closing
- —
- Monthly P&I
- —
- Monthly cashflow
- —
- DSCR
- —
- Eligible?
- —
No personal income docs; deal must DSCR.
Hard money
10% down · 12.0% · 12mo
- Down + closing
- —
- Monthly P&I
- —
- Monthly cashflow
- —
- DSCR
- —
- Eligible?
- —
Short-term bridge; refi at stabilization.
Rent comps 40 comps
| Address | Beds | Baths | Sqft | Rent | $/sqft | DOM | Units | Dist |
|---|---|---|---|---|---|---|---|---|
| 3550 Edison Ave Jacksonville, FL | 3.0 | 2.0 | 1230 | $1,463 | $1.19 | 4d | 1 | 0.04mi |
| 3356 Lenox Ave Jacksonville, FL | 2.0 | 1.0 | 899 | $999 | $1.11 | 23d | 1 | 0.12mi |
| 3515 Dignan St Jacksonville, FL | 3.0 | 1.0 | 915 | $1,036 | $1.13 | 3d | 1 | 0.14mi |
| 3319 Hunt St Jacksonville, FL | 3.0 | 1.0 | 924 | $1,295 | $1.40 | 23d | 1 | 0.16mi |
| 3323 Nolan St Jacksonville, FL | 3.0 | 1.0 | 927 | $1,050 | $1.13 | 2d | 1 | 0.17mi |
| 3352 Dillon St Jacksonville, FL | 3.0 | 2.0 | 1229 | $1,372 | $1.12 | 23d | 1 | 0.17mi |
| 3318 Dignan St Jacksonville, FL | 3.0 | 2.0 | 960 | $1,200 | $1.25 | 23d | 1 | 0.19mi |
| 3688 Dillon St Jacksonville, FL | 3.0 | 2.0 | 1230 | $1,421 | $1.16 | 23d | 1 | 0.20mi |
| 3347 Phyllis St Jacksonville, FL | 3.0 | 2.0 | 1145 | $1,395 | $1.22 | 23d | 1 | 0.23mi |
| 676 Bridal Ave Jacksonville, FL | 3.0 | 2.0 | 1008 | $1,450 | $1.44 | 23d | 1 | 0.29mi |
| 691 Herman St Jacksonville, FL | 4.0 | 2.5 | 1641 | $1,669 | $1.02 | 7d | 1 | 0.30mi |
| 3159 Phyllis St Jacksonville, FL | 3.0 | 2.0 | 1209 | $1,561 | $1.29 | 3d | 1 | 0.39mi |
| 3609 Dellwood Ave Jacksonville, FL | 2.0 | 2.0 | 936 | $1,495 | $1.60 | 23d | 1 | 0.41mi |
| 3353 Dellwood Ave Jacksonville, FL | 3.0 | 1.0 | 934 | $1,595 | $1.71 | 17d | 1 | 0.42mi |
| 3312 Ernest St Jacksonville, FL | 3.0 | 1.0 | 1065 | $1,148 | $1.08 | 23d | 1 | 0.42mi |
| 3118 Dignan St Jacksonville, FL | 4.0 | 2.0 | 1103 | $1,148 | $1.04 | 2d | 1 | 0.43mi |
| 3134 Phyllis St Jacksonville, FL | 4.0 | 2.0 | 1648 | $1,834 | $1.11 | 23d | 1 | 0.45mi |
| 3233 Dellwood Ave Jacksonville, FL | 2.0 | 2.0 | 1000 | $1,750 | $1.75 | 23d | 1 | 0.48mi |
| 3313 Green St Jacksonville, FL | 3.0 | 1.0 | 1058 | $1,450 | $1.37 | 7d | 1 | 0.53mi |
| 3035 Fitzgerald St Jacksonville, FL | 2.0 | 1.0 | 900 | $1,021 | $1.13 | 3d | 1 | 0.55mi |
| 628 Meteor St Jacksonville, FL | 3.0 | 1.0 | 1123 | $1,395 | $1.24 | 23d | 1 | 0.62mi |
| 4006 College St Jacksonville, FL | 3.0 | 2.5 | 1200 | $2,200 | $1.83 | 23d | 1 | 0.63mi |
| 4006 College St Jacksonville, FL | 3.0 | 2.5 | 1208 | $2,200 | $1.82 | 12d | 1 | 0.63mi |
| 3352 College St Jacksonville, FL | 3.0 | 2.0 | 1335 | $1,550 | $1.16 | 14d | 1 | 0.64mi |
| 3302 College St Jacksonville, FL | 3.0 | 1.0 | 1174 | $1,095 | $0.93 | 7d | 1 | 0.66mi |
| 2980 Ernest St Jacksonville, FL | 2.0 | 1.0 | 920 | $1,200 | $1.30 | 23d | 1 | 0.72mi |
| 3036 Green St Jacksonville, FL | 3.0 | 1.0 | 924 | $1,495 | $1.62 | 23d | 1 | 0.73mi |
| 809 McDuff Ave S Jacksonville, FL | 2.0 | 1.0 | 1006 | $995 | $0.99 | 4d | 1 | 0.73mi |
| 3012 Imperial St Jacksonville, FL | 3.0 | 1.0 | 1089 | $1,395 | $1.28 | 23d | 1 | 0.75mi |
| 1035 Congleton Ter Jacksonville, FL | 3.0 | 2.0 | 1180 | $2,400 | $2.03 | 2d | 1 | 0.75mi |
| 841 Ontario St Jacksonville, FL | 2.0 | 1.0 | 1000 | $1,285 | $1.28 | 23d | 1 | 0.79mi |
| 4650 Buxton St Jacksonville, FL | 3.0 | 2.0 | 1620 | $1,925 | $1.19 | 4d | 1 | 0.79mi |
| 3305 Sunnybrook Ave N Jacksonville, FL | 2.0 | 1.0 | 1012 | $1,021 | $1.01 | 23d | 1 | 0.81mi |
| 912 Huron St Jacksonville, FL | 2.0 | 1.0 | 900 | $1,100 | $1.22 | 14d | 1 | 0.83mi |
| 3350 Sunnybrook Ave N Jacksonville, FL | 2.0 | 1.0 | 900 | $1,095 | $1.22 | 23d | 1 | 0.84mi |
| 2587 Orchard St Jacksonville, FL | 2.0 | 2.0 | 992 | $1,295 | $1.31 | 7d | 1 | 0.86mi |
| 3303 Broadway Ave Jacksonville, FL | 3.0 | 2.0 | 1072 | $1,550 | $1.45 | 4d | 1 | 0.91mi |
| 420 Sunshine St Jacksonville, FL | 3.0 | 2.0 | 1050 | $1,350 | $1.29 | 2d | 1 | 0.91mi |
| 2410 McQuade St Jacksonville, FL | 3.0 | 2.0 | 1307 | $1,425 | $1.09 | 23d | 1 | 0.93mi |
| 2812 Ernest St Jacksonville, FL | 3.0 | 1.0 | 1461 | $2,800 | $1.92 | 23d | 1 | 0.94mi |
Listing history 6 events
-
2025-09-18status Pending
-
2025-09-18$40,000 Active
-
2002-09-09soldstatus $75,000
-
2002-06-25soldstatus $24,700 314-char remark
Show marketing remark (314 chars)
**************BANK REPO*********** 1 STORY BUNGALOW, FRAME CONSTRUCTION, FRONT PORCH. IN NEED OF REPAIRS, SELLING AS IS WHERE IS. SELLER HAS NO KNOWLEDGE OF LEAD BASE PAINT OR LBP HAZARDS. ALL OFFERS MUST HAVE PROOF OF FUNDS OR LENDER PRE QUAL LETTER. SPECIAL CONTRACT ADDENDUM REQUIRED. CALL LISTING AGENT TO FAX.
-
2002-05-24$23,900 314-char remark
Show marketing remark (314 chars)
**************BANK REPO*********** 1 STORY BUNGALOW, FRAME CONSTRUCTION, FRONT PORCH. IN NEED OF REPAIRS, SELLING AS IS WHERE IS. SELLER HAS NO KNOWLEDGE OF LEAD BASE PAINT OR LBP HAZARDS. ALL OFFERS MUST HAVE PROOF OF FUNDS OR LENDER PRE QUAL LETTER. SPECIAL CONTRACT ADDENDUM REQUIRED. CALL LISTING AGENT TO FAX.
-
2000-01-13soldstatus $72,000
ⓘ Source: listings_history table (triggers on properties + properties_extension) + one-shot
backfill from property_details.listing_events for pre-trigger history.
Tax reassessment forecast FL · Resets to sale price
- Current annual tax
- $545 · $45/mo
- Projected year-2 tax
- $545 · $45/mo
- Expected delta
- $0/yr ($0/mo · 0.0%)
ⓘ Screening estimate from a state-policy table — verify with the county assessor before closing.
Climate risk First Street
- Flood 6/10 Major FEMA zone X (unshaded) · 72% chance over 30 yrs
- Wildfire 1/10 Low
- Heat 9/10 Extreme 7 d/yr ≥107°F today · 20 d/yr by 30 yrs out
- Wind 10/10 Extreme 99% chance of damaging wind over 30 yrs
- Air quality 5/10 Major 7 unhealthy d/yr today · 7 by 30 yrs out
Nearby sold comps map
Loading sold comps map…
Walkable amenities ~0.75 mi
Loading nearby amenities…
Taxation est. · year 1
- Rental income
- $17,341
- − Mortgage interest
- −$2,241
- − Property taxes
- −$545
- − Insurance
- −$200
- − Repairs & maintenance
- −$1,387
- − Management
- −$1,387
- − Depreciation
- −$1,164
- Taxable income
- $10,417
- Est. tax owed @ 24.0%
- −$2,500
- After-tax cash flow
- $7,937/yr
For passive investors: Depreciation is non-cash, so a rental often shows a tax loss while cash-flowing — sheltering income. Rental losses are passive: they offset passive income freely, and up to $25,000/yr can offset ordinary (W-2) income if you actively participate and your MAGI is under $100k (phasing out to $0 by $150k); unused losses carry forward. On sale, claimed depreciation is recaptured at up to 25%, and gains may owe capital-gains tax (a 1031 exchange can defer both). Figures are a year-1 estimate at your 24.0% rate — not tax advice; consult a CPA.
Schools (NCES district)
- District
- Duval
- NCES district ID
- 1200480
- Math proficiency
- 46% ▼ -11.00%
- Reading proficiency
- 45% ▼ -4.00%
- Median HH income
- $48,987
- Composite
- 38.97/100
- National rank
- #4076
- State rank
- #48 of 73 in FL
Livability — Jacksonville
- Score
- 83/100
- State rank
- #50
- US rank
- #911
Category grades
Schools grade is shown separately in the Schools card above.
Census & demographics
- Census place
- Jacksonville, FL
- County
- Duval County · 1,015,274 people
- City population
- 979,034
- Metro
- Jacksonville, FL
- Population (ZIP)
- 13,927
- Household income
- $34,953
- Rent vs Own
- Severe rent burden
- 882.0
Population outlook (Duval County) Hauer SSP2
- Today (2025)
- 1,013,010 people
- By 2030
- 1,059,228 · +4.6%
- By 2040
- 1,141,439 · +12.7%
- By 2050
- 1,205,258 · +19.0%
- By 2075
- 1,324,282 · +30.7%
- By 2100
- 1,319,620 · +30.3%
Race, ethnicity, and origin ACS 2023
- Neighborhood character
- Diverse neighborhood (Simpson 0.56)
- Race & ethnicity
- Black 60% White 28% Two or more races 7% Hispanic / Latino 5%
- Hispanic origin (detail)
- Puerto Rican 1%
- Common ancestry
- Slovak 1% Hispanic 1% Lithuanian 1%
- Foreign-born
- 4% · Canada
- Languages at home
- 94% English-only · Spanish 4% French/Haitian/Cajun 2%
Political lean MEDSL · Duval
- 2024 margin
- Toss-up / Even · D 48.7% · R 50.1% · Other 1.2%
- 2008→2024 swing
- +0.4pp no change · 2008: -1.9pp · 2024: -1.5pp
- All cycles
- 2024: R+1.5 2020: D+3.8 2016: R+1.5 2012: R+3.6 2008: R+1.9
Not yet ingested
- Civics
- —
Market trends
- HPI YoY
- ▲ 3.41%
- Current HPI
- 282.2981
- Rent YoY
- ▲ 1.70%
- Metro
- Jacksonville, FL
- State GDP YoY
- ▲ 3.28%
- F500 in state
- 36
Industry mix (Fortune 500 HQ in FL)
| Industry | F500 HQs | Revenue |
|---|---|---|
| Industrial Technology | 2 | $29B |
|
||
| Insurance | 2 | $17B |
|
||
| Retail | 1 | $60B |
|
||
| Technology Distribution | 1 | $58B |
|
||
| Homebuilding | 1 | $35B |
|
||
| Technology Manufacturing | 1 | $35B |
|
||
Price history
-44.4% since first listed6 events — show timeline
- 2025-09-18 Pending — realMLS
- 2025-09-18 Listed $40,000 realMLS
- 2002-09-09 Sold (Public Records) $75,000 Public Records
- 2002-06-25 Sold (MLS) $24,700 realMLS
- 2002-05-24 Listed $23,900 realMLS
- 2000-01-13 Sold (Public Records) $72,000 Public Records
Property tax history
+3.3%/yrLatest (2025): $545 · +52.7% YoY. Source: county tax records.
Cash-flow waterfall
monthlySold comps — $/sqft
last 12 mo · ≤1 miLoading sold comps…