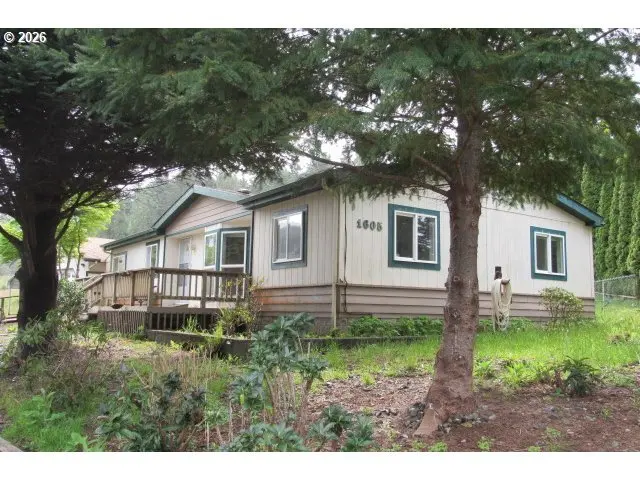
1605 Kristi Loop · Lakeside, OR
Flood risk 1/10 · Minimal
- FEMA flood zone
- X (unshaded)
- Chance of flooding over 30 yrs
- 0.0%
- Est. flood insurance / yr
- $507 – $1,088
Fire risk 1/10 · Minimal
- Est. fire insurance / yr
- $498 – $926
Heat risk 1/10 · Minimal
- Hot days now (above 81°F)
- 6 days/yr
- Hot days in 30 yrs
- 13 days/yr
Wind risk 1/10 · Minimal
- Chance of severe wind over 30 yrs
- —
Air-quality risk 6/10 · Moderate
- Unhealthy air days now
- 8 days/yr
- Unhealthy air days in 30 yrs
- 8 days/yr
Risk factors via First Street. Map © Google.
Why this score? — see what drove the B- grade
The composite is a weighted blend of 9 inputs, each scored 0–100. Each bar is that input's sub-score; the figure is the points it added to the 100-point composite (weight × sub-score).
- Cash flow +21.4/30.0
- ARV discount +15.0/15.0
- DSCR +6.8/10.0
- Appreciation +5.5/10.0
- 1% rule +4.9/10.0
- Schools +3.3/10.0
- Livability +3.2/5.0
- Rent growth +2.5/5.0
- Condition / age +2.5/5.0
$200,000
🖨 Deal sheet 📄 Offer letter ✓ Due diligence
Listing remarks MLS
LOVELY 3 BR 2 BA MANUFACTURED HOME IN VERY NICE LAKESIDE AREA. DOUBLE GARAGE, COVERED WALKWAY FROM HOME TO GARAGE. EXCELLENT CONDITION. EASY TO SHOW
Key facts
- 9,583 sq ft lot
- 2 garage spots
- Built 1996
Property features AI
Finance
- Other: Lot approximately 0.22 acre (7,000–9,999 sq ft range); Property offers mountain views; Main level area reported as 1,404 (assessor)
- HOA & community: Not a senior community
Exterior
- Parking: Driveway and parking pad; Detached 2-car garage; RV parking
- Utilities: Public water; Public sewer; Electric hot water; Electric fuel/power
- Home design: Manufactured home on real property; Residential resale; Main living all on one level; 1996 construction
- Construction: Composition roof; Built in 1996; Crawl space foundation
- Exterior features: Outbuilding on property; Wood composite exterior; Paved road access; Level lot; Mountain views
Interior
- Kitchen: Kitchen with island
- Bedrooms: Primary bedroom on main level with attached bathroom; Second bedroom on main level; Third bedroom on main level
- Flooring: Tile; Carpet
- Bathrooms: Two bathrooms (including partials)
- Heating & cooling: Forced-air heating; No central cooling
- Interior features: One-level accessibility; Tile flooring; Wall-to-wall carpet; Double-pane windows with vinyl frames; Crawl space
- Laundry & utility: Main-level laundry
Neighborhood map
What this means for you Summary
Snapshot
- This is a 3-bed/2.0-bath manufactured listed at $200k.
Deal economics
- At list price, monthly cash flow is $296 ($4k/yr) — positive.
- The deal already cash-flows at list — no discount required.
- To meet the 1% rule (rent ≥ 1% of price), the offer needs to be $198k (1.0% below list).
- Recommended offer: $198k (1.0% below list) — sets the bar for 1% rule.
- Cap rate 8.1% vs local median 3.7% in Lakeside — top-decile yield for the area; either an underpriced asset or a hidden risk that comps aren't pricing in. Stress-test before assuming the spread holds.
Location & tenants
- Location reads 64/100 on livability (#215 in OR) — a middle-class / working-renter tenant base. Strengths: crime A+, housing A+, cost of living A; Watch: health & safety C-, employment D+, amenities F.
- North Bend SD 13 (town): math 30% / reading 47% proficiency, ranked #21 of 58 in OR (top 36%) — families likely to look elsewhere, expect single-tenant / working-renter base with shorter leases.
- Zoned schools: North Bay Elementary School (math 34% / reading 42%, grade F, #197 of 412 statewide, top 48%, 443 students, 69% FRL); North Bend Middle School (math 24% / reading 45%, grade F, #61 of 128 statewide, top 54%, 494 students, 68% FRL); North Bend Senior High School (math 75% / reading 75%, grade A-, #2 of 143 statewide, top 6%, 731 students, 30% FRL) — zoned schools average 56% FRL vs 40% district-wide (16 pts higher); higher-poverty schools than district average — tighter screening recommended.
- Market conditions: 85 active listings in the ZIP; 122 units permitted in Coos County in 2024 (16 in 5+ unit buildings).
Forward outlook
- In year one you build about $3k of equity ($1k loan paydown + $2k appreciation (0.9% local appreciation)).
- Coos County population projected to shrink 9% by 2050 — rents likely to lag national; underwrite the cash flow, not the appreciation.
- At projected returns (0.9% appreciation + 3.0% rent growth), your $56k cash investment doubles in ~7 years — after that, you're playing with house money.
- By year 9, paydown + projected appreciation supports a ~$30k cash-out refi (75% LTV) — recoverable capital for the next deal without selling this one.
Negotiation context
- Only 10 days on market — expect competitive offers; lowballing is unlikely to land.
- 3 sale attempts since 25y ago with the ask held roughly flat each time — persistent listings suggest the price (not the market) is what's stuck; bring a comps-based counter.
Questions for the listing agent
- Is there a deadline driving the sale (1031 exchange, divorce, estate, relocation)? That informs how much negotiation room exists.
- Schools are F-rated, which usually means shorter tenancies and higher turnover. Who's the typical renter profile here, and what's been the actual vacancy rate?
- What's the average days-on-market for RENTAL listings here right now (not sales)? A rising rental-DOM trend means longer vacancies and softer asking-rent achievability than the comps imply.
- What's the recent tenant-quality profile in this submarket — average credit score on applications, eviction rate, late-payment / NSF rate, and stable-employment percentage? A property-management company in the area should have these aggregated.
- How much new for-sale + rental construction is in the pipeline within 1–3 miles? Heavy new supply typically softens prices + rents 12–24 months out; constrained supply supports both.
Investment metrics
- 1% rule
- 0.99% ✗
- Cap rate
- 8.07%
- Cash-on-cash
- 6.34%
- DSCR
- 1.28
- GRM
- 8.4
CMA / ARV
- ARV (median comp)
- $289,058
- List price
- $200,000
- Delta
- -30.81%
- Verdict
- UNDERPRICED
- Comps
- 20 within 1.0 mi
Show comp detail 11 sales within ~0.75 mi
| Address | Dist | Beds/Ba | Sqft | Sold | Price | $/sf | Match |
|---|---|---|---|---|---|---|---|
| 590 Kings Ave | 0.07mi | 2/2.0 (-1) | 1,440 (+3%) | 1mo | $249,000 | $173 | 86 |
| 400 Robinhood Ave | 0.27mi | 3/2.0 | 1,404 (0%) | 20mo | $325,000 | $231 | 71 |
| 660 Royal Dr | 0.33mi | 2/2.0 (-1) | 1,404 (0%) | 22mo | $258,000 | $184 | 61 |
| 555 N 8th St | 0.50mi | 3/2.0 | 1,296 (-8%) | 6mo | $399,500 | $308 | 59 |
| 480 Rugh Ln | 0.55mi | 3/2.0 | 1,466 (+4%) | 21mo | $272,500 | $186 | 49 |
| 1060 Cedar Loop | 0.60mi | 2/2.0 (-1) | 1,566 (+12%) | 2mo | $435,000 | $278 | 46 |
| 920 Nye Ct | 0.67mi | 2/2.0 (-1) | 1,404 (0%) | 22mo | $325,000 | $231 | 46 |
| 740 Sherwood St | 0.28mi | 2/1.0 (-1) | 1,270 (-10%) | 24mo | $260,000 | $205 | 42 |
| 1035 Nye Ct | 0.72mi | 3/2.0 | 1,296 (-8%) | 19mo | $282,500 | $218 | 38 |
| 405 Stanley Ln | 0.73mi | 3/2.0 | 1,248 (-11%) | 20mo | $200,000 | $160 | 30 |
| 430 Rugh Ln | 0.68mi | 2/2.0 (-1) | 1,248 (-11%) | 24mo | $243,800 | $195 | 25 |
Match score weights: distance 35% · size 25% · config 20% · recency 20%. Top-matched comps best support the ARV.
Projected returns pro-forma
0.92% appreciation · 3.0% rent growth · sell at horizon
- IRR
- 7.7%
- Equity multiple
- 1.39×
- Total profit
- $21,782
- Equity at exit
- $67,473
- IRR
- 11.8%
- Equity multiple
- 2.42×
- Total profit
- $79,691
- Equity at exit
- $89,047
Cash invested: $56,000 (down + closing). Projections, not guarantees.
Landlord ↔ Tenant lean methodology
- Overall (STATE)
- 28 Tenant-Leaning
- State Oregon
- 28 Tenant-Leaning · D+6
- County
- — inherits STATE
- City
- — inherits STATE
ZIP-level market 97449
- Home prices YoY
- 0.5%
- Active inventory
- 85
- Price-to-rent
- 8.4×
Monthly cashflow live
- Estimated rent
- $1,980 medium interval (Pro) →
- Mortgage (P&I)
- −$1,049
- Tax from tax record
- −$137 /mo · $1,639/yr
- Insurance
- −$83
- HOA
- −$0
- Vacancy / Maint / Mgmt
- −$416
- Net cashflow
- $296
Break-even live
UW: 25.0% down · 7.5% · 30yr · 1.5% tax · 5.0% vac · 8.0% maint · 8.0% mgmt
Financing live
Cash to close
- Down payment
- $50,000
- Closing costs
- $6,000
- Reserves months
- —
- Total cash needed
- —
Loan-product check · same deal, 3 products live
Conventional
25% down · 7.5% · 30yr
- Down + closing
- —
- Monthly P&I
- —
- Monthly cashflow
- —
- DSCR
- —
- Eligible?
- —
Personal DTI + credit; lowest rate.
DSCR
20% down · 8.5% · 30yr
- Down + closing
- —
- Monthly P&I
- —
- Monthly cashflow
- —
- DSCR
- —
- Eligible?
- —
No personal income docs; deal must DSCR.
Hard money
10% down · 12.0% · 12mo
- Down + closing
- —
- Monthly P&I
- —
- Monthly cashflow
- —
- DSCR
- —
- Eligible?
- —
Short-term bridge; refi at stabilization.
Listing history 8 events
-
2026-05-11$200,000 Active 444-char remark
-
2006-09-12soldstatus $195,000 151-char remark
Show marketing remark (151 chars)
LOVELY 3 BR 2 BA MANUFACTURED HOME IN VERY NICE LAKESIDE AREA. DOUBLE GARAGE, COVERED WALKWAY FROM HOME TO GARAGE. EXCELLENT CONDITION. EASY TO SHOW
-
2006-09-06soldstatus $195,000
-
2006-07-24historical 151-char remark
Show marketing remark (151 chars)
LOVELY 3 BR 2 BA MANUFACTURED HOME IN VERY NICE LAKESIDE AREA. DOUBLE GARAGE, COVERED WALKWAY FROM HOME TO GARAGE. EXCELLENT CONDITION. EASY TO SHOW
-
2006-03-07$199,500 151-char remark
Show marketing remark (151 chars)
LOVELY 3 BR 2 BA MANUFACTURED HOME IN VERY NICE LAKESIDE AREA. DOUBLE GARAGE, COVERED WALKWAY FROM HOME TO GARAGE. EXCELLENT CONDITION. EASY TO SHOW
-
2001-04-05soldstatus $120,000
-
2001-04-04soldstatus $120,000
Show marketing remark (101 chars)
NEAR NEW DBL WD MFGD HOME IN BEAUTIFUL SUBDIVISION. CLOSE TO LAKES, DUNES AND BEAUTIFULLY MAINTAINED.
-
2001-02-08$129,000
Show marketing remark (101 chars)
NEAR NEW DBL WD MFGD HOME IN BEAUTIFUL SUBDIVISION. CLOSE TO LAKES, DUNES AND BEAUTIFULLY MAINTAINED.
ⓘ Source: listings_history table (triggers on properties + properties_extension) + one-shot
backfill from property_details.listing_events for pre-trigger history.
Tax reassessment forecast OR · Resets to sale price
- Current annual tax
- $1,639 · $137/mo
- Projected year-2 tax
- $1,940 · $162/mo
- Expected delta
- +$301/yr (+$25/mo · 18.4%)
ⓘ Screening estimate from a state-policy table — verify with the county assessor before closing.
Climate risk First Street
- Flood 1/10 Low FEMA zone X (unshaded) · 0% chance over 30 yrs
- Wildfire 1/10 Low
- Heat 1/10 Low 6 d/yr ≥81°F today · 13 d/yr by 30 yrs out
- Wind 1/10 Low
- Air quality 6/10 Major 8 unhealthy d/yr today · 8 by 30 yrs out
Nearby sold comps map
Loading sold comps map…
Walkable amenities ~0.75 mi
Loading nearby amenities…
Taxation est. · year 1
- Rental income
- $23,764
- − Mortgage interest
- −$11,203
- − Property taxes
- −$1,639
- − Insurance
- −$1,000
- − Repairs & maintenance
- −$1,901
- − Management
- −$1,901
- − Depreciation
- −$5,818
- Taxable income
- $302
- Est. tax owed @ 24.0%
- −$72
- After-tax cash flow
- $3,477/yr
For passive investors: Depreciation is non-cash, so a rental often shows a tax loss while cash-flowing — sheltering income. Rental losses are passive: they offset passive income freely, and up to $25,000/yr can offset ordinary (W-2) income if you actively participate and your MAGI is under $100k (phasing out to $0 by $150k); unused losses carry forward. On sale, claimed depreciation is recaptured at up to 25%, and gains may owe capital-gains tax (a 1031 exchange can defer both). Figures are a year-1 estimate at your 24.0% rate — not tax advice; consult a CPA.
Schools (NCES district)
- District
- North Bend SD 13
- NCES district ID
- 4108820
- Math proficiency
- 30% ▼ -3.00%
- Reading proficiency
- 47% ▼ -6.00%
- Median HH income
- $43,614
- Composite
- 32.57/100
- National rank
- #5681
- State rank
- #21 of 58 in OR
Livability — Lakeside
- Score
- 64/100
- State rank
- #215
- US rank
- #14610
Category grades
Schools grade is shown separately in the Schools card above.
Census & demographics
- Census place
- Lakeside, OR
- Population (ZIP)
- 2,200
Population outlook (Coos County) Hauer SSP2
- Today (2025)
- 62,222 people
- By 2030
- 61,120 · -1.8%
- By 2040
- 58,478 · -6.0%
- By 2050
- 56,819 · -8.7%
- By 2075
- 54,915 · -11.7%
- By 2100
- 51,403 · -17.4%
Race, ethnicity, and origin ACS 2023
- Neighborhood character
- Predominantly White (86%)
- Race & ethnicity
- White 86% Two or more races 11% Hispanic / Latino 5% Native American 2%
- Common ancestry
- Portuguese 4% Italian 4% Romanian 2%
- Foreign-born
- 2% · Canada
- Languages at home
- 97% English-only · Other Indo-European 2%
Political lean MEDSL · Coos
- 2024 margin
- R (+19.9) · D 38.7% · R 58.5% · Other 2.8%
- 2008→2024 swing
- -16.8pp toward R · 2008: -3.1pp · 2024: -19.9pp
- All cycles
- 2024: R+19.9 2020: R+20.5 2016: R+24.3 2012: R+6.3 2008: R+3.1
Not yet ingested
- Civics
- —
Market trends
- HPI YoY
- ▲ 0.92%
- Current HPI
- 190.1581
- Rent YoY
- —
- Metro
- —
- State GDP YoY
- ▲ 2.05%
- F500 in state
- 2
Industry mix (Fortune 500 HQ in OR)
| Industry | F500 HQs | Revenue |
|---|---|---|
| Consumer Goods | 1 | $51B |
|
||
Price history
+55.0% since first listed9 events — show timeline
- 2026-05-21 Pending — RMLS
- 2026-05-11 Listed $200,000 RMLS
- 2006-09-12 Sold (MLS) $195,000 RMLS
- 2006-09-06 Sold (Public Records) $195,000 Public Records
- 2006-07-24 Delisted — RMLS
- 2006-03-07 Listed $199,500 RMLS
- 2001-04-05 Sold (Public Records) $120,000 Public Records
- 2001-04-04 Sold (MLS) $120,000 RMLS
- 2001-02-08 Listed $129,000 RMLS
Property tax history
+1.7%/yrLatest (2025): $1,639 · +0.8% YoY. Source: county tax records.
Cash-flow waterfall
monthlySold comps — $/sqft
last 12 mo · ≤1 miLoading sold comps…