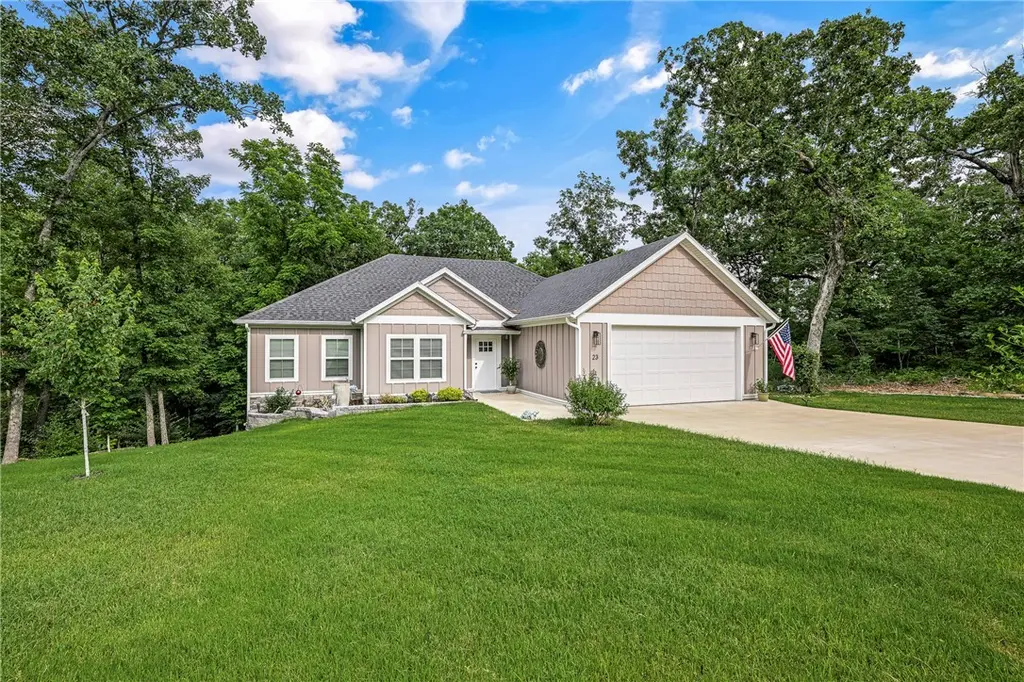
23 Chaucer Dr · Bella Vista, AR
Flood risk 1/10 · Minimal
- FEMA flood zone
- X (unshaded)
- Chance of flooding over 30 yrs
- 0.0%
- Est. flood insurance / yr
- $507 – $1,088
Fire risk 4/10 · Minor
- Est. fire insurance / yr
- $1,499 – $2,785
Heat risk 5/10 · Moderate
- Hot days now (above 105°F)
- 7 days/yr
- Hot days in 30 yrs
- 20 days/yr
Wind risk 2/10 · Minimal
- Chance of severe wind over 30 yrs
- 2.0%
Air-quality risk 2/10 · Minimal
- Unhealthy air days now
- 0 days/yr
- Unhealthy air days in 30 yrs
- 1 days/yr
Risk factors via First Street. Map © Google.
Why this score? — see what drove the D- grade
The composite is a weighted blend of 9 inputs, each scored 0–100. Each bar is that input's sub-score; the figure is the points it added to the 100-point composite (weight × sub-score).
- Cash flow +8.7/30.0
- Appreciation +5.7/10.0
- ARV discount +5.4/15.0
- Schools +5.2/10.0
- Livability +3.4/5.0
- Rent growth +2.5/5.0
- Condition / age +2.5/5.0
- DSCR +2.4/10.0
- 1% rule +2.2/10.0
$435,000
🖨 Deal sheet (PDF) 📄 Offer letter ✓ Due diligence
Listing remarks MLS
Bella Vista PRIME LOCATION!! Gorgeous new construction home ON SEWER in one of Bella Vista's most desired areas. Private beautiful back yard setting with large partially covered deck for entertaining and enjoying the beautifully wooded views. 3/4 bed, 2 bath, office with many custom touches including designer quartz counters throughout, custom wall decor, floating gas fireplace, beautiful LVP in main areas. Open kitchen, dining and great room to host large gatherings! Large Owners retreat with ensuite including elegant tile shower, soaker tub and giant his/hers closets designed to pamper the owners! Good sized laundry and pantry plus mud room area to provide ample storage and functionality! All set in Bella Vista with golf, tennis, lakes, trails, parks, community/exercise facilities and several restaurants.
Key facts
- Flat driveway
- Golf courses
- Mountain bike trails
Tags
Property features AI
Finance
- HOA & community: Bella Vista POA; Annual HOA involvement; Additional association fee of $40 monthly; Community amenities: biking, clubhouse, dock, fitness center, golf, playground, park, pool, recreation area, tennis courts, trails/paths
Exterior
- Parking: Attached garage; 2 covered parking spaces
- Security: Smoke detector(s)
- Utilities: Electricity available; Public water; Sewer available; Recycling collection available
- Home design: Single-story home; New construction; Has view
- Construction: Vinyl siding; Asphalt shingle roof; Block foundation; Built as new construction
- Exterior features: Concrete driveway; Deck; Community pool; Views; Landscaped lot; Wooded areas; Public/shared paved road frontage; Smoke detectors
Interior
- Kitchen: Dishwasher; Electric range; Microwave; Microwave with hood fan; Garbage disposal; Granite counters; Pantry; ENERGY STAR qualified appliances
- Bedrooms: Main level bedroom, approx. 11 x 12; Main level bedroom, approx. 11 x 12; Main level bedroom, approx. 10 x 12
- Flooring: Carpet; Luxury vinyl plank
- Bathrooms: 2 full bathrooms
- Heating & cooling: Heat pump heating (electric); Central air conditioning
- Interior features: Attic; Built-in features; Ceiling fans; Cathedral ceilings; Granite counters; Pantry; Storage; Walk-in closets; Window treatments; Double-pane windows; Blinds
- Laundry & utility: Washer hookup; Dryer hookup; Electric water heater; Utility room (main level, approx. 5 x 7)
Neighborhood map
What this means for you Summary
Snapshot
- This is a 4-bed/2.0-bath single-family listed at $435k.
Deal economics
- At list price, monthly cash flow is $-369 ($-4k/yr) — negative.
- To cash-flow at today's rent, offer at most $370k (15.0% below list).
- To meet the 1% rule (rent ≥ 1% of price), the offer needs to be $314k (27.8% below list).
- Recommended offer: $314k (27.8% below list) — sets the bar for 1% rule.
- Cap rate 5.3% vs local median 3.6% in Bella Vista — top-decile yield for the area; either an underpriced asset or a hidden risk that comps aren't pricing in. Stress-test before assuming the spread holds.
Location & tenants
- Location reads 67/100 on livability (#111 in AR) — a middle-class / working-renter tenant base. Strengths: cost of living A+, housing A+, schools A; Watch: amenities F, commute F, health & safety F.
- Bentonville School District (urban): math 59% / reading 59% proficiency, ranked #3 of 238 in AR (top 1%) — acceptable for families but not a draw, mixed tenant base, ~2y average lease.
- Market conditions: 484 active listings in the ZIP; 4 comparable units currently listed for rent nearby; rentals at typical pace (median 16d on market — plan ~3-4 weeks tenant-placement turnaround); solid renter incomes; 4,359 units permitted in Benton County in 2024 (402 in 5+ unit buildings).
- This rent runs 37% of the median local income ($103k/yr) — at the standard rent-burdened threshold; future hikes will face affordability resistance.
Forward outlook
- In year one you build about $9k of equity ($3k loan paydown + $6k appreciation (1.4% local appreciation)).
- Benton County population projected at +56% by 2050 — long-run rental-demand tailwind backs the buy-and-hold thesis.
- By year 4, paydown + projected appreciation supports a ~$32k cash-out refi (75% LTV) — recoverable capital for the next deal without selling this one.
Negotiation context
- Only 8 days on market — expect competitive offers; lowballing is unlikely to land.
- 2 sale attempts since 3y ago with the ask held roughly flat each time — persistent listings suggest the price (not the market) is what's stuck; bring a comps-based counter.
Risks & watch-outs
- Climate carrying-cost: extreme-heat days projected 7→20/yr by 2055 (HVAC capex compounding) — expect insurance premiums to compound above CPI over the hold.
Questions for the listing agent
- What do current leases actually rent for vs. the listed asking? Can we see a recent rent roll and the last 12 months of T-12 income?
- What does the HOA fee cover, when was the last increase, and are there any pending special assessments or reserve-fund shortfalls?
- Is there a deadline driving the sale (1031 exchange, divorce, estate, relocation)? That informs how much negotiation room exists.
- Schools are A-rated — typically a magnet for longer-tenancy family renters. What's the average tenant stay here, and is there a school-zone premium baked into asking?
- The area grade is low — what's the realistic commute time and amenity access for the typical tenant pool here? Any planned neighborhood developments (good or bad) we should know about?
- What's the average days-on-market for RENTAL listings here right now (not sales)? A rising rental-DOM trend means longer vacancies and softer asking-rent achievability than the comps imply.
- What's the recent tenant-quality profile in this submarket — average credit score on applications, eviction rate, late-payment / NSF rate, and stable-employment percentage? A property-management company in the area should have these aggregated.
- How much new for-sale + rental construction is in the pipeline within 1–3 miles? Heavy new supply typically softens prices + rents 12–24 months out; constrained supply supports both.
Investment metrics
- 1% rule
- 0.72% ✗
- Cap rate
- 5.28%
- Cash-on-cash
- -3.63%
- DSCR
- 0.84
- GRM
- 11.5
CMA / ARV
- ARV (on-the-fly)
- $415,895
- Comps found
- 12
Show comp detail 12 sales within ~0.75 mi
| Address | Dist | Beds/Ba | Sqft | Sold | Price | $/sf | Match |
|---|---|---|---|---|---|---|---|
| 3 Naworth Ln | 0.21mi | 3/2.5 (-1) | 1,817 (-3%) | 4mo | $405,000 | $223 | 76 |
| 26 Overton Dr | 0.55mi | 4/2.0 | 1,831 (-2%) | 4mo | $384,000 | $210 | 68 |
| 6 Penzance Dr | 0.41mi | 3/2.0 (-1) | 1,933 (+4%) | 2mo | $486,000 | $251 | 68 |
| 17 Cumbrian Dr | 0.27mi | 3/2.0 (-1) | 1,652 (-11%) | 1mo | $305,000 | $185 | 62 |
| 22 Lundy Ln | 0.57mi | 3/2.0 (-1) | 1,895 (+2%) | 5mo | $440,500 | $232 | 61 |
| 6 Laxton Ln | 0.21mi | 3/2.0 (-1) | 2,113 (+13%) | 2mo | $410,000 | $194 | 61 |
| 4 Edenhall Ln | 0.47mi | 4/2.0 | 2,057 (+10%) | 2mo | $425,000 | $207 | 59 |
| 3 Clun Ln | 0.56mi | 4/2.0 | 2,017 (+8%) | 4mo | $423,500 | $210 | 57 |
| 5 Mawnan Cir | 0.55mi | 4/2.5 | 1,673 (-10%) | 6mo | $379,950 | $227 | 50 |
| 8 Wreay Ln | 0.57mi | 4/2.0 | 1,652 (-11%) | 7mo | $347,000 | $210 | 49 |
| 10 Swarthmoor Ln | 0.74mi | 4/2.5 | 1,711 (-8%) | 2mo | $406,507 | $238 | 48 |
| 8 Swarthmoor Ln | 0.74mi | 4/2.5 | 1,673 (-10%) | 5mo | $385,000 | $230 | 42 |
Match score weights: distance 35% · size 25% · config 20% · recency 20%. Top-matched comps best support the ARV.
Projected returns pro-forma
1.38% appreciation · 3.0% rent growth · sell at horizon
- IRR
- -1.1%
- Equity multiple
- 0.94×
- Total profit
- $-7,142
- Equity at exit
- $157,278
- IRR
- 3.6%
- Equity multiple
- 1.45×
- Total profit
- $55,362
- Equity at exit
- $215,971
Cash invested: $121,800 (down + closing). Projections, not guarantees.
Landlord ↔ Tenant lean methodology
- Overall (STATE)
- 92 Strongly Landlord-Friendly
- State Arkansas
- 92 Strongly Landlord-Friendly · R+14
- County
- — inherits STATE
- City
- — inherits STATE
ZIP-level market 72714
- Home prices YoY
- 0.5%
- Active inventory
- 484
- Price-to-rent
- 11.5×
Monthly cashflow live
- Estimated rent
- $3,140 medium interval (Pro) →
- Mortgage (P&I)
- −$2,281
- Tax from tax record
- −$347 /mo · $4,160/yr
- Insurance
- −$181
- HOA
- −$40
- Vacancy / Maint / Mgmt
- −$659
- Net cashflow
- $-369
Break-even live
Sensitivity live
| Price | -10% $-122 | -5% $-245 | +0% $-369 | +5% $-492 | +10% $-615 |
|---|---|---|---|---|---|
| Rent | -10% $-617 | -5% $-493 | +0% $-369 | +5% $-245 | +10% $-121 |
| Rate | -1.0pp $-150 | -0.5pp $-258 | base $-369 | +0.5pp $-481 | +1.0pp $-596 |
UW: 25.0% down · 7.5% · 30yr · 1.5% tax · 5.0% vac · 8.0% maint · 8.0% mgmt
Financing live
Cash to close
- Down payment
- $108,750
- Closing costs
- $13,050
- Reserves months
- —
- Total cash needed
- —
Loan-product check · same deal, 3 products live
Conventional
25% down · 7.5% · 30yr
- Down + closing
- —
- Monthly P&I
- —
- Monthly cashflow
- —
- DSCR
- —
- Eligible?
- —
Personal DTI + credit; lowest rate.
DSCR
20% down · 8.5% · 30yr
- Down + closing
- —
- Monthly P&I
- —
- Monthly cashflow
- —
- DSCR
- —
- Eligible?
- —
No personal income docs; deal must DSCR.
Hard money
10% down · 12.0% · 12mo
- Down + closing
- —
- Monthly P&I
- —
- Monthly cashflow
- —
- DSCR
- —
- Eligible?
- —
Short-term bridge; refi at stabilization.
Rent comps 4 comps
| Address | Beds | Baths | Sqft | Rent | $/sqft | DOM | Units | Dist |
|---|---|---|---|---|---|---|---|---|
| 5 Mawnan Ln Unit 1297040P Bella Vista, AR | 5.0 | 3.0 | 2507 | $5,460 | $2.18 | 23d | 1 | 0.51mi |
| 1 Dent Ln Bella Vista, AR | 4.0 | 2.0 | 2215 | $2,850 | $1.29 | 15d | 1 | 0.59mi |
| 27 Shropshire Dr Bella Vista, AR | 3.0 | 3.0 | 1822 | $2,250 | $1.23 | 15d | 1 | 0.59mi |
| 20 Annette Ln Bella Vista, AR | 3.0 | 2.0 | 1520 | $1,650 | $1.09 | 16d | 1 | 1.04mi |
HOA detail
- Monthly dues
- $40 · $480/yr
- Likely covers
- sewergas
Listing history 7 events
-
2026-06-14statusdays on market $435,000 Pending 8 DOM
-
2026-06-10days on market $435,000 Active 6 DOM
-
2026-06-09days on market $435,000 Active 5 DOM
-
2026-06-08days on market $435,000 Active 4 DOM
-
2026-06-07days on market $435,000 Active 3 DOM
-
2026-06-05remarks 691-char remark
-
2026-06-05$435,000 Active 1 DOM
ⓘ Source: listings_history table (triggers on properties + properties_extension) + one-shot
backfill from property_details.listing_events for pre-trigger history.
Tax reassessment forecast AR · Resets to sale price
- Current annual tax
- $4,160 · $347/mo
- Projected year-2 tax
- $4,160 · $347/mo
- Expected delta
- $0/yr ($0/mo · 0.0%)
ⓘ Screening estimate from a state-policy table — verify with the county assessor before closing.
Climate risk First Street
- Flood 1/10 Low FEMA zone X (unshaded) · 0% chance over 30 yrs
- Wildfire 4/10 Moderate
- Heat 5/10 Major 7 d/yr ≥105°F today · 20 d/yr by 30 yrs out
- Wind 2/10 Low 2% chance of damaging wind over 30 yrs
- Air quality 2/10 Low 0 unhealthy d/yr today · 1 by 30 yrs out
Nearby sold comps map
Loading sold comps map…
Walkable amenities ~0.75 mi
Loading nearby amenities…
Taxation est. · year 1
- Rental income
- $37,679
- − Mortgage interest
- −$24,367
- − Property taxes
- −$4,160
- − Insurance
- −$2,175
- − Repairs & maintenance
- −$3,014
- − Management
- −$3,014
- − HOA
- −$480
- − Depreciation
- −$12,655
- Taxable loss
- −$12,186
- Est. tax savings @ 24.0%
- +$2,925
- After-tax cash flow
- $-1,499/yr
For passive investors: Depreciation is non-cash, so a rental often shows a tax loss while cash-flowing — sheltering income. Rental losses are passive: they offset passive income freely, and up to $25,000/yr can offset ordinary (W-2) income if you actively participate and your MAGI is under $100k (phasing out to $0 by $150k); unused losses carry forward. On sale, claimed depreciation is recaptured at up to 25%, and gains may owe capital-gains tax (a 1031 exchange can defer both). Figures are a year-1 estimate at your 24.0% rate — not tax advice; consult a CPA.
Schools (NCES district)
- District
- Bentonville School District
- NCES district ID
- 0503060
- Math proficiency
- 59% ▼ -8.00%
- Reading proficiency
- 59% ▼ -6.00%
- Median HH income
- $66,721
- Composite
- 51.85/100
- National rank
- #1661
- State rank
- #3 of 238 in AR
Livability — Bella Vista
- Score
- 67/100
- State rank
- #111
- US rank
- #11129
Category grades
Schools grade is shown separately in the Schools card above.
Census & demographics
- Census place
- Bella Vista, AR
- County
- Benton County · 259,241 people
- City population
- 31,638
- Metro
- Fayetteville-Springdale-Rogers, AR
- Population (ZIP)
- 14,350
- Household income
- $103,125
- Rent vs Own
- Severe rent burden
- 61.0
Population outlook (Benton County) Hauer SSP2
- Today (2025)
- 318,683 people
- By 2030
- 353,481 · +10.9%
- By 2040
- 425,280 · +33.4%
- By 2050
- 497,239 · +56.0%
- By 2075
- 662,114 · +107.8%
- By 2100
- 776,431 · +143.6%
Race, ethnicity, and origin ACS 2023
- Neighborhood character
- Predominantly White (83%)
- Race & ethnicity
- White 83% Two or more races 11% Hispanic / Latino 6%
- Hispanic origin (detail)
- Mexican 2% Dominican 2%
- Common ancestry
- Slovak 4% Lithuanian 3% Italian 3%
- Foreign-born
- 3% · Canada
- Languages at home
- 98% English-only · Spanish 2%
Political lean MEDSL · Benton
- 2024 margin
- Strong R (+27.0) · D 35.2% · R 62.1% · Other 2.7%
- 2008→2024 swing
- +9.6pp toward D · 2008: -36.5pp · 2024: -27.0pp
- All cycles
- 2024: R+27.0 2020: R+26.4 2016: R+34.9 2012: R+40.4 2008: R+36.5
Not yet ingested
- Civics
- —
Market trends
- HPI YoY
- ▲ 1.38%
- Current HPI
- 307.5796
- Rent YoY
- —
- Metro
- Fayetteville-Springdale-Rogers, AR
- State GDP YoY
- ▲ 3.80%
- F500 in state
- 10
Industry mix (Fortune 500 HQ in AR)
| Industry | F500 HQs | Revenue |
|---|---|---|
| Retail | 1 | $681B |
|
||
| Food / Agriculture | 1 | $53B |
|
||
| Retail / Energy | 1 | $22B |
|
||
| Transportation / Logistics | 1 | $12B |
|
||
| Energy | 1 | $4B |
|
||
Price history
+4250.0% since first listed5 events — show timeline
- 2026-06-04 Listed $435,000 NWARMLS
- 2024-02-29 Sold (MLS) $399,000 NWARMLS
- 2024-01-28 Pending — NWARMLS
- 2023-12-01 Listed $399,000 NWARMLS
- 2023-03-20 Sold (Public Records) $10,000 Public Records
Property tax history
+52.2%/yrLatest (2025): $4,160 · +4098.3% YoY. Source: county tax records.
Cash-flow waterfall
monthlySold comps — $/sqft
last 12 mo · ≤1 miLoading sold comps…