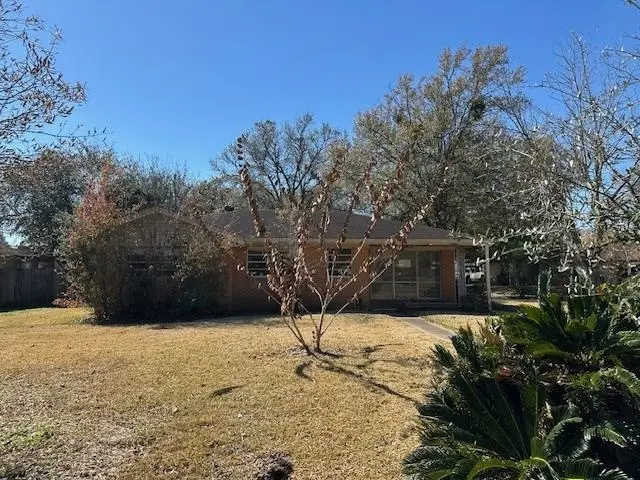
411 N 31st St · Nederland, TX
Flood risk 7/10 · Major
- FEMA flood zone
- X
- Chance of flooding over 30 yrs
- 0.59%
- Est. flood insurance / yr
- $507 – $1,088
Fire risk 2/10 · Minimal
- Est. fire insurance / yr
- $1,222 – $2,270
Heat risk 9/10 · Severe
- Hot days now (above 110°F)
- 7 days/yr
- Hot days in 30 yrs
- 24 days/yr
Wind risk 9/10 · Severe
- Chance of severe wind over 30 yrs
- 99.0%
Air-quality risk 2/10 · Minimal
- Unhealthy air days now
- 1 days/yr
- Unhealthy air days in 30 yrs
- 1 days/yr
Risk factors via First Street. Map © Google.
Why this score? — see what drove the C grade
The composite is a weighted blend of 9 inputs, each scored 0–100. Each bar is that input's sub-score; the figure is the points it added to the 100-point composite (weight × sub-score).
- Cash flow +17.4/30.0
- ARV discount +15.0/15.0
- 1% rule +6.0/10.0
- DSCR +5.4/10.0
- Rent growth +4.8/5.0
- Schools +4.5/10.0
- Livability +3.8/5.0
- Condition / age +2.5/5.0
- Appreciation +0.0/10.0
$149,520
🖨 Deal sheet 📄 Offer letter ✓ Due diligence
Listing remarks MLS
Welcome to this 3-bedroom, 2-bath home. Inside, you’ll find a spacious living room, formal dining room, and a separate eat-in kitchen. The property sits on a spacious city lot with 1 car attached garage. Schedule your showing today!
Key facts
- 5,227 sq ft lot
- Garage
- Listed 114 days
Neighborhood map
What this means for you Summary
Snapshot
- This is a 3-bed/2.0-bath single-family listed at $150k.
Deal economics
- At list price, monthly cash flow is $45 ($538/yr) — positive.
- The deal already cash-flows at list — no discount required.
- Meets the 1% rule at list price ($2k rent vs $150k).
- Recommended offer: $136k (9.0% below list) — sets the bar for market timing.
- Cap rate 7.2% vs local median 4.6% in Nederland — top-decile yield for the area; either an underpriced asset or a hidden risk that comps aren't pricing in. Stress-test before assuming the spread holds.
Location & tenants
- Location reads 75/100 on livability (#129 in TX, #3,906 nationally) — a middle-class / working-renter tenant base. Strengths: employment A+, cost of living A+, housing A+; Watch: amenities F, commute F.
- Nederland ISD (suburban): math 51% / reading 52% proficiency, ranked #138 of 826 in TX (top 17%) — acceptable for families but not a draw, mixed tenant base, ~2y average lease.
- Market conditions: Rents rising fast (+9.3%/yr); 111 active listings in the ZIP; 20 comparable units currently listed for rent nearby; rentals at typical pace (median 24d on market — plan ~3-4 weeks tenant-placement turnaround); solid renter incomes; 343 units permitted in Jefferson County in 2024 (0 in 5+ unit buildings).
Forward outlook
- Local home prices are declining (-3.0%/yr); year-one equity from $1k of loan paydown is wiped out by about $4k of value loss. Plan a longer hold.
- At projected returns (-3.0% appreciation + 8.0% rent growth), your $42k cash investment doubles in ~10 years — after that, you're playing with house money.
Negotiation context
- It's been on market 114 days — a 9% lower offer ($136k) is reasonable based on typical stale-listing flexibility.
- 2 sale attempts since 9y ago; this cycle's ask has dropped $28k (16%) from the opening price — seller is motivated, your offer sets the floor, not the list.
Risks & watch-outs
- Watch-outs: property tax is 2.8% of price; flood insurance adds $66/mo.
- Climate carrying-cost: major flood risk; severe wind risk, 99% chance of damaging wind over 30y; extreme-heat days projected 7→24/yr by 2055 (HVAC capex compounding) — expect insurance premiums to compound above CPI over the hold.
Questions for the listing agent
- It's been on market 114 days. Have you received any prior offers? Is the seller open to a 9% concession, seller financing, or rate buy-down credit?
- Built in 1968 — when were the roof, HVAC, electrical panel, plumbing, and water heater last replaced?
- Property tax is high relative to price — has the assessment been appealed recently, and will the sale trigger a re-assessment?
- What's the actual annual flood-insurance premium (NFIP or private), and is the property in a SFHA with mandatory coverage?
- Why hasn't it sold? Are there any deal-killer items the seller is aware of (foundation, flood, title, zoning, code violations)?
- Is there a deadline driving the sale (1031 exchange, divorce, estate, relocation)? That informs how much negotiation room exists.
- Schools are A-rated — typically a magnet for longer-tenancy family renters. What's the average tenant stay here, and is there a school-zone premium baked into asking?
- What's the average days-on-market for RENTAL listings here right now (not sales)? A rising rental-DOM trend means longer vacancies and softer asking-rent achievability than the comps imply.
- What's the recent tenant-quality profile in this submarket — average credit score on applications, eviction rate, late-payment / NSF rate, and stable-employment percentage? A property-management company in the area should have these aggregated.
- How much new for-sale + rental construction is in the pipeline within 1–3 miles? Heavy new supply typically softens prices + rents 12–24 months out; constrained supply supports both.
Investment metrics
- 1% rule
- 1.10% ✓
- Cap rate
- 7.19%
- Cash-on-cash
- 3.19%
- DSCR
- 1.14
- GRM
- 7.6
CMA / ARV
- ARV (median comp)
- $188,647
- List price
- $149,520
- Delta
- -20.74%
- Verdict
- UNDERPRICED
- Comps
- 20 within 1.0 mi
Show comp detail 12 sales within ~0.75 mi
| Address | Dist | Beds/Ba | Sqft | Sold | Price | $/sf | Match |
|---|---|---|---|---|---|---|---|
| 703 N 30th St | 0.20mi | 3/2.0 | 1,500 (+2%) | 15mo | $249,900 | $167 | 76 |
| 1008 N 31st St | 0.39mi | 3/2.0 | 1,472 (-0%) | 11mo | $260,000 | $177 | 72 |
| 505 S 27th St | 0.57mi | 3/2.0 | 1,556 (+5%) | 4mo | $229,500 | $147 | 61 |
| 2323 Avenue A | 0.55mi | 4/2.0 (+1) | 1,402 (-5%) | 2mo | $135,000 | $96 | 60 |
| 2808 Gary Ave | 0.23mi | 3/2.0 | 1,344 (-9%) | 22mo | $229,000 | $170 | 56 |
| 3604 Franklin Ave | 0.36mi | 3/2.0 | 1,302 (-12%) | 11mo | $230,000 | $177 | 54 |
| 2319 Helena Ave | 0.52mi | 3/1.0 | 1,356 (-8%) | 8mo | $225,000 | $166 | 52 |
| 203 N 21st St | 0.64mi | 3/1.5 | 1,550 (+5%) | 12mo | $210,000 | $135 | 50 |
| 3304 Avenue E | 0.53mi | 4/2.0 (+1) | 1,520 (+3%) | 21mo | $189,900 | $125 | 48 |
| 3032 Avenue H | 0.72mi | 4/1.0 (+1) | 1,386 (-6%) | 8mo | $189,000 | $136 | 41 |
| 2216 Avenue B | 0.64mi | 3/2.0 | 1,356 (-8%) | 20mo | $163,000 | $120 | 40 |
| 2777 Poydras Ct | 0.66mi | 3/2.5 | 1,669 (+13%) | 8mo | $370,000 | $222 | 39 |
Match score weights: distance 35% · size 25% · config 20% · recency 20%. Top-matched comps best support the ARV.
Projected returns pro-forma
-3.0% appreciation · 8.0% rent growth · sell at horizon
- IRR
- -7.6%
- Equity multiple
- 0.70×
- Total profit
- $-12,493
- Equity at exit
- $22,294
- IRR
- 8.2%
- Equity multiple
- 1.79×
- Total profit
- $33,131
- Equity at exit
- $12,928
Cash invested: $41,866 (down + closing). Projections, not guarantees.
Landlord ↔ Tenant lean methodology
- Overall (STATE)
- 87 Strongly Landlord-Friendly
- State Texas
- 87 Strongly Landlord-Friendly · R+5
- County
- — inherits STATE
- City
- — inherits STATE
ZIP-level market 77627
- Rents YoY
- 9.3%
- Active inventory
- 111
- Price-to-rent
- 7.6×
Monthly cashflow live
- Estimated rent
- $1,649 high interval (Pro) →
- Mortgage (P&I)
- −$784
- Tax from tax record
- −$345 /mo · $4,142/yr
- Insurance
- −$62
- Flood insurance flood zone
- −$66 /mo · $798/yr
- HOA
- −$0
- Vacancy / Maint / Mgmt
- −$346
- Net cashflow
- $45
Break-even live
UW: 25.0% down · 7.5% · 30yr · 1.5% tax · 5.0% vac · 8.0% maint · 8.0% mgmt
Financing live
Cash to close
- Down payment
- $37,380
- Closing costs
- $4,486
- Reserves months
- —
- Total cash needed
- —
Loan-product check · same deal, 3 products live
Conventional
25% down · 7.5% · 30yr
- Down + closing
- —
- Monthly P&I
- —
- Monthly cashflow
- —
- DSCR
- —
- Eligible?
- —
Personal DTI + credit; lowest rate.
DSCR
20% down · 8.5% · 30yr
- Down + closing
- —
- Monthly P&I
- —
- Monthly cashflow
- —
- DSCR
- —
- Eligible?
- —
No personal income docs; deal must DSCR.
Hard money
10% down · 12.0% · 12mo
- Down + closing
- —
- Monthly P&I
- —
- Monthly cashflow
- —
- DSCR
- —
- Eligible?
- —
Short-term bridge; refi at stabilization.
Rent comps 20 comps
| Address | Beds | Baths | Sqft | Rent | $/sqft | DOM | Units | Dist |
|---|---|---|---|---|---|---|---|---|
| 3119 Moor Dr Nederland, TX | 3.0 | 1.5 | 1448 | $1,795 | $1.24 | 44d | 1 | 0.06mi |
| 3527 Helena Ave Nederland, TX | 2.0 | 2.5 | 1088 | $1,200 | $1.10 | 44d | 1 | 0.34mi |
| 224 S 35th St Nederland, TX | 3.0 | 1.0 | 1000 | $1,600 | $1.60 | 23d | 1 | 0.43mi |
| 2512 Avenue A Unit A Nederland, TX | 3.0 | 1.5 | 1387 | $1,795 | $1.29 | 23d | 1 | 0.44mi |
| 2604 Avenue C Unit C Nederland, TX | 3.0 | 2.0 | 1008 | $1,795 | $1.78 | 44d | 1 | 0.51mi |
| 209 N 22nd St Unit 1 Nederland, TX | 2.0 | 1.0 | 900 | $1,100 | $1.22 | 44d | 1 | 0.57mi |
| 617 Hardy Ave Nederland, TX | 3.0 | 2.0 | 1295 | $1,700 | $1.31 | 23d | 1 | 0.63mi |
| 2125 Avenue A Unit A Nederland, TX | 3.0 | 2.0 | 1175 | $1,600 | $1.36 | 14d | 1 | 0.64mi |
| 2125 Avenue A Unit A Nederland, TX | 3.0 | 2.0 | 1200 | $1,600 | $1.33 | 44d | 1 | 0.64mi |
| 2125 Avenue A Unit A Nederland, TX | 3.0 | 2.0 | 1200 | $1,600 | $1.33 | 23d | 1 | 0.64mi |
| 2640 Hickory Cove Ln Port Arthur, TX | 4.0 | 2.5 | 1850 | $2,600 | $1.41 | 14d | 1 | 0.76mi |
| 1815 Helena Ave Nederland, TX | 3.0 | 2.0 | 1248 | $1,750 | $1.40 | 23d | 1 | 0.82mi |
| 3514 Highway 69 N Unit K 091 Nederland, TX | 2.0 | 1.0 | 988 | $1,425 | $1.44 | 23d | 1 | 0.85mi |
| 3514 Hwy 69 N Nederland, TX | 2.0–3.0 | 1.0–2.0 | 1144 | $1,600 | $1.40 | 14d | 7 | 0.85mi |
| 1924 Avenue H Unit H Nederland, TX | 2.0 | 1.0 | 900 | $1,000 | $1.11 | 44d | 1 | 0.98mi |
| 1212 S 36th St Nederland, TX | 3.0 | 1.0 | 1000 | $1,650 | $1.65 | 14d | 1 | 1.04mi |
| 2555 95th St Port Arthur, TX | 1.0–2.0 | 1.0–2.0 | 831 | $1,490 | $1.79 | 14d | 61 | 1.05mi |
| 1619 Avenue G Unit G Nederland, TX | 3.0 | 1.5 | 1100 | $1,750 | $1.59 | 23d | 1 | 1.07mi |
| 1107 S 16th St Unit 1 Nederland, TX | 2.0 | 1.0 | 1395 | $1,250 | $0.90 | 14d | 1 | 1.31mi |
| 8849 Pinewood Dr Port Arthur, TX | 1.0–3.0 | 1.0–2.0 | 990 | $1,949 | $1.97 | 14d | 1 | 1.33mi |
Listing history 10 events
-
2026-06-02status $149,520 Pending 114 DOM
-
2026-06-01days on market $149,520 Active 114 DOM
-
2026-05-31days on market $149,520 Active 113 DOM
-
2026-05-30days on market $149,520 Active 112 DOM
-
2026-04-30price $149,520 238-char remark
Show marketing remark (238 chars)
Welcome to this 3-bedroom, 2-bath home. Inside, you’ll find a spacious living room, formal dining room, and a separate eat-in kitchen. The property sits on a spacious city lot with 1 car attached garage. Schedule your showing today!
-
2026-03-26price $163,760 238-char remark
Show marketing remark (238 chars)
Welcome to this 3-bedroom, 2-bath home. Inside, you’ll find a spacious living room, formal dining room, and a separate eat-in kitchen. The property sits on a spacious city lot with 1 car attached garage. Schedule your showing today!
-
2026-02-08$178,000 Active 238-char remark
Show marketing remark (238 chars)
Welcome to this 3-bedroom, 2-bath home. Inside, you’ll find a spacious living room, formal dining room, and a separate eat-in kitchen. The property sits on a spacious city lot with 1 car attached garage. Schedule your showing today!
-
2017-12-14soldstatus
-
2017-12-12soldstatus 1025-char remark
Show marketing remark (1025 chars)
Looking for space? This home is it!! Over 1600 sq. ft. , this estate home offers both a formal living room and roomy family den, plus bonus sunroom! The kitchen, dining room, and den are set in an open concept, great for entertaining. Three roomy bedrooms all with good closet space. Master features its own bathroom with shower. Hall bath is roomy and retro with lovely tile. Beautiful, roomy, corner lot, with mature trees and gardens also features an in-ground sprinkler system. Extra parking next to driveway. Backyard privacy fenced with backyard storage. New certified roof installed week of 8/11/16. Outside A/C only a couple years old. All appliances, including refrigerator and washer/dryer convey with the property. New stove installed in Oct 2017! This home is located close to elementary and middle schools, with easy highway and main road access to shopping and dining. Call for your appointment to see today! * * * * * * * * * * * * Per Seller- Did Not Flood!!! * * * * * * * * * * * * *
-
2017-10-30$129,900 1025-char remark
Show marketing remark (1025 chars)
Looking for space? This home is it!! Over 1600 sq. ft. , this estate home offers both a formal living room and roomy family den, plus bonus sunroom! The kitchen, dining room, and den are set in an open concept, great for entertaining. Three roomy bedrooms all with good closet space. Master features its own bathroom with shower. Hall bath is roomy and retro with lovely tile. Beautiful, roomy, corner lot, with mature trees and gardens also features an in-ground sprinkler system. Extra parking next to driveway. Backyard privacy fenced with backyard storage. New certified roof installed week of 8/11/16. Outside A/C only a couple years old. All appliances, including refrigerator and washer/dryer convey with the property. New stove installed in Oct 2017! This home is located close to elementary and middle schools, with easy highway and main road access to shopping and dining. Call for your appointment to see today! * * * * * * * * * * * * Per Seller- Did Not Flood!!! * * * * * * * * * * * * *
ⓘ Source: listings_history table (triggers on properties + properties_extension) + one-shot
backfill from property_details.listing_events for pre-trigger history.
Tax reassessment forecast TX · Resets to sale price
- Current annual tax
- $4,142 · $345/mo
- Projected year-2 tax
- $4,142 · $345/mo
- Expected delta
- $0/yr ($0/mo · 0.0%)
ⓘ Screening estimate from a state-policy table — verify with the county assessor before closing.
Climate risk First Street
- Flood 7/10 Severe FEMA zone X · 59% chance over 30 yrs
- Wildfire 2/10 Low
- Heat 9/10 Extreme 7 d/yr ≥110°F today · 24 d/yr by 30 yrs out
- Wind 9/10 Extreme 99% chance of damaging wind over 30 yrs
- Air quality 2/10 Low 1 unhealthy d/yr today · 1 by 30 yrs out
Nearby sold comps map
Loading sold comps map…
Walkable amenities ~0.75 mi
Loading nearby amenities…
Taxation est. · year 1
- Rental income
- $19,791
- − Mortgage interest
- −$8,375
- − Property taxes
- −$4,142
- − Insurance
- −$1,545
- − Repairs & maintenance
- −$1,583
- − Management
- −$1,583
- − Depreciation
- −$4,350
- Taxable loss
- −$1,788
- Est. tax savings @ 24.0%
- +$429
- After-tax cash flow
- $967/yr
For passive investors: Depreciation is non-cash, so a rental often shows a tax loss while cash-flowing — sheltering income. Rental losses are passive: they offset passive income freely, and up to $25,000/yr can offset ordinary (W-2) income if you actively participate and your MAGI is under $100k (phasing out to $0 by $150k); unused losses carry forward. On sale, claimed depreciation is recaptured at up to 25%, and gains may owe capital-gains tax (a 1031 exchange can defer both). Figures are a year-1 estimate at your 24.0% rate — not tax advice; consult a CPA.
Schools (NCES district)
- District
- Nederland ISD
- NCES district ID
- 4832280
- Math proficiency
- 51% ▼ -3.00%
- Reading proficiency
- 52% ▼ -3.00%
- Median HH income
- $59,647
- Composite
- 44.95/100
- National rank
- #2709
- State rank
- #138 of 826 in TX
Livability — Nederland
- Score
- 75/100
- State rank
- #129
- US rank
- #3906
Category grades
Schools grade is shown separately in the Schools card above.
Census & demographics
- Census place
- Nederland, TX
- County
- Jefferson County · 203,592 people
- City population
- 22,357
- Metro
- Beaumont-Port Arthur, TX
- Population (ZIP)
- 22,357
- Household income
- $78,001
- Rent vs Own
- Severe rent burden
- 572.0
Population outlook (Jefferson County) Hauer SSP2
- Today (2025)
- 259,015 people
- By 2030
- 260,685 · +0.6%
- By 2040
- 263,309 · +1.7%
- By 2050
- 265,237 · +2.4%
- By 2075
- 270,193 · +4.3%
- By 2100
- 255,628 · -1.3%
Race, ethnicity, and origin ACS 2023
- Neighborhood character
- Predominantly White (78%)
- Race & ethnicity
- White 78% Hispanic / Latino 12% Two or more races 8% Black 4% Asian 3%
- Hispanic origin (detail)
- Mexican 8%
- Common ancestry
- Lithuanian 10% Slovak 3% Italian 2%
- Foreign-born
- 5% · Canada, Vietnam
- Languages at home
- 87% English-only · Spanish 8% Other Indo-European 1% Vietnamese 1%
Political lean MEDSL · Jefferson
- 2024 margin
- Lean R (+8.9) · D 45.1% · R 54.0%
- 2008→2024 swing
- -11.1pp toward R · 2008: 2.2pp · 2024: -8.9pp
- All cycles
- 2024: R+8.9 2020: R+1.6 2016: R+0.5 2012: D+1.6 2008: D+2.2
Not yet ingested
- Civics
- —
Market trends
- HPI YoY
- ▼ -228.91%
- Current HPI
- 176.2132
- Rent YoY
- ▲ 9.27%
- Metro
- Beaumont-Port Arthur, TX
- State GDP YoY
- ▲ 3.95%
- F500 in state
- 110
Industry mix (Fortune 500 HQ in TX)
| Industry | F500 HQs | Revenue |
|---|---|---|
| Energy | 16 | $1,198B |
|
||
| Technology | 5 | $198B |
|
||
| Engineering / Construction | 4 | $72B |
|
||
| Energy Services | 3 | $60B |
|
||
| Utilities | 3 | $41B |
|
||
| Healthcare | 2 | $330B |
|
||
Price history
+15.1% since first listed6 events — show timeline
- 2026-04-30 Price Changed $149,520 BBOR
- 2026-03-26 Price Changed $163,760 BBOR
- 2026-02-08 Listed $178,000 BBOR
- 2017-12-14 Sold (Public Records) — Public Records
- 2017-12-12 Sold (MLS) — BBOR
- 2017-10-30 Listed $129,900 BBOR
Property tax history
+4.3%/yrLatest (2025): $4,142 · +0.1% YoY. Source: county tax records.
Cash-flow waterfall
monthlySold comps — $/sqft
last 12 mo · ≤1 miLoading sold comps…