 🌊 Lakefront
11076 100th St #41 · Largo, FL
Flood risk 9/10 · Severe
- FEMA flood zone
- AE
- Chance of flooding over 30 yrs
- 0.99%
- Est. flood insurance / yr
- $1,737 – $8,500
Fire risk 3/10 · Minor
- Est. fire insurance / yr
- $947 – $1,759
Heat risk 10/10 · Severe
- Hot days now (above 107°F)
- 6 days/yr
- Hot days in 30 yrs
- 21 days/yr
Wind risk 10/10 · Severe
- Chance of severe wind over 30 yrs
- 99.0%
Air-quality risk 3/10 · Minor
- Unhealthy air days now
- 2 days/yr
- Unhealthy air days in 30 yrs
- 3 days/yr
Risk factors via First Street. Map © Google.
Why this score? — see what drove the C+ grade
The composite is a weighted blend of 9 inputs, each scored 0–100. Each bar is that input's sub-score; the figure is the points it added to the 100-point composite (weight × sub-score).
- Cash flow +30.0/30.0
- 1% rule +10.0/10.0
- DSCR +10.0/10.0
- Schools +4.3/10.0
- Livability +4.1/5.0
- Condition / age +2.5/5.0
- Rent growth +1.7/5.0
- ARV discount +0.0/15.0
- Appreciation +0.0/10.0
$99,950
🖨 Deal sheet (PDF) 📄 Offer letter ✓ Due diligence
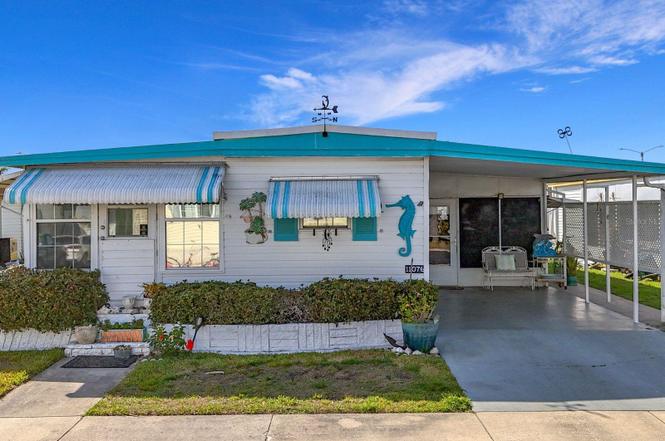
Listing remarks
Welcome to Lake Seminole Resort, a 55+ resident-owned cooperative set on the shores on beautiful Lake Seminole. This community is NOT LOT RENT and the home is NOT IN A FLOOD ZONE! This cottage charmer has plenty of living space, and is ready for its new owners. Entering the home from the carport, you'll step into the Florida room. Complete with window AC unit, this space is a great second living room! Off this is the storage / utility room, where you'll find the washer and dryer, and plenty of storage! Inside, you'll first find yourself in the oversized living room. The kitchen is in the front of the home, with a quaint dining room set right off of it. The bedrooms are both spacious, with m
Key facts
- Quaint dining room
- Florida room
- Lake seminole resort
Tags
Property features AI
Finance
- Other: Total annual fees $2,472; Furnished
- Financial info: Lease restrictions apply
- HOA & community: HOA: Lake Seminole Resort / Lasereno, Inc.; Monthly association fee $206 (includes pool); Association fee required; approval required; Association recreation owned; Street lights; Senior community; Pets allowed with size limit (max ~20 lbs)
Exterior
- Parking: Driveway; Carport (1 space)
- Utilities: Public water; Public sewer; Electricity connected; Water connected; Sewer connected; Underground utilities; Broadband/high-speed internet available
- Home design: Residential mobile home (double wide); One story; Faces east; Entry on main level
- Construction: Metal frame with vinyl siding; Membrane roof; Pillar/Post/Pier foundation; Completed condition; Built as double wide
- Exterior features: Enclosed patio/porch; Side porch; Awnings; Exterior lighting; Mature landscaping; City limits lot; Paved lot/road
Interior
- Kitchen: Dishwasher; Disposal; Range; Refrigerator; Electric water heater
- Bedrooms: 2 bedrooms
- Flooring: Carpet
- Bathrooms: 2 full bathrooms
- Heating & cooling: Central heating (electric); Central air; Wall/Window unit(s)
- Interior features: Ceiling fans; Florida room; Storage rooms
- Laundry & utility: Washer; Dryer; Laundry located outside
Neighborhood map
What this means for you Summary
Snapshot
- This is a 2-bed/1.5-bath manufactured listed at $100k.
Deal economics
- At list price, monthly cash flow is $142 ($2k/yr) — positive.
- The deal already cash-flows at list — no discount required.
- Meets the 1% rule at list price ($2k rent vs $100k).
- Recommended offer: $91k (9.0% below list) — sets the bar for market timing.
- Cap rate 13.1% vs local median 4.2% in Largo — top-decile yield for the area; either an underpriced asset or a hidden risk that comps aren't pricing in. Stress-test before assuming the spread holds.
Location & tenants
- Location reads 82/100 on livability (#82 in FL, #1,240 nationally) — a professional / high-income tenant draw. Strengths: commute A+, cost of living A+, housing A+; Watch: employment D+, amenities F.
- Pinellas (suburban): math 51% / reading 51% proficiency, ranked #31 of 73 in FL (top 42%) — acceptable for families but not a draw, mixed tenant base, ~2y average lease.
- Market conditions: Rents falling (-3.4%/yr); 118 active listings in the ZIP; 21 comparable units currently listed for rent nearby; rentals at typical pace (median 23d on market — plan ~3-4 weeks tenant-placement turnaround); solid renter incomes; 2,676 units permitted in Pinellas County in 2024 (1,422 in 5+ unit buildings).
Forward outlook
- Local home prices are declining (-3.0%/yr); year-one equity from $692 of loan paydown is wiped out by about $3k of value loss. Plan a longer hold.
- Pinellas County population projected at +14% by 2050 — modest demand growth; plan on rents tracking national, not racing it.
Negotiation context
- It's been on market 105 days — a 9% lower offer ($91k) is reasonable based on typical stale-listing flexibility.
- 9 sale attempts since 8y ago; this cycle's ask has dropped $20k (16%) from the opening price — seller is motivated, your offer sets the floor, not the list.
- Current owner paid $69k; 45% above their basis — modest negotiation headroom, anchor on the comps not their cost.
Risks & watch-outs
- Watch-outs: flood insurance adds $427/mo.
- Climate carrying-cost: in FEMA flood zone AE (mandatory federal flood insurance); severe wind risk, 99% chance of damaging wind over 30y; extreme-heat days projected 6→21/yr by 2055 (HVAC capex compounding) — expect insurance premiums to compound above CPI over the hold.
Questions for the listing agent
- It's been on market 105 days. Have you received any prior offers? Is the seller open to a 9% concession, seller financing, or rate buy-down credit?
- Built in 1971 — when were the roof, HVAC, electrical panel, plumbing, and water heater last replaced?
- What's the actual annual flood-insurance premium (NFIP or private), and is the property in a SFHA with mandatory coverage?
- What does the HOA fee cover, when was the last increase, and are there any pending special assessments or reserve-fund shortfalls?
- Why hasn't it sold? Are there any deal-killer items the seller is aware of (foundation, flood, title, zoning, code violations)?
- Is there a deadline driving the sale (1031 exchange, divorce, estate, relocation)? That informs how much negotiation room exists.
- This sits on a lake — are riparian / water-frontage rights deeded with the parcel? Any dock permits, shoreline easements, or HOA water-use restrictions?
- What's the documented flood / surge / shoreline-erosion history here (FEMA AND non-FEMA — e.g., storm surge, creek backup, septic-field saturation)?
- Any water-quality or seasonal algae-bloom issues that affect tenant satisfaction or short-term-rental demand?
- What's the average days-on-market for RENTAL listings here right now (not sales)? A rising rental-DOM trend means longer vacancies and softer asking-rent achievability than the comps imply.
- What's the recent tenant-quality profile in this submarket — average credit score on applications, eviction rate, late-payment / NSF rate, and stable-employment percentage? A property-management company in the area should have these aggregated.
- How much new for-sale + rental construction is in the pipeline within 1–3 miles? Heavy new supply typically softens prices + rents 12–24 months out; constrained supply supports both.
Investment metrics
- 1% rule
- 1.87% ✓
- Cap rate
- 13.12%
- Cash-on-cash
- 24.38%
- DSCR
- 2.08
- GRM
- 4.5
CMA / ARV
- ARV (on-the-fly)
- $82,840
- Comps found
- 1
Show comp detail 1 sale within ~0.75 mi
| Address | Dist | Beds/Ba | Sqft | Sold | Price | $/sf | Match |
|---|---|---|---|---|---|---|---|
| 11045 102nd St N #159 | 0.05mi | 1/1.0 (-1) | 756 (-0%) | 3mo | $82,500 | $109 | 87 |
Match score weights: distance 35% · size 25% · config 20% · recency 20%. Top-matched comps best support the ARV.
Projected returns pro-forma
-3.0% appreciation · 0.0% rent growth · sell at horizon
- IRR
- -12.7%
- Equity multiple
- 0.56×
- Total profit
- $-12,190
- Equity at exit
- $14,903
- IRR
- -15.6%
- Equity multiple
- 0.34×
- Total profit
- $-18,380
- Equity at exit
- $8,642
Cash invested: $27,986 (down + closing). Projections, not guarantees.
Landlord ↔ Tenant lean methodology
- Overall (STATE)
- 87 Strongly Landlord-Friendly
- State Florida
- 87 Strongly Landlord-Friendly · R+3
- County
- — inherits STATE
- City
- — inherits STATE
ZIP-level market 33773
- Rents YoY
- -3.4%
- Active inventory
- 118
- Price-to-rent
- 4.5×
Monthly cashflow live
- Estimated rent
- $1,866 high interval (Pro) →
- Mortgage (P&I)
- −$524
- Tax from tax record
- −$134 /mo · $1,608/yr
- Insurance
- −$42
- Flood insurance flood zone
- −$427 /mo · $5,118/yr
- HOA
- −$206
- Vacancy / Maint / Mgmt
- −$392
- Net cashflow
- $142
Break-even live
Sensitivity live
| Price | -10% $199 | -5% $170 | +0% $142 | +5% $114 | +10% $86 |
|---|---|---|---|---|---|
| Rent | -10% $-5 | -5% $68 | +0% $142 | +5% $216 | +10% $290 |
| Rate | -1.0pp $192 | -0.5pp $168 | base $142 | +0.5pp $116 | +1.0pp $90 |
UW: 25.0% down · 7.5% · 30yr · 1.5% tax · 5.0% vac · 8.0% maint · 8.0% mgmt
Financing live
Cash to close
- Down payment
- $24,988
- Closing costs
- $2,998
- Reserves months
- —
- Total cash needed
- —
Loan-product check · same deal, 3 products live
Conventional
25% down · 7.5% · 30yr
- Down + closing
- —
- Monthly P&I
- —
- Monthly cashflow
- —
- DSCR
- —
- Eligible?
- —
Personal DTI + credit; lowest rate.
DSCR
20% down · 8.5% · 30yr
- Down + closing
- —
- Monthly P&I
- —
- Monthly cashflow
- —
- DSCR
- —
- Eligible?
- —
No personal income docs; deal must DSCR.
Hard money
10% down · 12.0% · 12mo
- Down + closing
- —
- Monthly P&I
- —
- Monthly cashflow
- —
- DSCR
- —
- Eligible?
- —
Short-term bridge; refi at stabilization.
Rent comps 21 comps
| Address | Beds | Baths | Sqft | Rent | $/sqft | DOM | Units | Dist |
|---|---|---|---|---|---|---|---|---|
| 10165 106th Ter Unit 1 Largo, FL | 1.0 | 1.0 | 624 | $1,325 | $2.12 | 25d | 1 | 0.29mi |
| 10160 Sailwinds Blvd S Largo, FL | 2.0 | 2.0 | 901 | $1,950 | $2.16 | 25d | 2 | 0.43mi |
| 10580 112th Ave Largo, FL | 3.0 | 1.0 | 925 | $1,995 | $2.16 | 5d | 1 | 0.44mi |
| 10155 Sailwinds Blvd S #204 Largo, FL | 2.0 | 2.0 | 1018 | $1,750 | $1.72 | 3d | 1 | 0.45mi |
| 10546 106th Ave N Unit a Largo, FL | 1.0 | 1.0 | 624 | $1,223 | $1.96 | 25d | 1 | 0.56mi |
| 11290 109th Ln Largo, FL | 2.0 | 1.0 | 988 | $1,995 | $2.02 | 25d | 1 | 0.74mi |
| 10932 104th Ave Largo, FL | 2.0 | 1.0 | 962 | $1,950 | $2.03 | 21d | 1 | 0.84mi |
| 10932 104th Ave Largo, FL | 2.0 | 1.0 | 962 | $1,950 | $2.03 | 25d | 1 | 0.84mi |
| 12100 Seminole Blvd Largo, FL | 2.0 | 2.0 | 1050 | $1,750 | $1.67 | 25d | 1 | 0.95mi |
| 12651 Seminole Blvd #44 Largo, FL | 2.0 | 1.5 | 1000 | $1,450 | $1.45 | 25d | 1 | 0.97mi |
| 11013 Temple Ave Seminole, FL | 3.0 | 1.0 | 951 | $2,050 | $2.16 | 5d | 1 | 1.21mi |
| 11201 122nd Ave Largo, FL | 1.0–2.0 | 1.0–2.0 | 867 | $2,300 | $2.65 | 5d | 2 | 1.23mi |
| 9700 Starkey Rd #322 Seminole, FL | 1.0 | 1.0 | 700 | $1,499 | $2.14 | 22d | 1 | 1.26mi |
| 9209 Seminole Blvd #139 Seminole, FL | 2.0 | 1.5 | 1015 | $1,800 | $1.77 | 25d | 1 | 1.27mi |
| 9992 86th St Seminole, FL | 2.0 | 2.0 | 945 | $1,900 | $2.01 | 4d | 1 | 1.28mi |
| 9209 Seminole Blvd Seminole, FL | 2.0 | 1.5 | 1015 | $1,675 | $1.65 | 5d | 3 | 1.35mi |
| 9209 Seminole Blvd Seminole, FL | 2.0 | 1.5 | 1015 | $1,700 | $1.67 | 4d | 2 | 1.35mi |
| 10888 Temple Ave Seminole, FL | 2.0 | 2.0 | 1101 | $2,150 | $1.95 | 4d | 1 | 1.35mi |
| 9319 91st Ter Seminole, FL | 3.0 | 2.0 | 952 | $2,549 | $2.68 | 25d | 1 | 1.38mi |
| 8800 Bardmoor Blvd Seminole, FL | 1.0–2.0 | 1.5–2.5 | 1045 | $1,950 | $1.87 | 12d | 2 | 1.40mi |
| 8703 Bardmoor Blvd #201 Seminole, FL | 2.0 | 2.0 | 1075 | $3,000 | $2.79 | 25d | 1 | 1.44mi |
HOA detail
- Monthly dues
- $206 · $2,472/yr
Listing history 37 events
-
2026-06-18days on market $99,950 Active 105 DOM
-
2026-06-17days on market $99,950 Active 104 DOM
-
2026-06-16days on market $99,950 Active 103 DOM
-
2026-06-15days on market $99,950 Active 102 DOM
-
2026-06-13days on market $99,950 Active 100 DOM
-
2026-06-09days on market $99,950 Active 96 DOM
-
2026-06-08days on market $99,950 Active 95 DOM
-
2026-06-07days on market $99,950 Active 94 DOM
-
2026-06-04days on market $99,950 Active 91 DOM
-
2026-06-03days on market $99,950 Active 90 DOM
-
2026-06-01days on market $99,950 Active 88 DOM
-
2026-05-31days on market $99,950 Active 87 DOM
-
2026-05-04price $99,950
-
2026-03-05$119,500 Active
-
2026-03-01historical
-
2026-02-19status Active
-
2026-02-19price $119,500
-
2026-02-19historical
-
2026-02-13$119,500 Active
-
2026-02-03historical
-
2025-12-10price $120,000
-
2025-11-06$149,900 Active
-
2025-09-20historical
-
2025-04-06price $158,950
-
2025-03-20$168,000 Active
-
2024-09-12historical
-
2024-07-30$179,900 Active
-
2024-06-01historical
-
2024-05-05price $163,000
-
2024-04-28$179,900 Active
-
2024-04-14historical
-
2024-04-08price $179,000
-
2024-03-31$189,900 Active
-
2018-11-16soldstatus $69,000 Sold
-
2018-10-28status Pending
-
2018-04-12$69,900 Active
-
1995-09-01soldstatus $23,000
ⓘ Source: listings_history table (triggers on properties + properties_extension) + one-shot
backfill from property_details.listing_events for pre-trigger history.
Tax reassessment forecast FL · Resets to sale price
- Current annual tax
- $1,608 · $134/mo
- Projected year-2 tax
- $1,608 · $134/mo
- Expected delta
- $0/yr ($0/mo · 0.0%)
ⓘ Screening estimate from a state-policy table — verify with the county assessor before closing.
Climate risk First Street
- Flood 9/10 Extreme FEMA zone AE · 99% chance over 30 yrs
- Wildfire 3/10 Moderate
- Heat 10/10 Extreme 6 d/yr ≥107°F today · 21 d/yr by 30 yrs out
- Wind 10/10 Extreme 99% chance of damaging wind over 30 yrs
- Air quality 3/10 Moderate 2 unhealthy d/yr today · 3 by 30 yrs out
Nearby sold comps map
Loading sold comps map…
Walkable amenities ~0.75 mi
Loading nearby amenities…
Taxation est. · year 1
- Rental income
- $22,397
- − Mortgage interest
- −$5,599
- − Property taxes
- −$1,608
- − Insurance
- −$5,618
- − Repairs & maintenance
- −$1,792
- − Management
- −$1,792
- − HOA
- −$2,472
- − Depreciation
- −$2,908
- Taxable income
- $609
- Est. tax owed @ 24.0%
- −$146
- After-tax cash flow
- $1,560/yr
For passive investors: Depreciation is non-cash, so a rental often shows a tax loss while cash-flowing — sheltering income. Rental losses are passive: they offset passive income freely, and up to $25,000/yr can offset ordinary (W-2) income if you actively participate and your MAGI is under $100k (phasing out to $0 by $150k); unused losses carry forward. On sale, claimed depreciation is recaptured at up to 25%, and gains may owe capital-gains tax (a 1031 exchange can defer both). Figures are a year-1 estimate at your 24.0% rate — not tax advice; consult a CPA.
Schools (NCES district)
- District
- Pinellas
- NCES district ID
- 1201560
- Math proficiency
- 51% ▼ -5.00%
- Reading proficiency
- 51% ▼ -3.00%
- Median HH income
- $46,270
- Composite
- 43.27/100
- National rank
- #3046
- State rank
- #31 of 73 in FL
Livability — Largo
- Score
- 82/100
- State rank
- #82
- US rank
- #1240
Category grades
Schools grade is shown separately in the Schools card above.
Census & demographics
- County
- Pinellas County · 939,478 people
- City population
- 106,311
- Metro
- Tampa-St. Petersburg-Clearwater, FL
- Population (ZIP)
- 16,741
- Household income
- $76,867
- Rent vs Own
- Severe rent burden
- 314.0
Population outlook (Pinellas County) Hauer SSP2
- Today (2025)
- 1,027,532 people
- By 2030
- 1,063,586 · +3.5%
- By 2040
- 1,125,020 · +9.5%
- By 2050
- 1,168,637 · +13.7%
- By 2075
- 1,265,188 · +23.1%
- By 2100
- 1,260,357 · +22.7%
Race, ethnicity, and origin ACS 2023
- Neighborhood character
- Predominantly White (75%)
- Race & ethnicity
- White 75% Two or more races 8% Hispanic / Latino 8% Asian 7% Black 5%
- Hispanic origin (detail)
- Mexican 2% Puerto Rican 3% Cuban 2%
- Common ancestry
- Romanian 4% Lithuanian 3% Italian 2%
- Foreign-born
- 12% · Canada, Vietnam, South Korea
- Languages at home
- 83% English-only · Spanish 5% Vietnamese 3% Other Indo-European 2%
Political lean MEDSL · Pinellas
- 2024 margin
- Lean R (+5.2) · D 46.9% · R 52.1%
- 2008→2024 swing
- -13.5pp toward R · 2008: 8.3pp · 2024: -5.2pp
- All cycles
- 2024: R+5.2 2020: D+0.2 2016: R+1.1 2012: D+5.6 2008: D+8.3
Not yet ingested
- Civics
- —
Market trends
- HPI YoY
- ▼ -367.92%
- Current HPI
- 319.4536
- Rent YoY
- ▼ -3.37%
- Metro
- Tampa-St. Petersburg-Clearwater, FL
- State GDP YoY
- ▲ 3.28%
- F500 in state
- 36
Industry mix (Fortune 500 HQ in FL)
| Industry | F500 HQs | Revenue |
|---|---|---|
| Industrial Technology | 2 | $29B |
|
||
| Insurance | 2 | $17B |
|
||
| Retail | 1 | $60B |
|
||
| Technology Distribution | 1 | $58B |
|
||
| Homebuilding | 1 | $35B |
|
||
| Technology Manufacturing | 1 | $35B |
|
||
Price history
+334.6% since first listed25 events — show timeline
- 2026-05-04 Price Changed $99,950 Stellar MLS as Distributed by MLS Grid
- 2026-03-05 Listed $119,500 Stellar MLS as Distributed by MLS Grid
- 2026-03-01 Listing Removed — Stellar MLS as Distributed by MLS Grid
- 2026-02-19 Relisted — Stellar MLS as Distributed by MLS Grid
- 2026-02-19 Price Changed $119,500 Stellar MLS as Distributed by MLS Grid
- 2026-02-19 Listing Removed — Stellar MLS as Distributed by MLS Grid
- 2026-02-13 Listed $119,500 Stellar MLS as Distributed by MLS Grid
- 2026-02-03 Listing Removed — Stellar MLS as Distributed by MLS Grid
- 2025-12-10 Price Changed $120,000 Stellar MLS as Distributed by MLS Grid
- 2025-11-06 Listed $149,900 Stellar MLS as Distributed by MLS Grid
- 2025-09-20 Listing Removed — Stellar MLS as Distributed by MLS Grid
- 2025-04-06 Price Changed $158,950 Stellar MLS as Distributed by MLS Grid
- 2025-03-20 Listed $168,000 Stellar MLS as Distributed by MLS Grid
- 2024-09-12 Listing Removed — Stellar MLS as Distributed by MLS Grid
- 2024-07-30 Listed $179,900 Stellar MLS as Distributed by MLS Grid
- 2024-06-01 Listing Removed — Stellar MLS as Distributed by MLS Grid
- 2024-05-05 Price Changed $163,000 Stellar MLS as Distributed by MLS Grid
- 2024-04-28 Listed $179,900 Stellar MLS as Distributed by MLS Grid
- 2024-04-14 Listing Removed — Stellar MLS as Distributed by MLS Grid
- 2024-04-08 Price Changed $179,000 Stellar MLS as Distributed by MLS Grid
- 2024-03-31 Listed $189,900 Stellar MLS as Distributed by MLS Grid
- 2018-11-16 Sold (MLS) $69,000 Stellar MLS as Distributed by MLS Grid
- 2018-10-28 Pending — Stellar MLS as Distributed by MLS Grid
- 2018-04-12 Listed $69,900 Stellar MLS as Distributed by MLS Grid
- 1995-09-01 Sold (Public Records) $23,000 Public Records
Property tax history
+4.3%/yrLatest (2025): $1,608 · +0.4% YoY. Source: county tax records.
Cash-flow waterfall
monthlySold comps — $/sqft
last 12 mo · ≤1 miLoading sold comps…