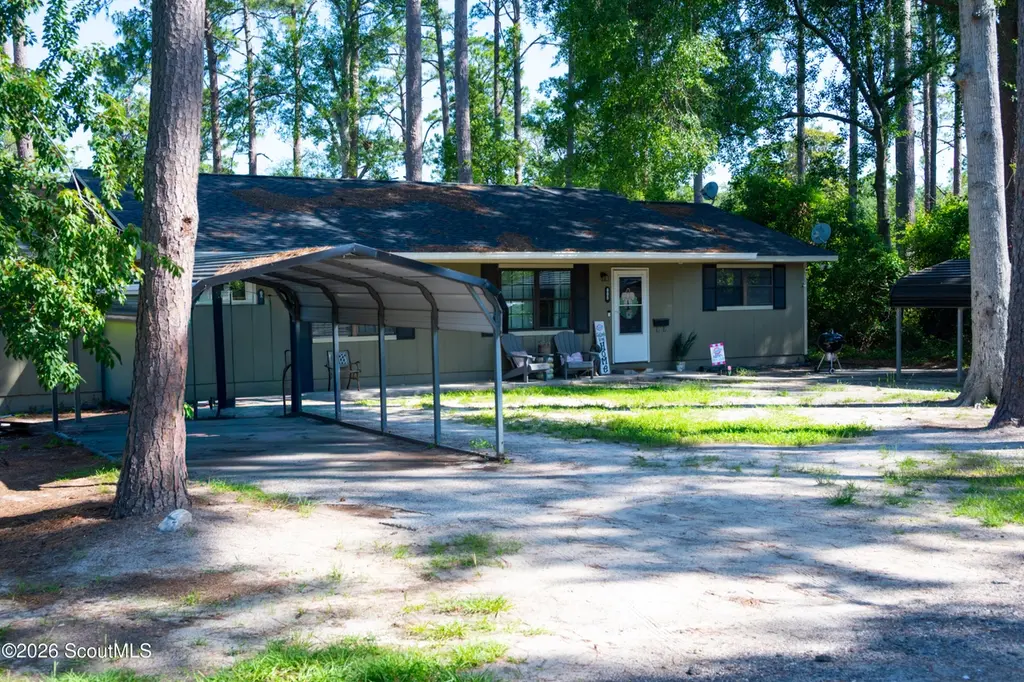
 Duplex
605 Oxford St · Waycross, GA
Flood risk 7/10 · Major
- FEMA flood zone
- X (unshaded)
- Chance of flooding over 30 yrs
- 0.99%
- Est. flood insurance / yr
- $507 – $1,088
Fire risk 3/10 · Minor
- Est. fire insurance / yr
- $963 – $1,789
Heat risk 8/10 · Major
- Hot days now (above 108°F)
- 7 days/yr
- Hot days in 30 yrs
- 21 days/yr
Wind risk 8/10 · Major
- Chance of severe wind over 30 yrs
- 99.0%
Air-quality risk 6/10 · Moderate
- Unhealthy air days now
- 10 days/yr
- Unhealthy air days in 30 yrs
- 12 days/yr
Risk factors via First Street. Map © Google.
Why this score? — see what drove the D grade
The composite is a weighted blend of 9 inputs, each scored 0–100. Each bar is that input's sub-score; the figure is the points it added to the 100-point composite (weight × sub-score).
- Cash flow +16.3/30.0
- ARV discount +7.5/15.0
- DSCR +5.0/10.0
- 1% rule +3.9/10.0
- Livability +2.8/5.0
- Schools +2.6/10.0
- Rent growth +2.5/5.0
- Condition / age +2.5/5.0
- Appreciation +0.0/10.0
$195,000
🖨 Deal sheet 📄 Offer letter ✓ Due diligence
Multi-family units
County records classify this as Multi-Family (2-4 Unit). Listing-text estimate: 2 units. confirmed
Listing remarks MLS
This duplex is a GREAT investment opportunity! The seller has had long term ownership with excellent success at keeping the units occupied. Ideal location in the center of town while offering a private feel surrounded by greenery at the end of a short, gravel street. Each unit has a nice size living and dining area, heated laundry, full kitchen, 2 bedrooms and 1 full bath. With a little polishing and updating, these units have the potential of becoming the local rental favorite!
Key facts
- 0.33 acre lot
- Built 1978
Property features AI
Exterior
- Utilities: Utility connections measured in feet for electric, gas, sewer, and water
- Exterior features: Lot approximately 0.33 acres
Interior
- Bedrooms: 4 main-level bedrooms
- Flooring: Laminate
- Bathrooms: 2 full bathrooms
- Interior features: Laminate flooring
Neighborhood map
What this means for you Summary
Snapshot
- This is a 2 × 2.0-bed/1.0-bath units multifamily listed at $195k.
Deal economics
- At list price, monthly cash flow is $40 ($484/yr) — positive. Per door: $20/mo.
- The deal already cash-flows at list — no discount required.
- To meet the 1% rule (rent ≥ 1% of price), the offer needs to be $174k (10.5% below list).
- Recommended offer: $174k (10.5% below list) — sets the bar for 1% rule.
- Cap rate 7.0% vs local median 5.1% in Waycross — top-decile yield for the area; either an underpriced asset or a hidden risk that comps aren't pricing in. Stress-test before assuming the spread holds.
Location & tenants
- Location reads 55/100 on livability (#519 in GA) — a working-class tenant base; expect higher turnover. Strengths: cost of living A+, housing A+; Watch: health & safety C-, schools D-, crime F.
- Ware County (town): math 27% / reading 35% proficiency, ranked #95 of 174 in GA (top 55%) — families likely to look elsewhere, expect single-tenant / working-renter base with shorter leases; 64% free/reduced lunch — lower-income household profile, screen leases tightly.
- Market conditions: 108 active listings in the ZIP; 2 comparable units currently listed for rent nearby; 45 units permitted in Ware County in 2024 (0 in 5+ unit buildings).
Forward outlook
- Local home prices are declining (-3.0%/yr); year-one equity from $1k of loan paydown is wiped out by about $6k of value loss. Plan a longer hold.
- Ware County population projected at -18% by 2050 — secular population decline; favor cash flow + early exit over multi-decade hold.
Negotiation context
- Only 1 days on market — expect competitive offers; lowballing is unlikely to land.
- 2 sale attempts since 3y ago with the ask held roughly flat each time — persistent listings suggest the price (not the market) is what's stuck; bring a comps-based counter.
- Current owner paid $140k; 39% above their basis — modest negotiation headroom, anchor on the comps not their cost.
Risks & watch-outs
- Watch-outs: flood insurance adds $66/mo.
- Climate carrying-cost: major flood risk; severe wind risk, 99% chance of damaging wind over 30y; extreme-heat days projected 7→21/yr by 2055 (HVAC capex compounding) — expect insurance premiums to compound above CPI over the hold.
Questions for the listing agent
- Can we see the unit-by-unit rent roll, current vacancy, and any below-market leases? What's the average tenancy length?
- What capital expenditures (roof, boiler, parking lot, exteriors) have been made in the last 5 years, and what's planned in the next 2?
- Built in 1978 — when were the roof, HVAC, electrical panel, plumbing, and water heater last replaced?
- What's the actual annual flood-insurance premium (NFIP or private), and is the property in a SFHA with mandatory coverage?
- Is there a deadline driving the sale (1031 exchange, divorce, estate, relocation)? That informs how much negotiation room exists.
- Schools are D-rated, which usually means shorter tenancies and higher turnover. Who's the typical renter profile here, and what's been the actual vacancy rate?
- Crime grade is F in this area — have there been break-ins, vandalism, or insurance claims at this property in the last 3 years? What carrier currently insures it and at what premium?
- The area grade is low — what's the realistic commute time and amenity access for the typical tenant pool here? Any planned neighborhood developments (good or bad) we should know about?
- What's the average days-on-market for RENTAL listings here right now (not sales)? A rising rental-DOM trend means longer vacancies and softer asking-rent achievability than the comps imply.
- What's the recent tenant-quality profile in this submarket — average credit score on applications, eviction rate, late-payment / NSF rate, and stable-employment percentage? A property-management company in the area should have these aggregated.
- How much new apartment / multifamily construction is in the pipeline within 1–3 miles? Heavy new supply (>2% of stock underway) typically softens rents 12–24 months out; light construction supports rent growth.
Investment metrics
- 1% rule
- 0.89% ✗
- Cap rate
- 6.95%
- Cash-on-cash
- 2.35%
- DSCR
- 1.10
- GRM
- 9.3
CMA / ARV
No comps found within radius.
Projected returns pro-forma
-3.0% appreciation · 3.0% rent growth · sell at horizon
- IRR
- -14.9%
- Equity multiple
- 0.47×
- Total profit
- $-29,007
- Equity at exit
- $29,075
- IRR
- -6.2%
- Equity multiple
- 0.60×
- Total profit
- $-21,864
- Equity at exit
- $16,860
Cash invested: $54,600 (down + closing). Projections, not guarantees.
Landlord ↔ Tenant lean methodology
- Overall (STATE)
- 90 Strongly Landlord-Friendly
- State Georgia
- 90 Strongly Landlord-Friendly · R+3
- County
- — inherits STATE
- City
- — inherits STATE
ZIP-level market 31501
- Home prices YoY
- -29.3%
- Active inventory
- 108
- Price-to-rent
- 18.6×
Monthly cashflow live
- Estimated rent
- $1,745 medium interval (Pro) →
- Mortgage (P&I)
- −$1,023
- Tax from tax record
- −$168 /mo · $2,014/yr
- Insurance
- −$81
- Flood insurance flood zone
- −$66 /mo · $798/yr
- HOA
- −$0
- Vacancy / Maint / Mgmt
- −$366
- Net cashflow
- $40
Break-even live
2-unit breakdown (identical units grouped — click to expand)
| Units | Beds | Baths | Est. rent |
|---|---|---|---|
| 2× units | 2.0 | 1 | $1,746 |
| #1 | 2.0 | 1 | $873 |
| #2 | 2.0 | 1 | $873 |
| Total (2 units) | $1,745 | ||
UW: 25.0% down · 7.5% · 30yr · 1.5% tax · 5.0% vac · 8.0% maint · 8.0% mgmt
Financing live
Cash to close
- Down payment
- $48,750
- Closing costs
- $5,850
- Reserves months
- —
- Total cash needed
- —
Loan-product check · same deal, 3 products live
Conventional
25% down · 7.5% · 30yr
- Down + closing
- —
- Monthly P&I
- —
- Monthly cashflow
- —
- DSCR
- —
- Eligible?
- —
Personal DTI + credit; lowest rate.
DSCR
20% down · 8.5% · 30yr
- Down + closing
- —
- Monthly P&I
- —
- Monthly cashflow
- —
- DSCR
- —
- Eligible?
- —
No personal income docs; deal must DSCR.
Hard money
10% down · 12.0% · 12mo
- Down + closing
- —
- Monthly P&I
- —
- Monthly cashflow
- —
- DSCR
- —
- Eligible?
- —
Short-term bridge; refi at stabilization.
Rent comps 2 comps
| Address | Beds | Baths | Sqft | Rent | $/sqft | DOM | Units | Dist |
|---|---|---|---|---|---|---|---|---|
| 808 Satilla Blvd Waycross, GA | 3.0 | 2.0 | 1600 | $2,000 | $1.25 | 43d | 1 | 0.19mi |
| 801 Naomi St Waycross, GA | 2.0–4.0 | 1.0–2.0 | 1109 | $1,000 | $0.90 | 43d | 1 | 0.68mi |
Listing history 3 events
-
2026-06-14status $195,000 Pending 1 DOM
-
2026-06-12remarks 648-char remark
-
2026-06-12$195,000 Active 1 DOM
ⓘ Source: listings_history table (triggers on properties + properties_extension) + one-shot
backfill from property_details.listing_events for pre-trigger history.
Tax reassessment forecast GA · Resets to sale price
- Current annual tax
- $2,014 · $168/mo
- Projected year-2 tax
- $2,014 · $168/mo
- Expected delta
- $0/yr ($0/mo · 0.0%)
ⓘ Screening estimate from a state-policy table — verify with the county assessor before closing.
Climate risk First Street
- Flood 7/10 Severe FEMA zone X (unshaded) · 99% chance over 30 yrs
- Wildfire 3/10 Moderate
- Heat 8/10 Severe 7 d/yr ≥108°F today · 21 d/yr by 30 yrs out
- Wind 8/10 Severe 99% chance of damaging wind over 30 yrs
- Air quality 6/10 Major 10 unhealthy d/yr today · 12 by 30 yrs out
Nearby sold comps map
Loading sold comps map…
Walkable amenities ~0.75 mi
Loading nearby amenities…
Taxation est. · year 1
- Rental income
- $20,940
- − Mortgage interest
- −$10,923
- − Property taxes
- −$2,014
- − Insurance
- −$1,772
- − Repairs & maintenance
- −$1,675
- − Management
- −$1,675
- − Depreciation
- −$5,673
- Taxable loss
- −$2,793
- Est. tax savings @ 24.0%
- +$670
- After-tax cash flow
- $1,155/yr
For passive investors: Depreciation is non-cash, so a rental often shows a tax loss while cash-flowing — sheltering income. Rental losses are passive: they offset passive income freely, and up to $25,000/yr can offset ordinary (W-2) income if you actively participate and your MAGI is under $100k (phasing out to $0 by $150k); unused losses carry forward. On sale, claimed depreciation is recaptured at up to 25%, and gains may owe capital-gains tax (a 1031 exchange can defer both). Figures are a year-1 estimate at your 24.0% rate — not tax advice; consult a CPA.
Schools (NCES district)
- District
- Ware County
- NCES district ID
- 1305430
- Math proficiency
- 27% ▼ -18.00%
- Reading proficiency
- 35% ▼ -12.00%
- Median HH income
- $35,231
- Composite
- 25.6/100
- National rank
- #7415
- State rank
- #95 of 174 in GA
Livability — Waycross
- Score
- 55/100
- State rank
- #519
- US rank
- #23458
Category grades
Schools grade is shown separately in the Schools card above.
Census & demographics
- Census place
- Waycross, GA
- City population
- 36,207
- Population (ZIP)
- 13,034
Population outlook (Ware County) Hauer SSP2
- Today (2025)
- 33,313 people
- By 2030
- 32,071 · -3.7%
- By 2040
- 29,587 · -11.2%
- By 2050
- 27,197 · -18.4%
- By 2075
- 22,323 · -33.0%
- By 2100
- 18,197 · -45.4%
Race, ethnicity, and origin ACS 2023
- Neighborhood character
- Diverse neighborhood (Simpson 0.55)
- Race & ethnicity
- White 49% Black 45% Two or more races 3% Hispanic / Latino 2%
- Common ancestry
- Slovak 1% Lithuanian 1% Scottish 1%
- Foreign-born
- 2% · Canada
- Languages at home
- 98% English-only · Spanish 1%
Political lean MEDSL · Ware
- 2024 margin
- Solid R (+43.1) · D 28.3% · R 71.4%
- 2008→2024 swing
- -8.7pp toward R · 2008: -34.5pp · 2024: -43.1pp
- All cycles
- 2024: R+43.1 2020: R+40.4 2016: R+41.7 2012: R+33.9 2008: R+34.5
Not yet ingested
- Civics
- —
Market trends
- HPI YoY
- ▼ -100.90%
- Current HPI
- 243.5058
- Rent YoY
- —
- Metro
- —
- State GDP YoY
- ▲ 2.66%
- F500 in state
- 28
Industry mix (Fortune 500 HQ in GA)
| Industry | F500 HQs | Revenue |
|---|---|---|
| Paper / Packaging | 2 | $29B |
|
||
| Retail | 1 | $160B |
|
||
| Transportation / Logistics | 1 | $91B |
|
||
| Airlines | 1 | $62B |
|
||
| Consumer Goods | 1 | $47B |
|
||
| Utilities | 1 | $25B |
|
||
Price history
+50.0% since first listed4 events — show timeline
- 2026-06-12 Listed $195,000 GIAR
- 2023-06-22 Sold (Public Records) $140,000 Public Records
- 2023-06-20 Sold (MLS) $140,000 SEGAMLS
- 2023-05-26 Listed $130,000 SEGAMLS
Property tax history
+3.1%/yrLatest (2025): $2,014 · +14.6% YoY. Source: county tax records.
Cash-flow waterfall
monthlySold comps — $/sqft
last 12 mo · ≤1 miLoading sold comps…