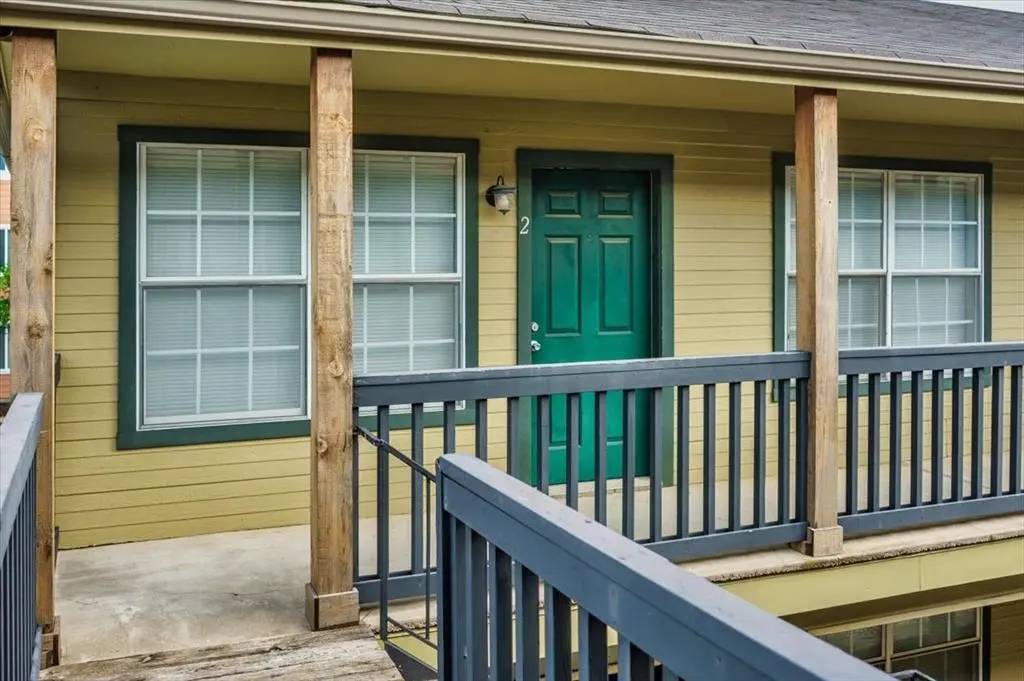
1326 S 11 St #2 · Waco, TX
Flood risk 1/10 · Minimal
- FEMA flood zone
- X (unshaded)
- Chance of flooding over 30 yrs
- 0.0%
- Est. flood insurance / yr
- $507 – $1,088
Fire risk 2/10 · Minimal
- Est. fire insurance / yr
- $1,222 – $2,270
Heat risk 8/10 · Major
- Hot days now (above 109°F)
- 7 days/yr
- Hot days in 30 yrs
- 25 days/yr
Wind risk 6/10 · Moderate
- Chance of severe wind over 30 yrs
- 55.0%
Air-quality risk 1/10 · Minimal
- Unhealthy air days now
- 0 days/yr
- Unhealthy air days in 30 yrs
- 0 days/yr
Risk factors via First Street. Map © Google.
Why this score? — see what drove the D+ grade
The composite is a weighted blend of 9 inputs, each scored 0–100. Each bar is that input's sub-score; the figure is the points it added to the 100-point composite (weight × sub-score).
- Cash flow +17.8/30.0
- ARV discount +7.5/15.0
- 1% rule +6.7/10.0
- DSCR +5.6/10.0
- Condition / age +3.8/5.0
- Livability +3.7/5.0
- Rent growth +3.0/5.0
- Schools +1.8/10.0
- Appreciation +0.0/10.0
$96,500
🖨 Deal sheet (PDF) 📄 Offer letter ✓ Due diligence
Key facts
- 1,307 sq ft lot
- Pool
- Built 1982
Neighborhood map
What this means for you Summary
Snapshot
- This is a 1-bed/1.0-bath condo listed at $96k. Condition is rated good.
Deal economics
- At list price, monthly cash flow is $79 ($945/yr) — positive.
- The deal already cash-flows at list — no discount required.
- Meets the 1% rule at list price ($1k rent vs $96k).
- Recommended offer: $91k (6.0% below list) — sets the bar for market timing.
- Cap rate 7.3% vs local median 3.9% in Waco — top-decile yield for the area; either an underpriced asset or a hidden risk that comps aren't pricing in. Stress-test before assuming the spread holds.
Location & tenants
- Location reads 74/100 on livability (#166 in TX, #4,378 nationally) — a middle-class / working-renter tenant base. Strengths: cost of living A+, housing A+, health & safety A+; Watch: crime D, commute F, employment D-.
- Waco ISD (urban): math 20% / reading 24% proficiency, ranked #773 of 826 in TX (top 94%) — low school quality limits family demand, transient renter base, plan for 1-2y turnover; 81% free/reduced lunch — lower-income household profile, screen leases tightly.
- Zoned schools: South Waco El (math 8% / reading 22%, grade F, #4,021 of 4,322 statewide, top 94%, 462 students, 96% FRL); Cesar Chavez Middle (math 16% / reading 24%, grade F, #1,428 of 1,662 statewide, top 87%, 840 students, 94% FRL); University H S (math 39% / reading 31%, grade F, #954 of 1,632 statewide, top 59%, 1,678 students, 89% FRL).
- Market conditions: Rents rising (+1.9%/yr); 318 active listings in the ZIP; 40 comparable units currently listed for rent nearby; rentals at typical pace (median 23d on market — plan ~3-4 weeks tenant-placement turnaround); lower-income renter base — watch delinquency; 1,014 units permitted in McLennan County in 2024 (200 in 5+ unit buildings).
- This rent runs 33% of the median local income ($42k/yr) — at the standard rent-burdened threshold; future hikes will face affordability resistance.
Forward outlook
- Local home prices are declining (-3.0%/yr); year-one equity from $667 of loan paydown is wiped out by about $3k of value loss. Plan a longer hold.
- McLennan County population projected at +17% by 2050 — long-run rental-demand tailwind backs the buy-and-hold thesis.
Negotiation context
- It's been on market 83 days — a 6% lower offer ($91k) is reasonable based on typical stale-listing flexibility.
- 5 sale attempts since 4y ago with the ask held roughly flat each time — persistent listings suggest the price (not the market) is what's stuck; bring a comps-based counter.
Risks & watch-outs
- Climate carrying-cost: major wind risk, 55% chance of damaging wind over 30y; extreme-heat days projected 7→25/yr by 2055 (HVAC capex compounding) — expect insurance premiums to compound above CPI over the hold.
Questions for the listing agent
- It's been on market 83 days. Have you received any prior offers? Is the seller open to a 6% concession, seller financing, or rate buy-down credit?
- What does the HOA fee cover, when was the last increase, and are there any pending special assessments or reserve-fund shortfalls?
- Any open or pending special assessments — roof, HVAC, plumbing, elevator, façade? What's the per-unit balance and payoff schedule, and is the seller paying it off at close or rolling it to the buyer?
- Why hasn't it sold? Are there any deal-killer items the seller is aware of (foundation, flood, title, zoning, code violations)?
- Is there a deadline driving the sale (1031 exchange, divorce, estate, relocation)? That informs how much negotiation room exists.
- Schools are D-rated, which usually means shorter tenancies and higher turnover. Who's the typical renter profile here, and what's been the actual vacancy rate?
- Crime grade is D in this area — have there been break-ins, vandalism, or insurance claims at this property in the last 3 years? What carrier currently insures it and at what premium?
- The area grade is low — what's the realistic commute time and amenity access for the typical tenant pool here? Any planned neighborhood developments (good or bad) we should know about?
- What's the average days-on-market for RENTAL listings here right now (not sales)? A rising rental-DOM trend means longer vacancies and softer asking-rent achievability than the comps imply.
- What's the recent tenant-quality profile in this submarket — average credit score on applications, eviction rate, late-payment / NSF rate, and stable-employment percentage? A property-management company in the area should have these aggregated.
- How much new apartment / multifamily construction is in the pipeline within 1–3 miles? Heavy new supply (>2% of stock underway) typically softens rents 12–24 months out; light construction supports rent growth.
Investment metrics
- 1% rule
- 1.17% ✓
- Cap rate
- 7.27%
- Cash-on-cash
- 3.50%
- DSCR
- 1.16
- GRM
- 7.1
CMA / ARV
No comps found within radius.
Projected returns pro-forma
-3.0% appreciation · 1.86% rent growth · sell at horizon
- IRR
- -12.2%
- Equity multiple
- 0.56×
- Total profit
- $-11,799
- Equity at exit
- $14,388
- IRR
- -5.1%
- Equity multiple
- 0.68×
- Total profit
- $-8,529
- Equity at exit
- $8,344
Cash invested: $27,020 (down + closing). Projections, not guarantees.
Landlord ↔ Tenant lean methodology
- Overall (STATE)
- 87 Strongly Landlord-Friendly
- State Texas
- 87 Strongly Landlord-Friendly · R+5
- County
- — inherits STATE
- City
- — inherits STATE
ZIP-level market 76706
- Home prices YoY
- -29.1%
- Rents YoY
- 1.9%
- Active inventory
- 318
- Price-to-rent
- 7.1×
Monthly cashflow live
- Estimated rent
- $1,134 high interval (Pro) →
- Mortgage (P&I)
- −$506
- Tax est. 1.5%
- −$121 /mo · $1,448/yr
- Insurance
- −$40
- HOA
- −$150
- Vacancy / Maint / Mgmt
- −$238
- Net cashflow
- $79
Break-even live
Sensitivity live
| Price | -10% $145 | -5% $112 | +0% $79 | +5% $45 | +10% $12 |
|---|---|---|---|---|---|
| Rent | -10% $-11 | -5% $34 | +0% $79 | +5% $124 | +10% $168 |
| Rate | -1.0pp $127 | -0.5pp $103 | base $79 | +0.5pp $54 | +1.0pp $28 |
UW: 25.0% down · 7.5% · 30yr · 1.5% tax · 5.0% vac · 8.0% maint · 8.0% mgmt
Financing live
Cash to close
- Down payment
- $24,125
- Closing costs
- $2,895
- Reserves months
- —
- Total cash needed
- —
Loan-product check · same deal, 3 products live
Conventional
25% down · 7.5% · 30yr
- Down + closing
- —
- Monthly P&I
- —
- Monthly cashflow
- —
- DSCR
- —
- Eligible?
- —
Personal DTI + credit; lowest rate.
DSCR
20% down · 8.5% · 30yr
- Down + closing
- —
- Monthly P&I
- —
- Monthly cashflow
- —
- DSCR
- —
- Eligible?
- —
No personal income docs; deal must DSCR.
Hard money
10% down · 12.0% · 12mo
- Down + closing
- —
- Monthly P&I
- —
- Monthly cashflow
- —
- DSCR
- —
- Eligible?
- —
Short-term bridge; refi at stabilization.
Rent comps 40 comps
| Address | Beds | Baths | Sqft | Rent | $/sqft | DOM | Units | Dist |
|---|---|---|---|---|---|---|---|---|
| 1300 S 11th St Waco, TX | 2.0 | 2.5 | 1083 | $1,209 | $1.12 | 15d | 14 | 0.06mi |
| 1348 S 12th St Waco, TX | 2.0 | 2.0 | 958 | $1,300 | $1.36 | 22d | 1 | 0.07mi |
| 1214 Baylor Ave Waco, TX | 2.0 | 2.0 | 832 | $1,020 | $1.23 | 22d | 1 | 0.13mi |
| 1214 Baylor Ave Waco, TX | 1.0–2.0 | 1.0–2.0 | 736 | $795 | $1.08 | 45d | 2 | 0.13mi |
| 1214 Baylor Ave Waco, TX | 1.0–2.0 | 1.0–2.0 | 832 | $795 | $0.96 | 15d | 2 | 0.13mi |
| 1421 S 12th St Unit A Waco, TX | 2.0 | 2.5 | — | $799 | — | 45d | 1 | 0.14mi |
| 1421 S 12th St Waco, TX | 2.0 | 2.0 | 928 | $985 | $1.06 | 15d | 3 | 0.14mi |
| 1226 Baylor Ave Waco, TX | 2.0 | 2.0–2.5 | 1024 | $1,337 | $1.31 | 15d | 2 | 0.14mi |
| 1226 Baylor Ave Waco, TX | 2.0 | 2.0–2.5 | 1024 | $1,350 | $1.32 | 22d | 2 | 0.14mi |
| 1508 S 13th St Waco, TX | 1.0–2.0 | 1.0 | 775 | $750 | $0.97 | 15d | 1 | 0.18mi |
| 1120 James Ave Unit Brownstone 205 Waco, TX | 1.0 | 1.0 | 650 | $795 | $1.22 | 22d | 1 | 0.22mi |
| 1311 Speight Ave Waco, TX | 2.0 | 2.5 | 1143 | $1,195 | $1.05 | 15d | 1 | 0.22mi |
| 1326 Park Ave Waco, TX | 2.0 | 2.5 | 1143 | $1,400 | $1.22 | 22d | 1 | 0.22mi |
| 1326 Park Ave Waco, TX | 2.0 | 2.5 | 1143 | $1,400 | $1.22 | 15d | 1 | 0.22mi |
| 1311 Speight Ave #1311 Waco, TX | 2.0 | 2.5 | 1143 | $1,500 | $1.31 | 22d | 1 | 0.23mi |
| 1701 S 12th St Unit 5202 Waco, TX | 2.0 | 2.5 | — | $1,250 | — | 22d | 1 | 0.23mi |
| 1342 Park Ave Waco, TX | 2.0 | 2.5 | 1143 | $1,400 | $1.22 | 15d | 1 | 0.25mi |
| 1226 James Ave Waco, TX | 2.0 | 2.0 | — | $975 | — | 22d | 1 | 0.27mi |
| 1911 S 8th St Waco, TX | 2.0 | 1.0 | 798 | $1,198 | $1.50 | 22d | 1 | 0.43mi |
| 1925 S 12th St Waco, TX | 2.0 | 2.5 | — | $1,200 | — | 22d | 1 | 0.44mi |
| 600 Bagby Ave Waco, TX | 2.0 | 2.0–2.5 | 1102 | $1,496 | $1.36 | 22d | 2 | 0.45mi |
| 600 Bagby Ave Waco, TX | 2.0–3.0 | 2.5 | 1206 | $1,500 | $1.24 | 45d | 3 | 0.45mi |
| 1521 Bagby Ave Apt I Waco, TX | 1.0 | 1.0 | — | $900 | — | 45d | 1 | 0.46mi |
| 2005 S 8th St Waco, TX | 1.0–2.0 | 1.0–2.0 | 685 | $725 | $1.06 | 15d | 2 | 0.48mi |
| 715 Cleveland Ave Waco, TX | 1.0–3.0 | 1.0–3.0 | 845 | $1,143 | $1.35 | 15d | 23 | 0.49mi |
| 2011 S 8th St Waco, TX | 1.0 | 1.0 | — | $950 | — | 22d | 1 | 0.51mi |
| 2011 S 8th St Waco, TX | 1.0 | 1.0 | — | $950 | — | 45d | 1 | 0.51mi |
| 1920 S 16th St Waco, TX | 2.0 | 2.5 | — | $1,275 | — | 15d | 1 | 0.57mi |
| 1800 S 5th St Waco, TX | 2.0 | 2.0 | 900 | $1,240 | $1.38 | 22d | 1 | 0.59mi |
| 412 University St Waco, TX | 2.0 | 1.0 | 864 | $1,895 | $2.19 | 22d | 1 | 0.61mi |
| 709 S 6th St Waco, TX | 1.0 | 1.0 | 655 | $925 | $1.41 | 22d | 1 | 0.62mi |
| 410 Daughtrey Ave Waco, TX | 1.0 | 2.0 | 897 | $1,000 | $1.11 | 22d | 1 | 0.68mi |
| 1901 Dutton Ave Waco, TX | 2.0 | 1.0 | 864 | $1,400 | $1.62 | 15d | 1 | 0.70mi |
| 1825 S 3rd St Waco, TX | 2.0 | 2.0 | — | $525 | — | 22d | 1 | 0.70mi |
| 700 S 4th St Waco, TX | 1.0–3.0 | 1.0–2.0 | 889 | $1,175 | $1.32 | 15d | 12 | 0.79mi |
| 2100 S 19th St Waco, TX | 1.0 | 1.0 | 684 | $1,300 | $1.90 | 22d | 1 | 0.83mi |
| 700 Franklin Ave Waco, TX | 1.0 | 1.0 | 702 | $1,200 | $1.71 | 22d | 1 | 0.95mi |
| 700 Franklin Ave Waco, TX | 2.0 | 2.0 | 802 | $1,500 | $1.87 | 45d | 1 | 0.95mi |
| 2227 S 3rd St Waco, TX | 2.0–3.0 | 2.0–3.0 | — | $1,550 | — | 15d | 1 | 0.96mi |
| 2000 S 1st St Waco, TX | 2.0–5.0 | 1.0–3.0 | 1318 | $699 | $0.53 | 15d | 19 | 0.98mi |
HOA detail condo
- Monthly dues
- $150 · $1,800/yr
- Assessments
- None detected in remarks — confirm with the listing agent.
Listing history 26 events
-
2026-06-21days on market $96,500 Active 83 DOM
-
2026-06-18days on market $96,500 Active 80 DOM
-
2026-06-17days on market $96,500 Active 79 DOM
-
2026-06-16days on market $96,500 Active 78 DOM
-
2026-06-15days on market $96,500 Active 77 DOM
-
2026-06-14days on market $96,500 Active 75 DOM
-
2026-06-13days on market $96,500 Active 74 DOM
-
2026-06-10days on market $96,500 Active 72 DOM
-
2026-06-09days on market $96,500 Active 71 DOM
-
2026-06-08days on market $96,500 Active 70 DOM
-
2026-06-07days on market $96,500 Active 69 DOM
-
2026-06-05days on market $96,500 Active 66 DOM
-
2026-06-03days on market $96,500 Active 65 DOM
-
2026-06-02days on market $96,500 Active 64 DOM
-
2026-06-01days on market $96,500 Active 63 DOM
-
2026-05-31days on market $96,500 Active 62 DOM
-
2026-05-30days on market $96,500 Active 61 DOM
-
2026-03-27$96,500 Active
-
2025-08-21historical
-
2025-05-06$96,500 Active
-
2024-12-18historical
-
2024-09-04$99,000
-
2024-08-14historical
-
2024-04-23$99,000
-
2023-11-30historical
-
2022-10-09$97,500
ⓘ Source: listings_history table (triggers on properties + properties_extension) + one-shot
backfill from property_details.listing_events for pre-trigger history.
Climate risk First Street
- Flood 1/10 Low FEMA zone X (unshaded) · 0% chance over 30 yrs
- Wildfire 2/10 Low
- Heat 8/10 Severe 7 d/yr ≥109°F today · 25 d/yr by 30 yrs out
- Wind 6/10 Major 55% chance of damaging wind over 30 yrs
- Air quality 1/10 Low 0 unhealthy d/yr today · 0 by 30 yrs out
Nearby sold comps map
Loading sold comps map…
Walkable amenities ~0.75 mi
Loading nearby amenities…
Taxation est. · year 1
- Rental income
- $13,605
- − Mortgage interest
- −$5,406
- − Property taxes
- −$1,448
- − Insurance
- −$482
- − Repairs & maintenance
- −$1,088
- − Management
- −$1,088
- − HOA
- −$1,800
- − Depreciation
- −$2,807
- Taxable loss
- −$515
- Est. tax savings @ 24.0%
- +$124
- After-tax cash flow
- $1,068/yr
For passive investors: Depreciation is non-cash, so a rental often shows a tax loss while cash-flowing — sheltering income. Rental losses are passive: they offset passive income freely, and up to $25,000/yr can offset ordinary (W-2) income if you actively participate and your MAGI is under $100k (phasing out to $0 by $150k); unused losses carry forward. On sale, claimed depreciation is recaptured at up to 25%, and gains may owe capital-gains tax (a 1031 exchange can defer both). Figures are a year-1 estimate at your 24.0% rate — not tax advice; consult a CPA.
Condition & rehab AI · 11 photos
This condo is in good condition with cosmetic updates needed to enhance its curb appeal and resale value.
Value-add opportunities
- Both Paint exterior — Enhances curb appeal and resale value
- Both Replace carpet with hardwood — Improves aesthetics and rental appeal
- Both Update kitchen appliances — Modernizes kitchen and attracts buyers
- Both Install new bathroom fixtures — Enhances bathroom functionality and appeal
Renovation cost estimate screening
Value-add ROI direction
- Both Paint exterior — Enhances curb appeal and resale value ↑
- Both Replace carpet with hardwood — Improves aesthetics and rental appeal ↑
- Both Update kitchen appliances — Modernizes kitchen and attracts buyers ↑
- Both Install new bathroom fixtures — Enhances bathroom functionality and appeal ↑
ⓘ Cost ranges are severity-bucket heuristics (US national rule-of-thumb). Get contractor quotes + a written scope before underwriting a rehab budget.
Schools (NCES district)
- District
- Waco ISD
- NCES district ID
- 4844280
- Math proficiency
- 20% ▼ -14.00%
- Reading proficiency
- 24% ▼ -6.00%
- Median HH income
- $29,208
- Composite
- 17.57/100
- National rank
- #9043
- State rank
- #773 of 826 in TX
Livability — Waco
- Score
- 74/100
- State rank
- #166
- US rank
- #4378
Category grades
Schools grade is shown separately in the Schools card above.
Census & demographics
- Census place
- Waco, TX
- County
- McLennan County · 213,088 people
- City population
- 125,319
- Metro
- Waco, TX
- Population (ZIP)
- 41,627
- Household income
- $41,656
- Rent vs Own
- Severe rent burden
- 3883.0
Population outlook (McLennan County) Hauer SSP2
- Today (2025)
- 264,191 people
- By 2030
- 273,578 · +3.6%
- By 2040
- 291,506 · +10.3%
- By 2050
- 308,044 · +16.6%
- By 2075
- 349,648 · +32.3%
- By 2100
- 364,779 · +38.1%
Race, ethnicity, and origin ACS 2023
- Neighborhood character
- Diverse neighborhood (Simpson 0.64)
- Race & ethnicity
- White 49% Hispanic / Latino 31% Two or more races 17% Black 15% Asian 3%
- Hispanic origin (detail)
- Mexican 29%
- Common ancestry
- Lithuanian 1% Iranian 1% Romanian 1%
- Foreign-born
- 9% · Canada, Vietnam, China
- Languages at home
- 78% English-only · Spanish 19% Other Indo-European 1%
Political lean MEDSL · McLennan
- 2024 margin
- Solid R (+30.9) · D 34.0% · R 64.9% · Other 1.0%
- 2008→2024 swing
- -7.0pp toward R · 2008: -23.9pp · 2024: -30.9pp
- All cycles
- 2024: R+30.9 2020: R+23.4 2016: R+27.1 2012: R+29.8 2008: R+23.9
Not yet ingested
- Civics
- —
Market trends
- HPI YoY
- ▼ -94.31%
- Current HPI
- 230.2557
- Rent YoY
- ▲ 1.86%
- Metro
- Waco, TX
- State GDP YoY
- ▲ 3.95%
- F500 in state
- 110
Industry mix (Fortune 500 HQ in TX)
| Industry | F500 HQs | Revenue |
|---|---|---|
| Energy | 16 | $1,198B |
|
||
| Technology | 5 | $198B |
|
||
| Engineering / Construction | 4 | $72B |
|
||
| Energy Services | 3 | $60B |
|
||
| Utilities | 3 | $41B |
|
||
| Healthcare | 2 | $330B |
|
||
Price history
-1.0% since first listed9 events — show timeline
- 2026-03-27 Listed $96,500 NTREIS
- 2025-08-21 Listing Removed — NTREIS
- 2025-05-06 Listed $96,500 NTREIS
- 2024-12-18 Listing Removed — NTREIS
- 2024-09-04 Listed $99,000 NTREIS
- 2024-08-14 Listing Removed — NTREIS
- 2024-04-23 Listed $99,000 NTREIS
- 2023-11-30 Listing Removed — NTREIS
- 2022-10-09 Listed $97,500 NTREIS
Cash-flow waterfall
monthlySold comps — $/sqft
last 12 mo · ≤1 miLoading sold comps…