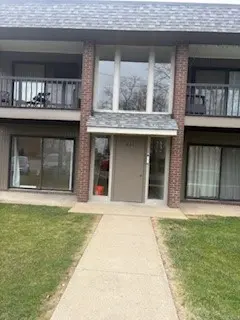
601 College Park Dr #4 · Moon, PA
Flood risk 1/10 · Minimal
- FEMA flood zone
- X (unshaded)
- Chance of flooding over 30 yrs
- 0.0%
- Est. flood insurance / yr
- $507 – $1,088
Fire risk 1/10 · Minimal
- Est. fire insurance / yr
- $511 – $949
Heat risk 3/10 · Minor
- Hot days now (above 96°F)
- 7 days/yr
- Hot days in 30 yrs
- 17 days/yr
Wind risk 2/10 · Minimal
- Chance of severe wind over 30 yrs
- —
Air-quality risk 3/10 · Minor
- Unhealthy air days now
- 2 days/yr
- Unhealthy air days in 30 yrs
- 3 days/yr
Risk factors via First Street. Map © Google.
Why this score? — see what drove the C- grade
The composite is a weighted blend of 9 inputs, each scored 0–100. Each bar is that input's sub-score; the figure is the points it added to the 100-point composite (weight × sub-score).
- Cash flow +16.8/30.0
- ARV discount +10.0/15.0
- 1% rule +8.0/10.0
- Schools +5.3/10.0
- DSCR +5.2/10.0
- Rent growth +3.5/5.0
- Livability +2.5/5.0
- Condition / age +2.5/5.0
- Appreciation +0.0/10.0
$93,000
🖨 Deal sheet (PDF) 📄 Offer letter ✓ Due diligence
Listing remarks MLS
Ideal purchase for an investor, young family. Centrally located, Walking distance for shopping, dining and University. Pool is available for a fee, Club house is also available for rental. Pool and Club house are nearby.
Key facts
- Centrally located
- Pool nearby
- Club house nearby
Tags
Neighborhood map
What this means for you Summary
Snapshot
- This is a 1-bed/1.0-bath condo listed at $93k.
Deal economics
- At list price, monthly cash flow is $60 ($721/yr) — positive.
- The deal already cash-flows at list — no discount required.
- Meets the 1% rule at list price ($1k rent vs $93k).
- Recommended offer: $90k (3.0% below list) — sets the bar for market timing.
Location & tenants
- Location reads: area grade C — affects rentability + tenant quality, not the cash-flow math above.
- Moon Area SD (suburban): math 50% / reading 70% proficiency, ranked #62 of 539 in PA (top 12%) — acceptable for families but not a draw, mixed tenant base, ~2y average lease; only 16% free/reduced lunch — higher-income household profile.
- Market conditions: Rents rising fast (+4.1%/yr); 177 active listings in the ZIP; 8 comparable units currently listed for rent nearby; rentals leasing fast (median 2d on market — plan ~1-2 weeks tenant-placement turnaround); solid renter incomes; 2,996 units permitted in Allegheny County in 2024 (1,588 in 5+ unit buildings).
- This rent is only 14% of the median local income ($101k/yr) — well below the 30% rent-burden line; pricing power to push rent on renewal without tenant pushback.
Forward outlook
- Local home prices are declining (-3.0%/yr); year-one equity from $643 of loan paydown is wiped out by about $3k of value loss. Plan a longer hold.
Negotiation context
- It's been on market 58 days — a 3% lower offer ($90k) is reasonable based on typical stale-listing flexibility.
- 3 sale attempts since 22y ago with the ask held roughly flat each time — persistent listings suggest the price (not the market) is what's stuck; bring a comps-based counter.
- Current owner paid $42k; list at $93k implies a 121% gain — meaningful room to come down on a strong offer.
Risks & watch-outs
- Watch-outs: HOA is 21% of rent.
Questions for the listing agent
- It's been on market 58 days. Have you received any prior offers? Is the seller open to a 3% concession, seller financing, or rate buy-down credit?
- Built in 1967 — when were the roof, HVAC, electrical panel, plumbing, and water heater last replaced?
- What does the HOA fee cover, when was the last increase, and are there any pending special assessments or reserve-fund shortfalls?
- Any open or pending special assessments — roof, HVAC, plumbing, elevator, façade? What's the per-unit balance and payoff schedule, and is the seller paying it off at close or rolling it to the buyer?
- Is there a deadline driving the sale (1031 exchange, divorce, estate, relocation)? That informs how much negotiation room exists.
- What's the average days-on-market for RENTAL listings here right now (not sales)? A rising rental-DOM trend means longer vacancies and softer asking-rent achievability than the comps imply.
- What's the recent tenant-quality profile in this submarket — average credit score on applications, eviction rate, late-payment / NSF rate, and stable-employment percentage? A property-management company in the area should have these aggregated.
- How much new apartment / multifamily construction is in the pipeline within 1–3 miles? Heavy new supply (>2% of stock underway) typically softens rents 12–24 months out; light construction supports rent growth.
Investment metrics
- 1% rule
- 1.30% ✓
- Cap rate
- 7.07%
- Cash-on-cash
- 2.77%
- DSCR
- 1.12
- GRM
- 6.4
CMA / ARV
- ARV (median comp)
- $98,532
- List price
- $93,000
- Delta
- -5.61%
- Verdict
- FAIR
- Comps
- 11 within 1.0 mi
Projected returns pro-forma
-3.0% appreciation · 4.13% rent growth · sell at horizon
- IRR
- -10.0%
- Equity multiple
- 0.63×
- Total profit
- $-9,680
- Equity at exit
- $13,867
- IRR
- 1.5%
- Equity multiple
- 1.12×
- Total profit
- $3,040
- Equity at exit
- $8,041
Cash invested: $26,040 (down + closing). Projections, not guarantees.
Landlord ↔ Tenant lean methodology
- Overall (STATE)
- 62 Landlord-Friendly
- State Pennsylvania
- 62 Landlord-Friendly · EVEN
- County
- — inherits STATE
- City
- — inherits STATE
ZIP-level market 15108
- Rents YoY
- 4.1%
- Active inventory
- 177
- Price-to-rent
- 6.4×
Monthly cashflow live
- Estimated rent
- $1,209 high interval (Pro) →
- Mortgage (P&I)
- −$488
- Tax from tax record
- −$120 /mo · $1,436/yr
- Insurance
- −$39
- HOA
- −$249
- Vacancy / Maint / Mgmt
- −$254
- Net cashflow
- $60
Break-even live
Sensitivity live
| Price | -10% $113 | -5% $86 | +0% $60 | +5% $34 | +10% $7 |
|---|---|---|---|---|---|
| Rent | -10% $-35 | -5% $12 | +0% $60 | +5% $108 | +10% $156 |
| Rate | -1.0pp $107 | -0.5pp $84 | base $60 | +0.5pp $36 | +1.0pp $11 |
UW: 25.0% down · 7.5% · 30yr · 1.5% tax · 5.0% vac · 8.0% maint · 8.0% mgmt
Financing live
Cash to close
- Down payment
- $23,250
- Closing costs
- $2,790
- Reserves months
- —
- Total cash needed
- —
Loan-product check · same deal, 3 products live
Conventional
25% down · 7.5% · 30yr
- Down + closing
- —
- Monthly P&I
- —
- Monthly cashflow
- —
- DSCR
- —
- Eligible?
- —
Personal DTI + credit; lowest rate.
DSCR
20% down · 8.5% · 30yr
- Down + closing
- —
- Monthly P&I
- —
- Monthly cashflow
- —
- DSCR
- —
- Eligible?
- —
No personal income docs; deal must DSCR.
Hard money
10% down · 12.0% · 12mo
- Down + closing
- —
- Monthly P&I
- —
- Monthly cashflow
- —
- DSCR
- —
- Eligible?
- —
Short-term bridge; refi at stabilization.
Rent comps 8 comps
| Address | Beds | Baths | Sqft | Rent | $/sqft | DOM | Units | Dist |
|---|---|---|---|---|---|---|---|---|
| 701 College Park Dr #2 Coraopolis, PA | 1.0 | 1.0 | 594 | $1,150 | $1.94 | 13d | 1 | 0.05mi |
| 200 Grant Dr Coraopolis, PA | 1.0 | 1.0 | 666 | $1,325 | $1.99 | 2d | 3 | 0.08mi |
| 1000 College Park Dr #9 Coraopolis, PA | 2.0 | 1.0 | 741 | $1,200 | $1.62 | 15d | 1 | 0.09mi |
| 1200 Landing Ln Moon Twp, PA | 1.0–3.0 | 1.0–2.0 | 1013 | $1,488 | $1.47 | 2d | 9 | 0.38mi |
| 408 Sharon Rd Coraopolis, PA | 1.0 | 1.0 | 400 | $1,030 | $2.58 | 2d | 1 | 0.53mi |
| 243 Moon Clinton Rd Unit 4 Moon Twp, PA | 1.0 | 1.0 | 450 | $835 | $1.86 | 44d | 1 | 0.57mi |
| 916 Beaver Grade Rd Coraopolis, PA | 1.0–2.0 | 1.0–2.0 | 845 | $1,356 | $1.60 | 2d | 39 | 0.70mi |
| 318 Moon Clinton Rd Coraopolis, PA | 1.0 | 1.0 | 412 | $895 | $2.17 | 2d | 3 | 0.83mi |
HOA detail condo
- Monthly dues
- $249 · $2,988/yr
- Likely covers
- pool
- Assessments
- None detected in remarks — confirm with the listing agent.
Listing history 18 events
-
2026-06-18days on market $93,000 Active 58 DOM
-
2026-06-17days on market $93,000 Active 57 DOM
-
2026-06-16days on market $93,000 Active 56 DOM
-
2026-06-15days on market $93,000 Active 55 DOM
-
2026-06-13days on market $93,000 Active 53 DOM
-
2026-06-09days on market $93,000 Active 49 DOM
-
2026-06-08days on market $93,000 Active 48 DOM
-
2026-06-07days on market $93,000 Active 47 DOM
-
2026-06-05days on market $93,000 Active 44 DOM
-
2026-06-03days on market $93,000 Active 43 DOM
-
2026-06-02days on market $93,000 Active 42 DOM
-
2026-06-01days on market $93,000 Active 41 DOM
-
2026-05-31days on market $93,000 Active 40 DOM
-
2026-04-18$93,000 Active 220-char remark
Show marketing remark (220 chars)
Ideal purchase for an investor, young family. Centrally located, Walking distance for shopping, dining and University. Pool is available for a fee, Club house is also available for rental. Pool and Club house are nearby.
-
2025-03-25$97,500 Active 187-char remark
Show marketing remark (187 chars)
Pool is available for a fee. Clubhouse is also available for rent. Great location of Garden Apartments. Main floor unit. Pool and Club house are nearby. Close to restaurants and shopping.
-
2004-09-14soldstatus $42,000
-
2004-09-07soldstatus $42,000
-
2004-04-22$44,000
ⓘ Source: listings_history table (triggers on properties + properties_extension) + one-shot
backfill from property_details.listing_events for pre-trigger history.
Tax reassessment forecast PA · Partial reset (capped growth)
- Current annual tax
- $1,436 · $120/mo
- Projected year-2 tax
- $1,453 · $121/mo
- Expected delta
- +$17/yr (+$1/mo · 1.2%)
ⓘ Screening estimate from a state-policy table — verify with the county assessor before closing.
Climate risk First Street
- Flood 1/10 Low FEMA zone X (unshaded) · 0% chance over 30 yrs
- Wildfire 1/10 Low
- Heat 3/10 Moderate 7 d/yr ≥96°F today · 17 d/yr by 30 yrs out
- Wind 2/10 Low
- Air quality 3/10 Moderate 2 unhealthy d/yr today · 3 by 30 yrs out
Nearby sold comps map
Loading sold comps map…
Walkable amenities ~0.75 mi
Loading nearby amenities…
Taxation est. · year 1
- Rental income
- $14,510
- − Mortgage interest
- −$5,209
- − Property taxes
- −$1,436
- − Insurance
- −$465
- − Repairs & maintenance
- −$1,161
- − Management
- −$1,161
- − HOA
- −$2,988
- − Depreciation
- −$2,705
- Taxable loss
- −$616
- Est. tax savings @ 24.0%
- +$148
- After-tax cash flow
- $869/yr
For passive investors: Depreciation is non-cash, so a rental often shows a tax loss while cash-flowing — sheltering income. Rental losses are passive: they offset passive income freely, and up to $25,000/yr can offset ordinary (W-2) income if you actively participate and your MAGI is under $100k (phasing out to $0 by $150k); unused losses carry forward. On sale, claimed depreciation is recaptured at up to 25%, and gains may owe capital-gains tax (a 1031 exchange can defer both). Figures are a year-1 estimate at your 24.0% rate — not tax advice; consult a CPA.
Schools (NCES district)
- District
- Moon Area SD
- NCES district ID
- 4215830
- Math proficiency
- 50% ▼ -15.00%
- Reading proficiency
- 70% ▼ -10.00%
- Median HH income
- $70,464
- Composite
- 52.95/100
- National rank
- #1528
- State rank
- #62 of 539 in PA
Livability — Moon
No livability data for this city. (Only ~50 U.S. cities are tracked.)
Census & demographics
- Census place
- Carnot-Moon, PA
- County
- Allegheny County · 1,022,028 people
- Metro
- Pittsburgh, PA
- Population (ZIP)
- 42,799
- Household income
- $100,859
- Rent vs Own
- Severe rent burden
- 890.0
Population outlook (Allegheny County) Hauer SSP2
- Today (2025)
- 1,250,282 people
- By 2030
- 1,256,482 · +0.5%
- By 2040
- 1,256,318 · +0.5%
- By 2050
- 1,244,169 · -0.5%
- By 2075
- 1,197,693 · -4.2%
- By 2100
- 1,093,187 · -12.6%
Race, ethnicity, and origin ACS 2023
- Neighborhood character
- Predominantly White (85%)
- Race & ethnicity
- White 85% Black 5% Two or more races 5% Asian 4% Hispanic / Latino 2%
- Common ancestry
- Romanian 7% Subsaharan African 4% Slovak 2%
- Foreign-born
- 6% · Canada, Vietnam
- Languages at home
- 93% English-only · Spanish 2% Other Indo-European 1% Other Asian/Pacific 1%
Political lean MEDSL · Allegheny
- 2024 margin
- Strong D (+20.3) · D 59.7% · R 39.4%
- 2008→2024 swing
- +4.8pp toward D · 2008: 15.5pp · 2024: 20.3pp
- All cycles
- 2024: D+20.3 2020: D+20.4 2016: D+16.4 2012: D+14.4 2008: D+15.5
Not yet ingested
- Civics
- —
Market trends
- HPI YoY
- ▼ -220.09%
- Current HPI
- 250.7623
- Rent YoY
- ▲ 4.13%
- Metro
- Pittsburgh, PA
- State GDP YoY
- ▲ 1.68%
- F500 in state
- 34
Industry mix (Fortune 500 HQ in PA)
| Industry | F500 HQs | Revenue |
|---|---|---|
| Healthcare | 2 | $309B |
|
||
| Insurance | 2 | $27B |
|
||
| Telecommunications / Media | 1 | $124B |
|
||
| Industrial Distribution | 1 | $22B |
|
||
| Financial Services | 1 | $20B |
|
||
| Chemicals / Materials | 1 | $18B |
|
||
Price history
+111.4% since first listed5 events — show timeline
- 2026-04-18 Listed $93,000 West Penn MLS
- 2025-03-25 Listed $97,500 West Penn MLS
- 2004-09-14 Sold (Public Records) $42,000 Public Records
- 2004-09-07 Sold (MLS) $42,000 West Penn MLS
- 2004-04-22 Listed $44,000 West Penn MLS
Property tax history
+2.9%/yrLatest (2026): $1,436 · +6.8% YoY. Source: county tax records.
Cash-flow waterfall
monthlySold comps — $/sqft
last 12 mo · ≤1 miLoading sold comps…