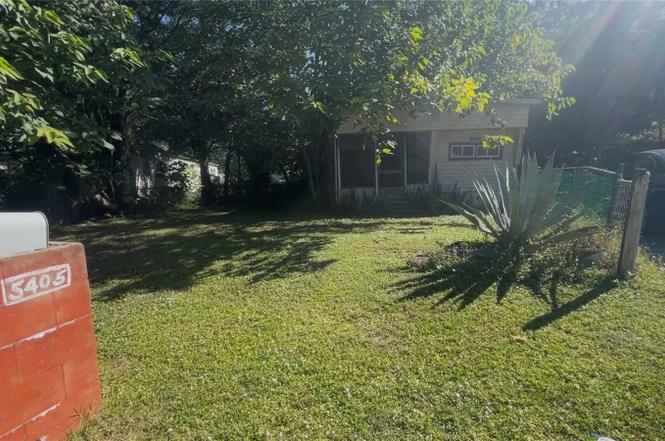
5405 Mobile Dr · Mango, FL
Flood risk 1/10 · Minimal
- FEMA flood zone
- X (unshaded)
- Chance of flooding over 30 yrs
- 0.0%
- Est. flood insurance / yr
- $507 – $1,088
Fire risk 2/10 · Minimal
- Est. fire insurance / yr
- $947 – $1,759
Heat risk 10/10 · Severe
- Hot days now (above 110°F)
- 6 days/yr
- Hot days in 30 yrs
- 22 days/yr
Wind risk 9/10 · Severe
- Chance of severe wind over 30 yrs
- 99.0%
Air-quality risk 4/10 · Minor
- Unhealthy air days now
- 4 days/yr
- Unhealthy air days in 30 yrs
- 4 days/yr
Risk factors via First Street. Map © Google.
Why this score? — see what drove the B grade
The composite is a weighted blend of 9 inputs, each scored 0–100. Each bar is that input's sub-score; the figure is the points it added to the 100-point composite (weight × sub-score).
- Cash flow +30.0/30.0
- 1% rule +10.0/10.0
- DSCR +10.0/10.0
- ARV discount +7.5/15.0
- Schools +4.2/10.0
- Livability +3.8/5.0
- Rent growth +3.0/5.0
- Condition / age +2.5/5.0
- Appreciation +0.0/10.0
$89,900
🖨 Deal sheet 📄 Offer letter ✓ Due diligence
Listing remarks MLS
Price to sell needs TLC, centrally located less then 1 mile from I-4, owner will consider financing please call for terms.
Key facts
- Spacious yard
- Easy access
- Manufactured home
Tags
Property features AI
Exterior
- Utilities: Public water; Public sewer; Electricity connected
- Home design: Residential mobile home (double wide); One story; North-facing
- Construction: Vinyl siding and frame construction; Metal roof; Slab foundation; Built as a double wide
- Exterior features: Private mailbox; Road surfaces include asphalt, concrete, and dirt
Interior
- Kitchen: Built-in oven; Cooktop; Microwave; Refrigerator
- Bedrooms: 3 bedrooms
- Flooring: Other flooring
- Bathrooms: 2 full bathrooms
- Heating & cooling: Other heating; Wall/window air conditioning units
- Interior features: Ceiling fans; Other interior features
- Laundry & utility: Dedicated laundry room
Neighborhood map
What this means for you Summary
Snapshot
- This is a 3-bed/2.0-bath manufactured listed at $90k.
Deal economics
- At list price, monthly cash flow is $892 ($11k/yr) — positive.
- The deal already cash-flows at list — no discount required.
- Meets the 1% rule at list price ($2k rent vs $90k).
- Recommended offer: $85k (6.0% below list) — sets the bar for market timing.
Location & tenants
- Location reads 75/100 on livability (#265 in FL, #4,263 nationally) — a middle-class / working-renter tenant base. Strengths: cost of living A+, housing A+, commute A; Watch: schools F, amenities F, employment F.
- Hillsborough (suburban): math 47% / reading 50% proficiency, ranked #41 of 73 in FL (top 56%) — families likely to look elsewhere, expect single-tenant / working-renter base with shorter leases.
- Market conditions: Rents rising (+2.1%/yr); 194 active listings in the ZIP; 19 comparable units currently listed for rent nearby; rentals leasing fast (median 12d on market — plan ~1-2 weeks tenant-placement turnaround); 9,053 units permitted in Hillsborough County in 2024 (4,555 in 5+ unit buildings).
- This rent runs 31% of the median local income ($72k/yr) — at the standard rent-burdened threshold; future hikes will face affordability resistance.
Forward outlook
- Local home prices are declining (-3.0%/yr); year-one equity from $622 of loan paydown is wiped out by about $3k of value loss. Plan a longer hold.
- Hillsborough County population projected at +37% by 2050 — long-run rental-demand tailwind backs the buy-and-hold thesis.
- At projected returns (-3.0% appreciation + 2.1% rent growth), your $25k cash investment doubles in ~3 years — after that, you're playing with house money.
Negotiation context
- It's been on market 81 days — a 6% lower offer ($85k) is reasonable based on typical stale-listing flexibility.
- 5 sale attempts since 12y ago; this cycle's ask has dropped $35k (28%) from the opening price — seller is motivated, your offer sets the floor, not the list.
- Current owner paid $47k; list at $90k implies a 91% gain — meaningful room to come down on a strong offer.
Risks & watch-outs
- Climate carrying-cost: severe wind risk, 99% chance of damaging wind over 30y; extreme-heat days projected 6→22/yr by 2055 (HVAC capex compounding) — expect insurance premiums to compound above CPI over the hold.
Questions for the listing agent
- It's been on market 81 days. Have you received any prior offers? Is the seller open to a 6% concession, seller financing, or rate buy-down credit?
- Built in 1964 — when were the roof, HVAC, electrical panel, plumbing, and water heater last replaced?
- Why hasn't it sold? Are there any deal-killer items the seller is aware of (foundation, flood, title, zoning, code violations)?
- Is there a deadline driving the sale (1031 exchange, divorce, estate, relocation)? That informs how much negotiation room exists.
- Schools are F-rated, which usually means shorter tenancies and higher turnover. Who's the typical renter profile here, and what's been the actual vacancy rate?
- What's the average days-on-market for RENTAL listings here right now (not sales)? A rising rental-DOM trend means longer vacancies and softer asking-rent achievability than the comps imply.
- What's the recent tenant-quality profile in this submarket — average credit score on applications, eviction rate, late-payment / NSF rate, and stable-employment percentage? A property-management company in the area should have these aggregated.
- How much new for-sale + rental construction is in the pipeline within 1–3 miles? Heavy new supply typically softens prices + rents 12–24 months out; constrained supply supports both.
Investment metrics
- 1% rule
- 2.09% ✓
- Cap rate
- 18.20%
- Cash-on-cash
- 42.53%
- DSCR
- 2.89
- GRM
- 4.0
CMA / ARV
No comps found within radius.
Projected returns pro-forma
-3.0% appreciation · 2.08% rent growth · sell at horizon
- IRR
- 38.2%
- Equity multiple
- 2.61×
- Total profit
- $40,545
- Equity at exit
- $13,404
- IRR
- 44.3%
- Equity multiple
- 5.04×
- Total profit
- $101,572
- Equity at exit
- $7,773
Cash invested: $25,172 (down + closing). Projections, not guarantees.
Landlord ↔ Tenant lean methodology
- Overall (STATE)
- 87 Strongly Landlord-Friendly
- State Florida
- 87 Strongly Landlord-Friendly · R+3
- County
- — inherits STATE
- City
- — inherits STATE
ZIP-level market 33584
- Rents YoY
- 2.1%
- Active inventory
- 194
- Price-to-rent
- 4.0×
Monthly cashflow live
- Estimated rent
- $1,883 high interval (Pro) →
- Mortgage (P&I)
- −$471
- Tax from tax record
- −$87 /mo · $1,041/yr
- Insurance
- −$37
- HOA
- −$0
- Vacancy / Maint / Mgmt
- −$396
- Net cashflow
- $892
Break-even live
UW: 25.0% down · 7.5% · 30yr · 1.5% tax · 5.0% vac · 8.0% maint · 8.0% mgmt
Financing live
Cash to close
- Down payment
- $22,475
- Closing costs
- $2,697
- Reserves months
- —
- Total cash needed
- —
Loan-product check · same deal, 3 products live
Conventional
25% down · 7.5% · 30yr
- Down + closing
- —
- Monthly P&I
- —
- Monthly cashflow
- —
- DSCR
- —
- Eligible?
- —
Personal DTI + credit; lowest rate.
DSCR
20% down · 8.5% · 30yr
- Down + closing
- —
- Monthly P&I
- —
- Monthly cashflow
- —
- DSCR
- —
- Eligible?
- —
No personal income docs; deal must DSCR.
Hard money
10% down · 12.0% · 12mo
- Down + closing
- —
- Monthly P&I
- —
- Monthly cashflow
- —
- DSCR
- —
- Eligible?
- —
Short-term bridge; refi at stabilization.
Rent comps 19 comps
| Address | Beds | Baths | Sqft | Rent | $/sqft | DOM | Units | Dist |
|---|---|---|---|---|---|---|---|---|
| 11614 Valencia Dr Unit A Seffner, FL | 2.0 | 1.0 | 928 | $1,645 | $1.77 | 12d | 1 | 0.47mi |
| 5328 Orange Ave Unit A Seffner, FL | 2.0 | 1.0 | 850 | $1,850 | $2.18 | 17d | 1 | 0.56mi |
| 5502 Peach Ave Seffner, FL | 2.0 | 1.0 | 840 | $1,700 | $2.02 | 19d | 1 | 0.60mi |
| 5351 Peach Ave Unit B Seffner, FL | 3.0 | 1.0 | 850 | $1,299 | $1.53 | 4d | 1 | 0.64mi |
| 5228 Orange Ave Apt A Seffner, FL | 2.0 | 2.0 | 875 | $1,850 | $2.11 | 24d | 1 | 0.66mi |
| 5226 Orange Ave Unit A Seffner, FL | 2.0 | 2.0 | 845 | $1,850 | $2.19 | 17d | 1 | 0.67mi |
| 12002 Embarcadero Dr Seffner, FL | 2.0 | 1.0 | 870 | $1,695 | $1.95 | 4d | 2 | 0.83mi |
| 12002 Embarcadero Dr Unit 12018 Seffner, FL | 2.0 | 1.0 | 870 | $1,695 | $1.95 | 21d | 1 | 0.83mi |
| 5228 Cherry Ave Seffner, FL | 2.0 | 1.0 | 650 | $1,425 | $2.19 | 20d | 1 | 0.85mi |
| 5228 Cherry Ave Unit B Seffner, FL | 2.0 | 1.0 | 650 | $1,425 | $2.19 | 24d | 1 | 0.85mi |
| 5228 Cherry Ave Unit B Seffner, FL | 2.0 | 1.0 | 650 | $1,425 | $2.19 | 11d | 1 | 0.85mi |
| 5409 McLeod Dr Tampa, FL | 2.0 | 1.0 | 600 | $1,525 | $2.54 | 3d | 1 | 0.86mi |
| 5409 McLeod Dr Unit B Tampa, FL | 2.0 | 1.0 | 800 | $1,495 | $1.87 | 2d | 1 | 0.86mi |
| 4610 Claymore Dr Tampa, FL | 2.0–4.0 | 2.0 | 1136 | $1,669 | $1.47 | 2d | 11 | 0.95mi |
| 10881 Caladesi Ave Tampa, FL | 1.0–2.0 | 1.0–2.0 | 935 | $2,476 | $2.65 | 2d | 20 | 1.14mi |
| 901 S Taylor Rd Seffner, FL | 2.0 | 1.0 | 725 | $1,500 | $2.07 | 3d | 1 | 1.17mi |
| 6228 Timmons Rd Unit 6226 Seffner, FL | 2.0 | 2.0 | 950 | $1,800 | $1.89 | 24d | 1 | 1.17mi |
| 1004 Melrose St Unit B Seffner, FL | 2.0 | 1.0 | 867 | $1,450 | $1.67 | 2d | 1 | 1.28mi |
| 1336 Valley Groves Dr Seffner, FL | 2.0–3.0 | 1.0–2.0 | 1150 | $1,830 | $1.59 | 13d | 5 | 1.47mi |
Listing history 20 events
-
2026-05-04status Pending
-
2026-04-09price $89,900
-
2026-03-30price $94,900
-
2026-03-30price $97,400
-
2026-03-12price $99,900
-
2026-03-12status Active
-
2026-03-12historical
-
2026-02-12$124,900 Active
-
2025-06-30historical
-
2025-03-14$84,000 Active
-
2015-02-25soldstatus $47,000 Sold 122-char remark
Show marketing remark (122 chars)
Price to sell needs TLC, centrally located less then 1 mile from I-4, owner will consider financing please call for terms.
-
2014-11-12price $34,100 122-char remark
Show marketing remark (122 chars)
Price to sell needs TLC, centrally located less then 1 mile from I-4, owner will consider financing please call for terms.
-
2014-11-04price $34,200 122-char remark
Show marketing remark (122 chars)
Price to sell needs TLC, centrally located less then 1 mile from I-4, owner will consider financing please call for terms.
-
2014-09-25$34,500 Active 122-char remark
Show marketing remark (122 chars)
Price to sell needs TLC, centrally located less then 1 mile from I-4, owner will consider financing please call for terms.
-
2014-09-17soldstatus $22,000 Sold
-
2014-08-21historical Active with Contract
-
2014-06-14$35,000 Active
-
2000-05-25soldstatus $29,500
-
1981-11-01soldstatus $15,500
-
1980-09-01soldstatus $9,250
ⓘ Source: listings_history table (triggers on properties + properties_extension) + one-shot
backfill from property_details.listing_events for pre-trigger history.
Tax reassessment forecast FL · Resets to sale price
- Current annual tax
- $1,041 · $87/mo
- Projected year-2 tax
- $1,041 · $87/mo
- Expected delta
- $0/yr ($0/mo · 0.0%)
ⓘ Screening estimate from a state-policy table — verify with the county assessor before closing.
Climate risk First Street
- Flood 1/10 Low FEMA zone X (unshaded) · 0% chance over 30 yrs
- Wildfire 2/10 Low
- Heat 10/10 Extreme 6 d/yr ≥110°F today · 22 d/yr by 30 yrs out
- Wind 9/10 Extreme 99% chance of damaging wind over 30 yrs
- Air quality 4/10 Moderate 4 unhealthy d/yr today · 4 by 30 yrs out
Nearby sold comps map
Loading sold comps map…
Walkable amenities ~0.75 mi
Loading nearby amenities…
Taxation est. · year 1
- Rental income
- $22,600
- − Mortgage interest
- −$5,036
- − Property taxes
- −$1,041
- − Insurance
- −$450
- − Repairs & maintenance
- −$1,808
- − Management
- −$1,808
- − Depreciation
- −$2,615
- Taxable income
- $9,843
- Est. tax owed @ 24.0%
- −$2,362
- After-tax cash flow
- $8,345/yr
For passive investors: Depreciation is non-cash, so a rental often shows a tax loss while cash-flowing — sheltering income. Rental losses are passive: they offset passive income freely, and up to $25,000/yr can offset ordinary (W-2) income if you actively participate and your MAGI is under $100k (phasing out to $0 by $150k); unused losses carry forward. On sale, claimed depreciation is recaptured at up to 25%, and gains may owe capital-gains tax (a 1031 exchange can defer both). Figures are a year-1 estimate at your 24.0% rate — not tax advice; consult a CPA.
Schools (NCES district)
- District
- Hillsborough
- NCES district ID
- 1200870
- Math proficiency
- 47% ▼ -8.00%
- Reading proficiency
- 50% ▼ -4.00%
- Median HH income
- $50,622
- Composite
- 41.6/100
- National rank
- #3435
- State rank
- #41 of 73 in FL
Livability — Mango
- Score
- 75/100
- State rank
- #265
- US rank
- #4263
Category grades
Schools grade is shown separately in the Schools card above.
Census & demographics
- Census place
- Mango, FL
- County
- Hillsborough County · 1,540,968 people
- City population
- 27,172
- Metro
- Tampa-St. Petersburg-Clearwater, FL
- Population (ZIP)
- 28,579
- Household income
- $72,267
- Rent vs Own
- Severe rent burden
- 378.0
Population outlook (Hillsborough County) Hauer SSP2
- Today (2025)
- 1,607,022 people
- By 2030
- 1,733,968 · +7.9%
- By 2040
- 1,979,565 · +23.2%
- By 2050
- 2,203,427 · +37.1%
- By 2075
- 2,667,893 · +66.0%
- By 2100
- 2,891,558 · +79.9%
Race, ethnicity, and origin ACS 2023
- Neighborhood character
- Diverse neighborhood (Simpson 0.67)
- Race & ethnicity
- White 50% Hispanic / Latino 24% Black 16% Two or more races 14% Asian 6%
- Hispanic origin (detail)
- Mexican 2% Puerto Rican 10% Cuban 4% Dominican 2%
- Common ancestry
- Romanian 2% Lithuanian 1% Italian 1%
- Foreign-born
- 13% · Canada, China, Jamaica
- Languages at home
- 74% English-only · Spanish 17% Russian/Polish/Slavic 2% Other Indo-European 2%
Political lean MEDSL · Hillsborough
- 2024 margin
- Toss-up / Even · D 47.8% · R 50.9% · Other 1.3%
- 2008→2024 swing
- -10.2pp toward R · 2008: 7.1pp · 2024: -3.1pp
- All cycles
- 2024: R+3.1 2020: D+6.9 2016: D+6.8 2012: D+6.7 2008: D+7.1
Not yet ingested
- Civics
- —
Market trends
- HPI YoY
- ▼ -286.15%
- Current HPI
- 312.894
- Rent YoY
- ▲ 2.08%
- Metro
- Tampa-St. Petersburg-Clearwater, FL
- State GDP YoY
- ▲ 3.28%
- F500 in state
- 36
Industry mix (Fortune 500 HQ in FL)
| Industry | F500 HQs | Revenue |
|---|---|---|
| Industrial Technology | 2 | $29B |
|
||
| Insurance | 2 | $17B |
|
||
| Retail | 1 | $60B |
|
||
| Technology Distribution | 1 | $58B |
|
||
| Homebuilding | 1 | $35B |
|
||
| Technology Manufacturing | 1 | $35B |
|
||
Price history
+871.9% since first listed20 events — show timeline
- 2026-05-04 Pending — Stellar MLS as Distributed by MLS Grid
- 2026-04-09 Price Changed $89,900 Stellar MLS as Distributed by MLS Grid
- 2026-03-30 Price Changed $94,900 Stellar MLS as Distributed by MLS Grid
- 2026-03-30 Price Changed $97,400 Stellar MLS as Distributed by MLS Grid
- 2026-03-12 Price Changed $99,900 Stellar MLS as Distributed by MLS Grid
- 2026-03-12 Relisted — Stellar MLS as Distributed by MLS Grid
- 2026-03-12 Listing Removed — Stellar MLS as Distributed by MLS Grid
- 2026-02-12 Listed $124,900 Stellar MLS as Distributed by MLS Grid
- 2025-06-30 Listing Removed — Stellar MLS as Distributed by MLS Grid
- 2025-03-14 Listed $84,000 Stellar MLS as Distributed by MLS Grid
- 2015-02-25 Sold (MLS) $47,000 Stellar MLS as Distributed by MLS Grid
- 2014-11-12 Price Changed $34,100 Stellar MLS as Distributed by MLS Grid
- 2014-11-04 Price Changed $34,200 Stellar MLS as Distributed by MLS Grid
- 2014-09-25 Listed $34,500 Stellar MLS as Distributed by MLS Grid
- 2014-09-17 Sold (MLS) $22,000 Stellar MLS as Distributed by MLS Grid
- 2014-08-21 Contingent — Stellar MLS as Distributed by MLS Grid
- 2014-06-14 Listed $35,000 Stellar MLS as Distributed by MLS Grid
- 2000-05-25 Sold (Public Records) $29,500 Public Records
- 1981-11-01 Sold (Public Records) $15,500 Public Records
- 1980-09-01 Sold (Public Records) $9,250 Public Records
Property tax history
+7.0%/yrLatest (2025): $1,041 · +9.8% YoY. Source: county tax records.
Cash-flow waterfall
monthlySold comps — $/sqft
last 12 mo · ≤1 miLoading sold comps…