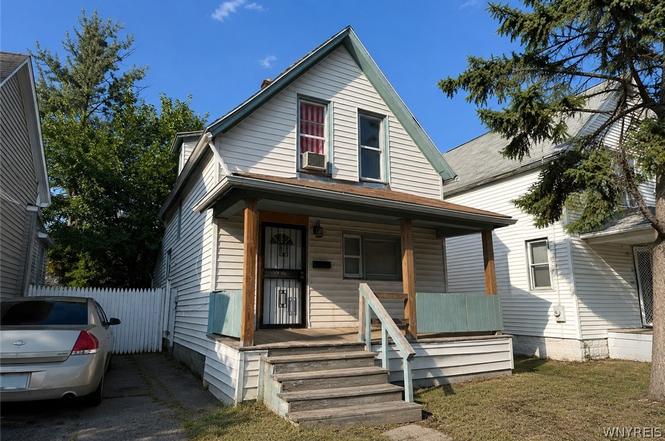
38 Inter Park Ave · Buffalo, NY
Flood risk 6/10 · Moderate
- FEMA flood zone
- X (unshaded)
- Chance of flooding over 30 yrs
- 0.69%
- Est. flood insurance / yr
- $473 – $860
Fire risk 1/10 · Minimal
- Est. fire insurance / yr
- $691 – $1,283
Heat risk 3/10 · Minor
- Hot days now (above 93°F)
- 7 days/yr
- Hot days in 30 yrs
- 15 days/yr
Wind risk 1/10 · Minimal
- Chance of severe wind over 30 yrs
- —
Air-quality risk 3/10 · Minor
- Unhealthy air days now
- 2 days/yr
- Unhealthy air days in 30 yrs
- 3 days/yr
Risk factors via First Street. Map © Google.
Why this score? — see what drove the A- grade
The composite is a weighted blend of 9 inputs, each scored 0–100. Each bar is that input's sub-score; the figure is the points it added to the 100-point composite (weight × sub-score).
- Cash flow +30.0/30.0
- ARV discount +15.0/15.0
- 1% rule +10.0/10.0
- DSCR +10.0/10.0
- Appreciation +6.0/10.0
- Livability +3.9/5.0
- Schools +3.3/10.0
- Rent growth +2.5/5.0
- Condition / age +2.5/5.0
$85,000
🖨 Deal sheet (PDF) 📄 Offer letter ✓ Due diligence
Listing remarks
Welcome to 38 Inter Park Ave, a charming 3-bedroom single-family home located on Buffalo’s East Side, just minutes from the expressway for easy commuting. This home features an inviting open layout that creates a spacious flow throughout the living areas, perfect for both relaxing and entertaining. Enjoy mornings or evenings on the cozy front porch, adding extra curb appeal and outdoor living space. Inside, you’ll find newer flooring that complements the home’s design, along with recent updates including a brand new roof and hot water tank, giving you peace of mind for years to come.
Key facts
- Hot water tank
- Newer flooring
- Front porch
Tags
Property features AI
Exterior
- Parking: No garage
- Utilities: Public water available (not connected); Sewer available
- Home design: Single-story building (listed as 1 story); Resale property; Vinyl siding
- Construction: Vinyl siding construction; Pillar/post/pier foundation; Existing (previously built)
- Exterior features: Concrete driveway; Open porch
Interior
- Bedrooms: Bedroom 1 on second level; Bedroom 2 on second level; Bedroom 3 on second level
- Flooring: Hardwood; Vinyl; Varies
- Bathrooms: 1 full bathroom (main level)
- Heating & cooling: Gas forced air heating; Wall cooling unit(s)
- Interior features: Separate/formal living room; Other interior features (see remarks)
- Laundry & utility: Laundry on main level; Gas water heater
Neighborhood map
What this means for you Summary
Snapshot
- This is a 3-bed/1.0-bath single-family listed at $85k.
Deal economics
- At list price, monthly cash flow is $709 ($9k/yr) — positive.
- The deal already cash-flows at list — no discount required.
- Meets the 1% rule at list price ($2k rent vs $85k).
- Cap rate 16.3% vs local median 8.0% in Buffalo — top-decile yield for the area; either an underpriced asset or a hidden risk that comps aren't pricing in. Stress-test before assuming the spread holds.
Location & tenants
- Location reads 77/100 on livability (#195 in NY, #3,011 nationally) — a middle-class / working-renter tenant base. Strengths: commute A+, housing A+, health & safety A+; Watch: crime F, employment D-.
- Buffalo City School District (urban): math 41% / reading 40% proficiency, ranked #535 of 590 in NY (top 91%) — families likely to look elsewhere, expect single-tenant / working-renter base with shorter leases; 75% free/reduced lunch — lower-income household profile, screen leases tightly.
- Zoned schools: International School (math 8% / reading 17%, grade F, #2,048 of 2,108 statewide, top 97%, 981 students, 92% FRL); Hutchinson Central Technical High School (math 96% / reading 32%, grade B-, #807 of 1,100 statewide, top 73%, 1,175 students, 78% FRL).
- Market conditions: 173 active listings in the ZIP; 22 comparable units currently listed for rent nearby; rentals lingering (median 46d on market — plan ~5-8 weeks vacancy on turnover, expect pricing pressure); 59% of comp listings sitting > 30 days — soft ceiling on asking rent; lower-income renter base — watch delinquency; 1,244 units permitted in Erie County in 2024 (563 in 5+ unit buildings).
- At $1,528/mo this rent would consume 51% of the median local household income ($36k/yr) (locally 1804% of renters already pay >50% of income on rent) — very limited rent-growth headroom before tenants either downsize or default.
Forward outlook
- In year one you build about $2k of equity ($588 loan paydown + $2k appreciation (2.0% local appreciation)).
- At projected returns (2.0% appreciation + 3.0% rent growth), your $24k cash investment doubles in ~3 years — after that, you're playing with house money.
Negotiation context
- Only 7 days on market — expect competitive offers; lowballing is unlikely to land.
- 4 sale attempts since 6y ago with the ask held roughly flat each time — persistent listings suggest the price (not the market) is what's stuck; bring a comps-based counter.
- Current owner paid $69k; 23% above their basis — modest negotiation headroom, anchor on the comps not their cost.
Risks & watch-outs
- Watch-outs: built in 1920 — expect roof / HVAC / electrical / plumbing capex.
- Climate carrying-cost: major flood risk — expect insurance premiums to compound above CPI over the hold.
Questions for the listing agent
- Built in 1920 — when were the roof, HVAC, electrical panel, plumbing, and water heater last replaced?
- Is there a deadline driving the sale (1031 exchange, divorce, estate, relocation)? That informs how much negotiation room exists.
- Crime grade is F in this area — have there been break-ins, vandalism, or insurance claims at this property in the last 3 years? What carrier currently insures it and at what premium?
- What's the average days-on-market for RENTAL listings here right now (not sales)? A rising rental-DOM trend means longer vacancies and softer asking-rent achievability than the comps imply.
- What's the recent tenant-quality profile in this submarket — average credit score on applications, eviction rate, late-payment / NSF rate, and stable-employment percentage? A property-management company in the area should have these aggregated.
- How much new for-sale + rental construction is in the pipeline within 1–3 miles? Heavy new supply typically softens prices + rents 12–24 months out; constrained supply supports both.
Investment metrics
- 1% rule
- 1.80% ✓
- Cap rate
- 16.30%
- Cash-on-cash
- 35.74%
- DSCR
- 2.59
- GRM
- 4.6
CMA / ARV
- ARV (on-the-fly)
- $124,200
- Comps found
- 3
Show comp detail 3 sales within ~0.75 mi
| Address | Dist | Beds/Ba | Sqft | Sold | Price | $/sf | Match |
|---|---|---|---|---|---|---|---|
| 341 Florida St | 0.39mi | 3/1.5 | 916 (+11%) | 12mo | $137,000 | $150 | 52 |
| 4 Pleasant Pl | 0.53mi | 3/1.0 | 737 (-11%) | 24mo | $79,900 | $108 | 37 |
| 90 Alexander Pl | 0.71mi | 2/1.0 (-1) | 942 (+14%) | 7mo | $150,000 | $159 | 33 |
Match score weights: distance 35% · size 25% · config 20% · recency 20%. Top-matched comps best support the ARV.
Projected returns pro-forma
2.05% appreciation · 3.0% rent growth · sell at horizon
- IRR
- 39.9%
- Equity multiple
- 3.15×
- Total profit
- $51,154
- Equity at exit
- $33,753
- IRR
- 40.8%
- Equity multiple
- 6.22×
- Total profit
- $124,237
- Equity at exit
- $48,778
Cash invested: $23,800 (down + closing). Projections, not guarantees.
Landlord ↔ Tenant lean methodology
- Overall (STATE)
- 15 Strongly Tenant-Friendly
- State New York
- 15 Strongly Tenant-Friendly · D+10
- County
- — inherits STATE
- City
- — inherits STATE
ZIP-level market 14211
- Home prices YoY
- 0.6%
- Active inventory
- 173
- Price-to-rent
- 4.6×
Monthly cashflow live
- Estimated rent
- $1,528 high interval (Pro) →
- Mortgage (P&I)
- −$446
- Tax from tax record
- −$17 /mo · $208/yr
- Insurance
- −$35
- HOA
- −$0
- Vacancy / Maint / Mgmt
- −$321
- Net cashflow
- $709
Break-even live
Sensitivity live
| Price | -10% $757 | -5% $733 | +0% $709 | +5% $685 | +10% $661 |
|---|---|---|---|---|---|
| Rent | -10% $588 | -5% $648 | +0% $709 | +5% $769 | +10% $830 |
| Rate | -1.0pp $752 | -0.5pp $730 | base $709 | +0.5pp $687 | +1.0pp $664 |
UW: 25.0% down · 7.5% · 30yr · 1.5% tax · 5.0% vac · 8.0% maint · 8.0% mgmt
Financing live
Cash to close
- Down payment
- $21,250
- Closing costs
- $2,550
- Reserves months
- —
- Total cash needed
- —
Loan-product check · same deal, 3 products live
Conventional
25% down · 7.5% · 30yr
- Down + closing
- —
- Monthly P&I
- —
- Monthly cashflow
- —
- DSCR
- —
- Eligible?
- —
Personal DTI + credit; lowest rate.
DSCR
20% down · 8.5% · 30yr
- Down + closing
- —
- Monthly P&I
- —
- Monthly cashflow
- —
- DSCR
- —
- Eligible?
- —
No personal income docs; deal must DSCR.
Hard money
10% down · 12.0% · 12mo
- Down + closing
- —
- Monthly P&I
- —
- Monthly cashflow
- —
- DSCR
- —
- Eligible?
- —
Short-term bridge; refi at stabilization.
Rent comps 22 comps
| Address | Beds | Baths | Sqft | Rent | $/sqft | DOM | Units | Dist |
|---|---|---|---|---|---|---|---|---|
| 408 Winslow Ave Unit 2 Buffalo, NY | 3.0 | 1.0 | 1000 | $1,050 | $1.05 | 16d | 1 | 0.29mi |
| 104 Butler Ave Buffalo, NY | 3.0 | 1.0 | 1000 | $1,400 | $1.40 | 45d | 1 | 0.32mi |
| 76 Chester St Unit 1 Buffalo, NY | 3.0 | 1.0 | 1100 | $1,000 | $0.91 | 16d | 1 | 0.86mi |
| 2075 Main St Buffalo, NY | 1.0–2.0 | 1.0 | 594 | $1,400 | $2.36 | 45d | 2 | 0.91mi |
| 52 Walden Ave Buffalo, NY | 2.0 | 1.0 | 600 | $1,100 | $1.83 | 45d | 1 | 0.93mi |
| 1786 Main St Unit 103 Buffalo, NY | 2.0 | 1.5 | 1110 | $1,677 | $1.51 | 45d | 1 | 0.94mi |
| 117 Humboldt Pkwy Unit B Buffalo, NY | 2.0 | 1.0 | 840 | $1,850 | $2.20 | 45d | 1 | 1.04mi |
| 117 Humboldt Pkwy Unit A Buffalo, NY | 3.0 | 1.0 | 1105 | $2,300 | $2.08 | 45d | 1 | 1.04mi |
| 2 Agassiz Cir Unit B Buffalo, NY | 2.0 | 1.0 | 983 | $2,050 | $2.09 | 25d | 1 | 1.13mi |
| 2 Agassiz Cir Unit A Buffalo, NY | 2.0 | 1.0 | 1076 | $2,150 | $2.00 | 25d | 1 | 1.13mi |
| 90 Sussex St Unit 2 Buffalo, NY | 2.0 | 1.0 | 1000 | $1,000 | $1.00 | 45d | 1 | 1.14mi |
| 238 Oxford Ave Unit Upper Buffalo, NY | 3.0 | 1.0 | 1100 | $1,600 | $1.45 | 25d | 1 | 1.19mi |
| 19 E Utica St Unit 203 Buffalo, NY | 2.0 | 1.0 | 850 | $1,300 | $1.53 | 16d | 1 | 1.22mi |
| 10 Jewett Pkwy Buffalo, NY | 2.0 | 1.0 | 525 | $1,210 | $2.30 | 45d | 1 | 1.31mi |
| 1145 Michigan Ave Buffalo, NY | 2.0 | 1.0–2.0 | 655 | $2,049 | $3.13 | 45d | 1 | 1.31mi |
| 1165 Delaware Ave Buffalo, NY | 1.0–2.0 | 1.0 | 658 | $1,250 | $1.90 | 45d | 1 | 1.35mi |
| 1310 Delaware Ave Buffalo, NY | 2.0 | 1.0 | 684 | $1,275 | $1.86 | 45d | 1 | 1.38mi |
| 88 W Utica St Unit 1 Buffalo, NY | 3.0 | 2.0 | 990 | $2,150 | $2.17 | 4d | 1 | 1.43mi |
| 88 W Utica St Unit 1 Buffalo, NY | 3.0 | 2.0 | 990 | $2,150 | $2.17 | 16d | 1 | 1.43mi |
| 1155 Main St Buffalo, NY | 2.0 | 1.0–2.0 | 592 | $2,300 | $3.88 | 45d | 1 | 1.48mi |
| 1040 Delaware Ave Buffalo, NY | 1.0–2.0 | 1.0 | 687 | $1,500 | $2.18 | 5d | 4 | 1.49mi |
| 2532 Main St Apt 7 Buffalo, NY | 2.0 | 1.0 | 850 | $1,300 | $1.53 | 45d | 1 | 1.49mi |
Listing history 6 events
-
2026-06-21days on market $85,000 Active 7 DOM
-
2026-06-18days on market $85,000 Active 4 DOM
-
2026-06-17days on market $85,000 Active 3 DOM
-
2026-06-16days on market $85,000 Active 2 DOM
-
2026-06-15remarks 590-char remark
-
2026-06-15$85,000 Active 1 DOM
ⓘ Source: listings_history table (triggers on properties + properties_extension) + one-shot
backfill from property_details.listing_events for pre-trigger history.
Tax reassessment forecast NY · Partial reset (capped growth)
- Current annual tax
- $208 · $17/mo
- Projected year-2 tax
- $822 · $69/mo
- Expected delta
- +$614/yr (+$51/mo · 295.2%)
ⓘ Screening estimate from a state-policy table — verify with the county assessor before closing.
Climate risk First Street
- Flood 6/10 Major FEMA zone X (unshaded) · 69% chance over 30 yrs
- Wildfire 1/10 Low
- Heat 3/10 Moderate 7 d/yr ≥93°F today · 15 d/yr by 30 yrs out
- Wind 1/10 Low
- Air quality 3/10 Moderate 2 unhealthy d/yr today · 3 by 30 yrs out
Nearby sold comps map
Loading sold comps map…
Walkable amenities ~0.75 mi
Loading nearby amenities…
Taxation est. · year 1
- Rental income
- $18,339
- − Mortgage interest
- −$4,761
- − Property taxes
- −$208
- − Insurance
- −$425
- − Repairs & maintenance
- −$1,467
- − Management
- −$1,467
- − Depreciation
- −$2,473
- Taxable income
- $7,538
- Est. tax owed @ 24.0%
- −$1,809
- After-tax cash flow
- $6,697/yr
For passive investors: Depreciation is non-cash, so a rental often shows a tax loss while cash-flowing — sheltering income. Rental losses are passive: they offset passive income freely, and up to $25,000/yr can offset ordinary (W-2) income if you actively participate and your MAGI is under $100k (phasing out to $0 by $150k); unused losses carry forward. On sale, claimed depreciation is recaptured at up to 25%, and gains may owe capital-gains tax (a 1031 exchange can defer both). Figures are a year-1 estimate at your 24.0% rate — not tax advice; consult a CPA.
Schools (NCES district)
- District
- Buffalo City School District
- NCES district ID
- 3605850
- Math proficiency
- 41% ▲ 11.00%
- Reading proficiency
- 40% ▲ 7.00%
- Median HH income
- $31,665
- Composite
- 33.17/100
- National rank
- #5544
- State rank
- #535 of 590 in NY
Livability — Buffalo
- Score
- 77/100
- State rank
- #195
- US rank
- #3011
Category grades
Schools grade is shown separately in the Schools card above.
Census & demographics
- Census place
- Buffalo, NY
- County
- Erie County · 714,559 people
- City population
- 440,021
- Metro
- Buffalo-Cheektowaga, NY
- Population (ZIP)
- 24,663
- Household income
- $36,300
- Rent vs Own
- Severe rent burden
- 1804.0
Population outlook (Erie County) Hauer SSP2
- Today (2025)
- 933,037 people
- By 2030
- 935,181 · +0.2%
- By 2040
- 928,531 · -0.5%
- By 2050
- 905,725 · -2.9%
- By 2075
- 834,037 · -10.6%
- By 2100
- 708,033 · -24.1%
Race, ethnicity, and origin ACS 2023
- Neighborhood character
- Diverse neighborhood (Simpson 0.60)
- Race & ethnicity
- Black 59% Asian 20% Hispanic / Latino 9% White 9% Two or more races 5%
- Hispanic origin (detail)
- Puerto Rican 6%
- Common ancestry
- Romanian 4%
- Foreign-born
- 17% · Canada, Philippines, Vietnam
- Languages at home
- 74% English-only · Other Indo-European 14% Spanish 6% Other Asian/Pacific 1%
Political lean MEDSL · Erie
- 2024 margin
- Lean D (+9.7) · D 54.8% · R 45.2%
- 2008→2024 swing
- -7.9pp toward R · 2008: 17.5pp · 2024: 9.7pp
- All cycles
- 2024: D+9.7 2020: D+14.7 2016: D+4.8 2012: D+15.6 2008: D+17.5
Not yet ingested
- Civics
- —
Market trends
- HPI YoY
- ▲ 2.05%
- Current HPI
- 357.6438
- Rent YoY
- —
- Metro
- Buffalo-Cheektowaga, NY
- State GDP YoY
- ▲ 2.60%
- F500 in state
- 92
Industry mix (Fortune 500 HQ in NY)
| Industry | F500 HQs | Revenue |
|---|---|---|
| Financial Services | 10 | $950B |
|
||
| Consumer Goods | 9 | $162B |
|
||
| Insurance | 4 | $225B |
|
||
| Telecommunications | 2 | $144B |
|
||
| Pharmaceuticals | 2 | $112B |
|
||
| Media / Entertainment | 2 | $69B |
|
||
Price history
+21.6% since first listed10 events — show timeline
- 2026-06-13 Listed $85,000 WNYREIS
- 2025-11-04 Listed $85,000 WNYREIS
- 2025-11-03 Listing Removed — WNYREIS
- 2025-09-15 Listed $85,000 WNYREIS
- 2021-05-03 Sold (Public Records) $69,000 Public Records
- 2021-04-30 Sold (MLS) $69,000 WNYREIS
- 2021-02-12 Pending — WNYREIS
- 2021-01-24 Pending — WNYREIS
- 2021-01-05 Price Changed $69,800 WNYREIS
- 2020-10-15 Listed $69,900 WNYREIS
Property tax history
+5.8%/yrLatest (2025): $208 · +68.7% YoY. Source: county tax records.
Cash-flow waterfall
monthlySold comps — $/sqft
last 12 mo · ≤1 miLoading sold comps…