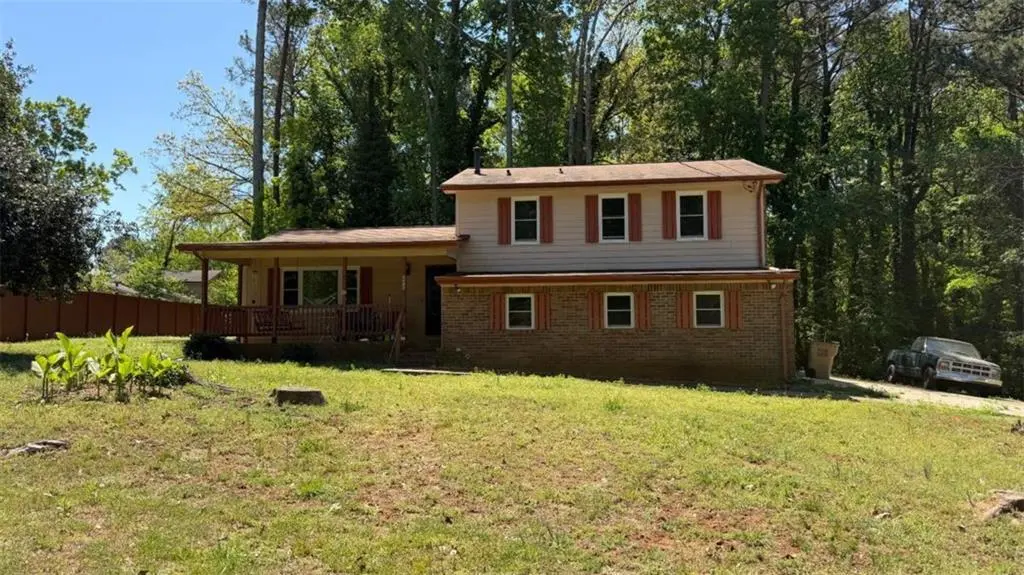
2235 Bristol Ct · Morrow, GA
Flood risk 1/10 · Minimal
- FEMA flood zone
- X (unshaded)
- Chance of flooding over 30 yrs
- 0.0%
- Est. flood insurance / yr
- $507 – $1,088
Fire risk 1/10 · Minimal
- Est. fire insurance / yr
- $963 – $1,789
Heat risk 6/10 · Moderate
- Hot days now (above 105°F)
- 7 days/yr
- Hot days in 30 yrs
- 18 days/yr
Wind risk 6/10 · Moderate
- Chance of severe wind over 30 yrs
- 27.0%
Air-quality risk 4/10 · Minor
- Unhealthy air days now
- 5 days/yr
- Unhealthy air days in 30 yrs
- 6 days/yr
Risk factors via First Street. Map © Google.
Why this score? — see what drove the C grade
The composite is a weighted blend of 9 inputs, each scored 0–100. Each bar is that input's sub-score; the figure is the points it added to the 100-point composite (weight × sub-score).
- Cash flow +20.2/30.0
- ARV discount +15.0/15.0
- DSCR +6.4/10.0
- 1% rule +5.8/10.0
- Livability +3.2/5.0
- Rent growth +3.0/5.0
- Condition / age +2.5/5.0
- Schools +1.3/10.0
- Appreciation +0.0/10.0
$175,000
🖨 Deal sheet (PDF) 📄 Offer letter ✓ Due diligence
Listing remarks MLS
Home is now cleaned out. Investor special in pre-foreclosure. This 3-bedroom, 2-bath split-level home offers approximately 1,658 square feet with a half basement and sits in an established neighborhood. Property needs renovation and is being sold as-is, making it a great opportunity for investors or cash buyers. The roof was fairly new when the current seller purchased, and the HVAC system is only 2 years old. Features include a brick and frame exterior, deck, patio, and fireplace. Strong value-add potential with solid fundamentals already in place. CASH OR CONVENTIONAL ONLY - PRICE IS FIRM TO COVER BALANCE. No Disclosures.
Key facts
- Built 1978
- Listed 46 days
Property features AI
Exterior
- Parking: Attached parking; Parking pad
- Utilities: Public water; Septic tank sewer; 110 volt electric service; Natural gas available
- Home design: One and one half levels; Fee simple ownership
- Construction: Brick, cement siding, and concrete construction; Composition roof; Block foundation; Built with materials indicating older construction (property condition: fixer)
- Exterior features: Deck; Other unspecified exterior features
Interior
- Kitchen: Kitchen features not specified
- Bedrooms: Three bedrooms on the upper level
- Flooring: Flooring details not specified
- Bathrooms: Two full bathrooms (both on the upper level); Master bath has other/unspecified features
- Heating & cooling: Central heating; Central air conditioning
- Interior features: Brick fireplace; Finished daylight basement with exterior entry; No shared/common walls; Property listed in fixer condition
- Laundry & utility: Laundry located in the basement; 220 volts available in laundry area
Neighborhood map
What this means for you Summary
Snapshot
- This is a 3-bed/2.0-bath single-family listed at $175k.
Deal economics
- At list price, monthly cash flow is $219 ($3k/yr) — positive.
- The deal already cash-flows at list — no discount required.
- Meets the 1% rule at list price ($2k rent vs $175k).
- Recommended offer: $170k (3.0% below list) — sets the bar for market timing.
- Cap rate 7.8% vs local median 4.9% in Morrow — top-decile yield for the area; either an underpriced asset or a hidden risk that comps aren't pricing in. Stress-test before assuming the spread holds.
Location & tenants
- Location reads 65/100 on livability (#229 in GA) — a middle-class / working-renter tenant base. Strengths: cost of living A+, housing A+; Watch: amenities D, employment D, crime F.
- Clayton County (suburban): math 11% / reading 20% proficiency, ranked #155 of 174 in GA (top 89%) — low school quality limits family demand, transient renter base, plan for 1-2y turnover; 78% free/reduced lunch — lower-income household profile, screen leases tightly.
- Zoned schools: Mount Zion Primary (589 students, 90% FRL); M. D. Roberts Middle School (math 22% / reading 37%, grade F, #249 of 470 statewide, top 55%, 852 students, 90% FRL).
- Zoned-school proficiency averages 30% at this address vs 16% district-wide (+14 pts) — the actual schools serving this property are materially stronger than the Clayton County average implies; a family-tenant draw the district grade alone would hide.
- Market conditions: Rents rising (+2.1%/yr); 275 active listings in the ZIP; 35 comparable units currently listed for rent nearby; rentals at typical pace (median 14d on market — plan ~3-4 weeks tenant-placement turnaround); 865 units permitted in Clayton County in 2024 (448 in 5+ unit buildings).
- This rent runs 34% of the median local income ($67k/yr) — at the standard rent-burdened threshold; future hikes will face affordability resistance.
Forward outlook
- Local home prices are declining (-3.0%/yr); year-one equity from $1k of loan paydown is wiped out by about $5k of value loss. Plan a longer hold.
- Clayton County population projected at +29% by 2050 — long-run rental-demand tailwind backs the buy-and-hold thesis.
Negotiation context
- It's been on market 47 days — a 3% lower offer ($170k) is reasonable based on typical stale-listing flexibility.
- 2 sale attempts with the ask held roughly flat each time — persistent listings suggest the price (not the market) is what's stuck; bring a comps-based counter.
Risks & watch-outs
- Climate carrying-cost: major wind risk, 27% chance of damaging wind over 30y; extreme-heat days projected 7→18/yr by 2055 (HVAC capex compounding) — expect insurance premiums to compound above CPI over the hold.
Questions for the listing agent
- It's been on market 47 days. Have you received any prior offers? Is the seller open to a 3% concession, seller financing, or rate buy-down credit?
- Built in 1978 — when were the roof, HVAC, electrical panel, plumbing, and water heater last replaced?
- Is there a deadline driving the sale (1031 exchange, divorce, estate, relocation)? That informs how much negotiation room exists.
- Schools are F-rated, which usually means shorter tenancies and higher turnover. Who's the typical renter profile here, and what's been the actual vacancy rate?
- Crime grade is F in this area — have there been break-ins, vandalism, or insurance claims at this property in the last 3 years? What carrier currently insures it and at what premium?
- What's the average days-on-market for RENTAL listings here right now (not sales)? A rising rental-DOM trend means longer vacancies and softer asking-rent achievability than the comps imply.
- What's the recent tenant-quality profile in this submarket — average credit score on applications, eviction rate, late-payment / NSF rate, and stable-employment percentage? A property-management company in the area should have these aggregated.
- How much new for-sale + rental construction is in the pipeline within 1–3 miles? Heavy new supply typically softens prices + rents 12–24 months out; constrained supply supports both.
Investment metrics
- 1% rule
- 1.08% ✓
- Cap rate
- 7.80%
- Cash-on-cash
- 5.37%
- DSCR
- 1.24
- GRM
- 7.7
CMA / ARV
- ARV (median comp)
- $280,578
- List price
- $175,000
- Delta
- -37.63%
- Verdict
- UNDERPRICED
- Comps
- 20 within 1.0 mi
Show comp detail 12 sales within ~0.75 mi
| Address | Dist | Beds/Ba | Sqft | Sold | Price | $/sf | Match |
|---|---|---|---|---|---|---|---|
| 7583 Sunstone Dr | 0.38mi | 3/2.0 | 1,621 (-2%) | 4mo | $249,500 | $154 | 75 |
| 7582 Carlisle Dr | 0.15mi | 3/2.0 | 1,797 (+8%) | 12mo | $308,000 | $171 | 68 |
| 7619 Sunstone Dr | 0.40mi | 3/2.0 | 1,700 (+2%) | 17mo | $233,000 | $137 | 63 |
| 7492 Aspen Ct | 0.12mi | 3/2.0 | 1,462 (-12%) | 16mo | $250,000 | $171 | 62 |
| 2331 Fireside Ct | 0.26mi | 4/3.0 (+1) | 1,618 (-2%) | 22mo | $278,500 | $172 | 57 |
| 2148 Castleway Ct | 0.60mi | 3/2.5 | 1,791 (+8%) | 0mo | $250,000 | $140 | 56 |
| 2238 Danver Ct | 0.46mi | 3/2.0 | 1,834 (+11%) | 7mo | $275,000 | $150 | 55 |
| 2381 Reeves Creek Rd | 0.36mi | 3/2.5 | 1,860 (+12%) | 8mo | $288,000 | $155 | 54 |
| 7550 Fielder Rd | 0.65mi | 3/2.0 | 1,732 (+4%) | 12mo | $365,000 | $211 | 52 |
| 2046 Logan Dr | 0.43mi | 3/3.0 | 1,850 (+12%) | 14mo | $247,000 | $134 | 45 |
| 7782 Wethersfield Dr | 0.66mi | 4/2.5 (+1) | 1,792 (+8%) | 13mo | $295,000 | $165 | 38 |
| 2323 Runnymede Ct | 0.71mi | 3/2.0 | 1,898 (+14%) | 18mo | $283,400 | $149 | 28 |
Match score weights: distance 35% · size 25% · config 20% · recency 20%. Top-matched comps best support the ARV.
Projected returns pro-forma
-3.0% appreciation · 2.15% rent growth · sell at horizon
- IRR
- -8.9%
- Equity multiple
- 0.68×
- Total profit
- $-15,920
- Equity at exit
- $26,093
- IRR
- -0.6%
- Equity multiple
- 0.96×
- Total profit
- $-2,066
- Equity at exit
- $15,131
Cash invested: $49,000 (down + closing). Projections, not guarantees.
Landlord ↔ Tenant lean methodology
- Overall (STATE)
- 90 Strongly Landlord-Friendly
- State Georgia
- 90 Strongly Landlord-Friendly · R+3
- County
- — inherits STATE
- City
- — inherits STATE
ZIP-level market 30236
- Rents YoY
- 2.1%
- Active inventory
- 275
- Price-to-rent
- 7.7×
Monthly cashflow live
- Estimated rent
- $1,897 high interval (Pro) →
- Mortgage (P&I)
- −$918
- Tax from tax record
- −$289 /mo · $3,466/yr
- Insurance
- −$73
- HOA
- −$0
- Vacancy / Maint / Mgmt
- −$398
- Net cashflow
- $219
Break-even live
Sensitivity live
| Price | -10% $318 | -5% $269 | +0% $219 | +5% $170 | +10% $120 |
|---|---|---|---|---|---|
| Rent | -10% $70 | -5% $144 | +0% $219 | +5% $294 | +10% $369 |
| Rate | -1.0pp $308 | -0.5pp $264 | base $219 | +0.5pp $174 | +1.0pp $128 |
UW: 25.0% down · 7.5% · 30yr · 1.5% tax · 5.0% vac · 8.0% maint · 8.0% mgmt
Financing live
Cash to close
- Down payment
- $43,750
- Closing costs
- $5,250
- Reserves months
- —
- Total cash needed
- —
Loan-product check · same deal, 3 products live
Conventional
25% down · 7.5% · 30yr
- Down + closing
- —
- Monthly P&I
- —
- Monthly cashflow
- —
- DSCR
- —
- Eligible?
- —
Personal DTI + credit; lowest rate.
DSCR
20% down · 8.5% · 30yr
- Down + closing
- —
- Monthly P&I
- —
- Monthly cashflow
- —
- DSCR
- —
- Eligible?
- —
No personal income docs; deal must DSCR.
Hard money
10% down · 12.0% · 12mo
- Down + closing
- —
- Monthly P&I
- —
- Monthly cashflow
- —
- DSCR
- —
- Eligible?
- —
Short-term bridge; refi at stabilization.
Rent comps 35 comps
| Address | Beds | Baths | Sqft | Rent | $/sqft | DOM | Units | Dist |
|---|---|---|---|---|---|---|---|---|
| 7503 Conkle Rd Jonesboro, GA | 4.0 | 3.5 | 2232 | $2,335 | $1.05 | 45d | 1 | 0.21mi |
| 7519 Conkle Rd Jonesboro, GA | 3.0 | 2.0 | 1934 | $2,100 | $1.09 | 45d | 1 | 0.27mi |
| 2447 Reeves Creek Rd Jonesboro, GA | 3.0 | 2.0 | 1458 | $1,725 | $1.18 | 45d | 1 | 0.35mi |
| 2324 Coach Way Jonesboro, GA | 4.0 | 2.5 | 1714 | $2,000 | $1.17 | 45d | 1 | 0.48mi |
| 7302 Wagon Wheel Ct Jonesboro, GA | 3.0 | 2.5 | 1790 | $1,600 | $0.89 | 4d | 1 | 0.49mi |
| 2310 Coach Way Jonesboro, GA | 3.0 | 2.5 | 1876 | $1,545 | $0.82 | 45d | 1 | 0.50mi |
| 7434 Chads Cir Jonesboro, GA | 3.0 | 2.0 | 2054 | $2,040 | $0.99 | 0d | 1 | 0.59mi |
| 7538 Fielder Rd Jonesboro, GA | 3.0 | 3.0 | 1456 | $1,779 | $1.22 | 4d | 1 | 0.78mi |
| 2615 Mount Zion Pkwy Jonesboro, GA | 1.0–3.0 | 1.0–2.0 | 1049 | $1,784 | $1.70 | 4d | 10 | 0.84mi |
| 2173 Martin Way Jonesboro, GA | 3.0 | 2.0 | 2146 | $2,025 | $0.94 | 0d | 1 | 0.87mi |
| 7472 Lerose Dr Jonesboro, GA | 3.0 | 2.0 | 1768 | $1,931 | $1.09 | 45d | 1 | 0.87mi |
| 2465 Richardson Pkwy Morrow, GA | 1.0–3.0 | 1.0–2.0 | 1002 | $2,209 | $2.20 | 0d | 21 | 0.88mi |
| 100 Carrington Park Jonesboro, GA | 1.0–3.0 | 1.0–2.0 | 1008 | $1,789 | $1.77 | 2d | 15 | 0.89mi |
| 7847 Sugarland Dr Jonesboro, GA | 3.0 | 2.0 | 1430 | $1,750 | $1.22 | 18d | 1 | 0.91mi |
| 7594 Casper Ct Jonesboro, GA | 4.0 | 2.0 | 2100 | $1,920 | $0.91 | 14d | 1 | 0.91mi |
| 260 Commons Dr Jonesboro, GA | 3.0 | 2.5 | 1410 | $1,750 | $1.24 | 4d | 1 | 1.12mi |
| 7147 Mount Zion Cir Morrow, GA | 2.0 | 2.0 | 1170 | $1,645 | $1.41 | 0d | 15 | 1.12mi |
| 7135 Mount Zion Cir Morrow, GA | 2.0 | 2.0 | 1080 | $1,893 | $1.75 | 6d | 25 | 1.18mi |
| 7582 Colonial Ct Jonesboro, GA | 4.0 | 2.0 | 1808 | $1,650 | $0.91 | 22d | 1 | 1.21mi |
| 1556 Arbor Place Dr Morrow, GA | 3.0 | 2.5 | 1720 | $1,895 | $1.10 | 25d | 1 | 1.32mi |
| 1542 Persimmon Trce Morrow, GA | 3.0 | 2.5 | 1811 | $2,393 | $1.32 | 0d | 1 | 1.35mi |
| 7000 Southlake Pkwy Morrow, GA | 1.0–2.0 | 1.0–2.0 | 927 | $1,393 | $1.50 | 0d | 9 | 1.37mi |
| 2887 Botany Dr Jonesboro, GA | 3.0 | 2.0 | 1372 | $1,627 | $1.19 | 0d | 1 | 1.37mi |
| 2822 Chelsey Trl Jonesboro, GA | 4.0 | 2.0 | 1225 | $1,725 | $1.41 | 0d | 1 | 1.38mi |
| 2822 Chelsey Trl Jonesboro, GA | 4.0 | 2.0 | 1225 | $1,725 | $1.41 | 45d | 1 | 1.38mi |
| 7232 April Ct Morrow, GA | 3.0 | 2.5 | 1402 | $1,700 | $1.21 | 5d | 1 | 1.38mi |
| 6917 Knollwood Dr Morrow, GA | 3.0 | 2.0 | 1604 | $1,671 | $1.04 | 45d | 1 | 1.38mi |
| 7202 Georges Way Morrow, GA | 3.0 | 2.5 | 1402 | $2,000 | $1.43 | 45d | 1 | 1.38mi |
| 1518 Persimmon Trce Morrow, GA | 4.0 | 2.5 | 1916 | $1,820 | $0.95 | 6d | 1 | 1.40mi |
| 8212 Lullwater Ct Jonesboro, GA | 4.0 | 2.5 | 1772 | $2,200 | $1.24 | 45d | 1 | 1.41mi |
| 8212 Lullwater Ct Jonesboro, GA | 3.0 | 2.5 | 1772 | $2,200 | $1.24 | 25d | 1 | 1.41mi |
| 1510 Persimmon Trce Morrow, GA | 4.0 | 2.5 | 1888 | $2,015 | $1.07 | 25d | 1 | 1.41mi |
| 7238 Alicias Way Morrow, GA | 3.0 | 2.5 | 1347 | $1,900 | $1.41 | 45d | 1 | 1.42mi |
| 8240 Blackfoot Trl Jonesboro, GA | 4.0 | 2.0 | 1764 | $1,956 | $1.11 | 5d | 1 | 1.43mi |
| 1488 Arbor Place Dr Morrow, GA | 3.0 | 2.5 | 1811 | $2,173 | $1.20 | 25d | 1 | 1.44mi |
Listing history 19 events
-
2026-06-21days on market $175,000 Active 47 DOM
-
2026-06-18days on market $175,000 Active 44 DOM
-
2026-06-17days on market $175,000 Active 43 DOM
-
2026-06-16days on market $175,000 Active 42 DOM
-
2026-06-15days on market $175,000 Active 41 DOM
-
2026-06-13days on market $175,000 Active 39 DOM
-
2026-06-09days on market $175,000 Active 35 DOM
-
2026-06-08days on market $175,000 Active 34 DOM
-
2026-06-07days on market $175,000 Active 33 DOM
-
2026-06-04days on market $175,000 Active 30 DOM
-
2026-06-03days on market $175,000 Active 29 DOM
-
2026-06-02days on market $175,000 Active 28 DOM
-
2026-06-01days on market $175,000 Active 27 DOM
-
2026-05-31days on market $175,000 Active 26 DOM
-
2026-05-05$175,000 Active 631-char remark
-
2026-04-11$175,000 New 631-char remark
Show marketing remark (631 chars)
Home is now cleaned out. Investor special in pre-foreclosure. This 3-bedroom, 2-bath split-level home offers approximately 1,658 square feet with a half basement and sits in an established neighborhood. Property needs renovation and is being sold as-is, making it a great opportunity for investors or cash buyers. The roof was fairly new when the current seller purchased, and the HVAC system is only 2 years old. Features include a brick and frame exterior, deck, patio, and fireplace. Strong value-add potential with solid fundamentals already in place. CASH OR CONVENTIONAL ONLY - PRICE IS FIRM TO COVER BALANCE. No Disclosures.
-
2021-06-02soldstatus $162,000
-
1997-07-08soldstatus $92,900
-
1978-11-13soldstatus $50,800
ⓘ Source: listings_history table (triggers on properties + properties_extension) + one-shot
backfill from property_details.listing_events for pre-trigger history.
Tax reassessment forecast GA · Resets to sale price
- Current annual tax
- $3,466 · $289/mo
- Projected year-2 tax
- $3,466 · $289/mo
- Expected delta
- $0/yr ($0/mo · 0.0%)
ⓘ Screening estimate from a state-policy table — verify with the county assessor before closing.
Climate risk First Street
- Flood 1/10 Low FEMA zone X (unshaded) · 0% chance over 30 yrs
- Wildfire 1/10 Low
- Heat 6/10 Major 7 d/yr ≥105°F today · 18 d/yr by 30 yrs out
- Wind 6/10 Major 27% chance of damaging wind over 30 yrs
- Air quality 4/10 Moderate 5 unhealthy d/yr today · 6 by 30 yrs out
Nearby sold comps map
Loading sold comps map…
Walkable amenities ~0.75 mi
Loading nearby amenities…
Taxation est. · year 1
- Rental income
- $22,769
- − Mortgage interest
- −$9,803
- − Property taxes
- −$3,466
- − Insurance
- −$875
- − Repairs & maintenance
- −$1,821
- − Management
- −$1,821
- − Depreciation
- −$5,091
- Taxable loss
- −$109
- Est. tax savings @ 24.0%
- +$26
- After-tax cash flow
- $2,659/yr
For passive investors: Depreciation is non-cash, so a rental often shows a tax loss while cash-flowing — sheltering income. Rental losses are passive: they offset passive income freely, and up to $25,000/yr can offset ordinary (W-2) income if you actively participate and your MAGI is under $100k (phasing out to $0 by $150k); unused losses carry forward. On sale, claimed depreciation is recaptured at up to 25%, and gains may owe capital-gains tax (a 1031 exchange can defer both). Figures are a year-1 estimate at your 24.0% rate — not tax advice; consult a CPA.
Schools (NCES district)
- District
- Clayton County
- NCES district ID
- 1301230
- Math proficiency
- 11% ▼ -13.00%
- Reading proficiency
- 20% ▼ -9.00%
- Median HH income
- $42,266
- Composite
- 13.41/100
- National rank
- #9527
- State rank
- #155 of 174 in GA
Livability — Morrow
- Score
- 65/100
- State rank
- #229
- US rank
- #13314
Category grades
Schools grade is shown separately in the Schools card above.
Census & demographics
- County
- Clayton County · 230,153 people
- City population
- 28,693
- Metro
- Atlanta-Sandy Springs-Alpharetta, GA
- Population (ZIP)
- 50,089
- Household income
- $66,973
- Rent vs Own
- Severe rent burden
- 2024.0
Population outlook (Clayton County) Hauer SSP2
- Today (2025)
- 310,777 people
- By 2030
- 329,762 · +6.1%
- By 2040
- 368,052 · +18.4%
- By 2050
- 401,196 · +29.1%
- By 2075
- 472,488 · +52.0%
- By 2100
- 500,446 · +61.0%
Race, ethnicity, and origin ACS 2023
- Neighborhood character
- Diverse neighborhood (Simpson 0.56)
- Race & ethnicity
- Black 64% White 14% Hispanic / Latino 11% Two or more races 8% Asian 5%
- Hispanic origin (detail)
- Mexican 6% Puerto Rican 1%
- Common ancestry
- Slovak 1% Italian 1% Hispanic 1%
- Foreign-born
- 13% · Canada, Vietnam, China
- Languages at home
- 81% English-only · Spanish 10% Vietnamese 3% French/Haitian/Cajun 2%
Political lean MEDSL · Clayton
- 2024 margin
- Solid D (+69.2) · D 84.3% · R 15.1%
- 2008→2024 swing
- +2.8pp toward D · 2008: 66.4pp · 2024: 69.2pp
- All cycles
- 2024: D+69.2 2020: D+70.9 2016: D+71.9 2012: D+70.1 2008: D+66.4
Not yet ingested
- Civics
- —
Market trends
- HPI YoY
- ▼ -137.02%
- Current HPI
- 204.1778
- Rent YoY
- ▲ 2.15%
- Metro
- Atlanta-Sandy Springs-Alpharetta, GA
- State GDP YoY
- ▲ 2.66%
- F500 in state
- 28
Industry mix (Fortune 500 HQ in GA)
| Industry | F500 HQs | Revenue |
|---|---|---|
| Paper / Packaging | 2 | $29B |
|
||
| Retail | 1 | $160B |
|
||
| Transportation / Logistics | 1 | $91B |
|
||
| Airlines | 1 | $62B |
|
||
| Consumer Goods | 1 | $47B |
|
||
| Utilities | 1 | $25B |
|
||
Price history
+244.5% since first listed5 events — show timeline
- 2026-05-05 Listed $175,000 FMLS
- 2026-04-11 Listed $175,000 GAMLS
- 2021-06-02 Sold (Public Records) $162,000 Public Records
- 1997-07-08 Sold (Public Records) $92,900 Public Records
- 1978-11-13 Sold (Public Records) $50,800 Public Records
Property tax history
+6.9%/yrLatest (2025): $3,466 · -3.1% YoY. Source: county tax records.
Cash-flow waterfall
monthlySold comps — $/sqft
last 12 mo · ≤1 miLoading sold comps…