127 Havenwood Dr · Pompano Beach, FL
Flood risk 1/10 · Minimal
- FEMA flood zone
- X (unshaded)
- Chance of flooding over 30 yrs
- 0.0%
- Est. flood insurance / yr
- $507 – $1,088
Fire risk 1/10 · Minimal
- Est. fire insurance / yr
- $947 – $1,759
Heat risk 9/10 · Severe
- Hot days now (above 106°F)
- 7 days/yr
- Hot days in 30 yrs
- 26 days/yr
Wind risk 10/10 · Severe
- Chance of severe wind over 30 yrs
- 99.0%
Air-quality risk 2/10 · Minimal
- Unhealthy air days now
- 1 days/yr
- Unhealthy air days in 30 yrs
- 3 days/yr
Risk factors via First Street. Map © Google.
Why this score? — see what drove the B grade
The composite is a weighted blend of 9 inputs, each scored 0–100. Each bar is that input's sub-score; the figure is the points it added to the 100-point composite (weight × sub-score).
- Cash flow +30.0/30.0
- 1% rule +10.0/10.0
- DSCR +10.0/10.0
- ARV discount +7.5/15.0
- Schools +4.1/10.0
- Condition / age +4.0/5.0
- Livability +3.7/5.0
- Rent growth +2.9/5.0
- Appreciation +0.0/10.0
$65,000
🖨 Deal sheet 📄 Offer letter ✓ Due diligence
Listing remarks
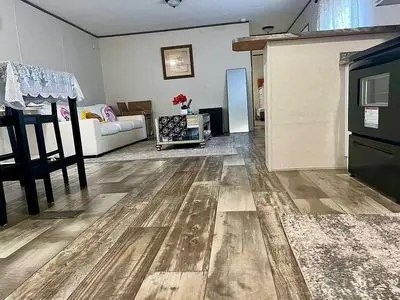
Havenwood is an active and exciting 55+ Senior Community. Enjoy relaxing in your quiet brand new 2 bedroom and 2 bathroom home inside of Havenwood. This perfectly designed kitchen with a walk-in master closet and wood style floors as well as a spa bathroom will have you loving your home in no time. With easy accessibility and a variety of community amenities, you can engage with fellow residents at our clubhouse, swimming pool, and billiards room. This home won& apos; t be on the market long, so call us today for more information or to schedule a tour. Deposits & amp; Fees are subject to change. Dogs allowed subject to certain breed/weight restrictions.
Key facts
- Clubhouse
- Community amenities
- Swimming pool
Tags
Neighborhood map
What this means for you Summary
Snapshot
- This is a 2-bed/2.0-bath other listed at $65k. Condition is rated good.
Deal economics
- At list price, monthly cash flow is $1k ($17k/yr) — positive.
- The deal already cash-flows at list — no discount required.
- Meets the 1% rule at list price ($2k rent vs $65k).
- Recommended offer: $64k (1.5% below list) — sets the bar for market timing.
- Cap rate 31.8% vs local median 3.1% in Pompano Beach — top-decile yield for the area; either an underpriced asset or a hidden risk that comps aren't pricing in. Stress-test before assuming the spread holds.
Location & tenants
- Location reads 74/100 on livability (#284 in FL, #4,541 nationally) — a middle-class / working-renter tenant base. Strengths: commute A+, housing A+, cost of living B+; Watch: schools D+, employment D+, amenities F.
- Broward (suburban): math 42% / reading 53% proficiency, ranked #46 of 73 in FL (top 63%) — families likely to look elsewhere, expect single-tenant / working-renter base with shorter leases.
- Market conditions: Rents rising (+1.8%/yr); 591 active listings in the ZIP; 40 comparable units currently listed for rent nearby; rentals at typical pace (median 25d on market — plan ~3-4 weeks tenant-placement turnaround); 2,111 units permitted in Broward County in 2024 (1,265 in 5+ unit buildings).
- This rent runs 39% of the median local income ($71k/yr) — at the standard rent-burdened threshold; future hikes will face affordability resistance.
Forward outlook
- Local home prices are declining (-3.0%/yr); year-one equity from $449 of loan paydown is wiped out by about $2k of value loss. Plan a longer hold.
- Broward County population projected at +34% by 2050 — long-run rental-demand tailwind backs the buy-and-hold thesis.
- At projected returns (-3.0% appreciation + 1.8% rent growth), your $18k cash investment doubles in ~2 years — after that, you're playing with house money.
Negotiation context
- It's been on market 23 days — a 2% lower offer ($64k) is reasonable based on typical stale-listing flexibility.
Risks & watch-outs
- Climate carrying-cost: severe wind risk, 99% chance of damaging wind over 30y; extreme-heat days projected 7→26/yr by 2055 (HVAC capex compounding) — expect insurance premiums to compound above CPI over the hold.
Questions for the listing agent
- Is there a deadline driving the sale (1031 exchange, divorce, estate, relocation)? That informs how much negotiation room exists.
- Schools are D-rated, which usually means shorter tenancies and higher turnover. Who's the typical renter profile here, and what's been the actual vacancy rate?
- What's the average days-on-market for RENTAL listings here right now (not sales)? A rising rental-DOM trend means longer vacancies and softer asking-rent achievability than the comps imply.
- What's the recent tenant-quality profile in this submarket — average credit score on applications, eviction rate, late-payment / NSF rate, and stable-employment percentage? A property-management company in the area should have these aggregated.
- How much new for-sale + rental construction is in the pipeline within 1–3 miles? Heavy new supply typically softens prices + rents 12–24 months out; constrained supply supports both.
Investment metrics
- 1% rule
- 3.56% ✓
- Cap rate
- 31.79%
- Cash-on-cash
- 91.07%
- DSCR
- 5.05
- GRM
- 2.3
CMA / ARV
No comps found within radius.
Projected returns pro-forma
-3.0% appreciation · 1.75% rent growth · sell at horizon
- IRR
- 90.4%
- Equity multiple
- 5.10×
- Total profit
- $74,591
- Equity at exit
- $9,692
- IRR
- 93.0%
- Equity multiple
- 10.17×
- Total profit
- $166,849
- Equity at exit
- $5,620
Cash invested: $18,200 (down + closing). Projections, not guarantees.
Landlord ↔ Tenant lean methodology
- Overall (STATE)
- 87 Strongly Landlord-Friendly
- State Florida
- 87 Strongly Landlord-Friendly · R+3
- County
- — inherits STATE
- City
- — inherits STATE
ZIP-level market 33064
- Home prices YoY
- -18.7%
- Rents YoY
- 1.8%
- Active inventory
- 591
- Price-to-rent
- 2.3×
Monthly cashflow live
- Estimated rent
- $2,317 high interval (Pro) →
- Mortgage (P&I)
- −$341
- Tax est. 1.5%
- −$81 /mo · $975/yr
- Insurance
- −$27
- HOA
- −$0
- Vacancy / Maint / Mgmt
- −$487
- Net cashflow
- $1,381
Break-even live
UW: 25.0% down · 7.5% · 30yr · 1.5% tax · 5.0% vac · 8.0% maint · 8.0% mgmt
Financing live
Cash to close
- Down payment
- $16,250
- Closing costs
- $1,950
- Reserves months
- —
- Total cash needed
- —
Loan-product check · same deal, 3 products live
Conventional
25% down · 7.5% · 30yr
- Down + closing
- —
- Monthly P&I
- —
- Monthly cashflow
- —
- DSCR
- —
- Eligible?
- —
Personal DTI + credit; lowest rate.
DSCR
20% down · 8.5% · 30yr
- Down + closing
- —
- Monthly P&I
- —
- Monthly cashflow
- —
- DSCR
- —
- Eligible?
- —
No personal income docs; deal must DSCR.
Hard money
10% down · 12.0% · 12mo
- Down + closing
- —
- Monthly P&I
- —
- Monthly cashflow
- —
- DSCR
- —
- Eligible?
- —
Short-term bridge; refi at stabilization.
Rent comps 40 comps
| Address | Beds | Baths | Sqft | Rent | $/sqft | DOM | Units | Dist |
|---|---|---|---|---|---|---|---|---|
| 3180 NE 10th Ter Pompano Beach, FL | 2.0 | 1.0 | 991 | $2,700 | $2.72 | 24d | 1 | 0.29mi |
| 3300 NE 10th Ter Pompano Beach, FL | 1.0 | 1.0 | 674 | $1,525 | $2.26 | 15d | 1 | 0.34mi |
| 3421 NE 5th Ave Unit A Pompano Beach, FL | 2.0 | 1.0 | 970 | $2,500 | $2.58 | 24d | 1 | 0.35mi |
| 2933 NE 12th Ter Pompano Beach, FL | 2.0 | 1.0 | 824 | $2,700 | $3.28 | 24d | 1 | 0.46mi |
| 2797 NE 12th Ave Pompano Beach, FL | 2.0 | 1.0 | 817 | $2,740 | $3.35 | 8d | 1 | 0.47mi |
| 1150 E Sample Rd #202 Pompano Beach, FL | 1.0 | 1.0 | 640 | $1,650 | $2.58 | 24d | 1 | 0.48mi |
| 2550 NE 7th Ter Pompano Beach, FL | 2.0 | 1.0 | 893 | $2,500 | $2.80 | 22d | 1 | 0.48mi |
| 2849 NE 13th Ave Pompano Beach, FL | 3.0 | 2.0 | 972 | $3,100 | $3.19 | 24d | 1 | 0.52mi |
| 2849 NE 13th Ave Pompano Beach, FL | 3.0 | 2.0 | 972 | $3,200 | $3.29 | 5d | 1 | 0.52mi |
| 2633 NE 13th Ave Unit 1 Pompano Beach, FL | 2.0 | 1.0 | 650 | $2,300 | $3.54 | 21d | 1 | 0.63mi |
| 1510 NE 32nd Pl Pompano Beach, FL | 2.0 | 1.0 | 893 | $2,650 | $2.97 | 24d | 1 | 0.65mi |
| 3050 NW 1st Ave Pompano Beach, FL | 2.0 | 1.0 | 1044 | $1,800 | $1.72 | 24d | 1 | 0.66mi |
| 1433 NE 27th St Pompano Beach, FL | 2.0 | 1.0 | 816 | $2,900 | $3.55 | 24d | 1 | 0.67mi |
| 3281 E Golf Blvd #4 Pompano Beach, FL | 2.0 | 1.5 | 1020 | $2,200 | $2.16 | 24d | 1 | 0.67mi |
| 1480 E Sample Rd Pompano Beach, FL | 1.0 | 1.0 | 640 | $1,550 | $2.42 | 15d | 2 | 0.68mi |
| 1480 E Sample Rd #207 Pompano Beach, FL | 1.0 | 1.0 | 640 | $1,600 | $2.50 | 24d | 1 | 0.68mi |
| 3281 E Golf Blvd #12 Pompano Beach, FL | 2.0 | 1.0 | 1020 | $2,200 | $2.16 | 24d | 1 | 0.68mi |
| 111 NW 31st Ct Pompano Beach, FL | 2.0 | 1.0 | 874 | $1,995 | $2.28 | 24d | 1 | 0.68mi |
| 1530 NE 33rd St Unit 1530 Pompano Beach, FL | 2.0 | 1.0 | 893 | $2,100 | $2.35 | 24d | 1 | 0.69mi |
| 1512 NE 28th St Pompano Beach, FL | 2.0 | 1.0 | 624 | $2,500 | $4.01 | 24d | 1 | 0.69mi |
| 1101 NE 23rd Pl Unit 1 Pompano Beach, FL | 3.0 | 2.0 | 1117 | $3,000 | $2.69 | 24d | 1 | 0.72mi |
| 1587 NE 30th St Unit 1503921P Pompano Beach, FL | 3.0 | 2.0 | 796 | $6,432 | $8.08 | 2d | 1 | 0.74mi |
| 2433 NE 13th Ter Pompano Beach, FL | 3.0 | 2.0 | 824 | $3,800 | $4.61 | 24d | 1 | 0.77mi |
| 2417 NE 13th Ter Pompano Beach, FL | 3.0 | 2.0 | 1000 | $4,200 | $4.20 | 2d | 1 | 0.78mi |
| 1671 NE 33rd St Apt 1 Pompano Beach, FL | 1.0 | 1.0 | 750 | $1,650 | $2.20 | 24d | 1 | 0.82mi |
| 1671 NE 33rd St Unit 3 Pompano Beach, FL | 2.0 | 2.0 | 750 | $2,200 | $2.93 | 24d | 1 | 0.82mi |
| 2900 NE 17th Ave Pompano Beach, FL | 1.0 | 1.0 | 650 | $1,745 | $2.68 | 11d | 1 | 0.83mi |
| 2751 E Golf Blvd #2018 Pompano Beach, FL | 2.0 | 2.0 | 825 | $1,800 | $2.18 | 24d | 1 | 0.83mi |
| 1751 NE 31st St Pompano Beach, FL | 1.0 | 1.0 | 642 | $1,595 | $2.48 | 15d | 1 | 0.85mi |
| 250 W Sample Rd Pompano Beach, FL | 1.0–2.0 | 1.0–2.0 | 900 | $2,150 | $2.39 | 24d | 1 | 0.88mi |
| 3109 NW 2nd Ter Unit 4-156 Pompano Beach, FL | 1.0 | 1.0 | 680 | $1,600 | $2.35 | 24d | 1 | 0.88mi |
| 3109 NW 2nd Ter Unit 4-156 Pompano Beach, FL | 1.0 | 1.0 | 680 | $1,600 | $2.35 | 15d | 1 | 0.88mi |
| 300 NW 30th Ct #202 Pompano Beach, FL | 1.0 | 1.0 | 633 | $1,650 | $2.61 | 24d | 1 | 0.92mi |
| 201 S Golf Blvd #298 Pompano Beach, FL | 2.0 | 1.0 | 750 | $1,600 | $2.13 | 15d | 1 | 0.93mi |
| 201 S Golf Blvd #2004 Pompano Beach, FL | 2.0 | 1.0 | 820 | $1,700 | $2.07 | 24d | 1 | 0.93mi |
| 3837 NE 17th Ave Pompano Beach, FL | 1.0 | 1.0 | 800 | $2,100 | $2.62 | 11d | 1 | 0.97mi |
| 1901 NE 29th St #2 Lighthouse Point, FL | 1.0 | 1.0 | 700 | $1,600 | $2.29 | 24d | 1 | 0.97mi |
| 251 S Golf Blvd #294 Pompano Beach, FL | 2.0 | 2.0 | 825 | $2,400 | $2.91 | 24d | 1 | 0.99mi |
| 251 S Golf Blvd #294 Pompano Beach, FL | 2.0 | 2.0 | 825 | $2,100 | $2.55 | 11d | 1 | 0.99mi |
| 1911 NE 27th Ct Unit 3 Lighthouse Point, FL | 2.0 | 1.0 | 900 | $2,000 | $2.22 | 24d | 1 | 1.03mi |
Listing history 13 events
-
2026-06-18days on market $65,000 Active 23 DOM
-
2026-06-17days on market $65,000 Active 22 DOM
-
2026-06-16days on market $65,000 Active 21 DOM
-
2026-06-15days on market $65,000 Active 20 DOM
-
2026-06-13days on market $65,000 Active 18 DOM
-
2026-06-09days on market $65,000 Active 14 DOM
-
2026-06-07days on market $65,000 Active 12 DOM
-
2026-06-04days on market $65,000 Active 9 DOM
-
2026-06-03days on market $65,000 Active 8 DOM
-
2026-06-02days on market $65,000 Active 7 DOM
-
2026-06-01days on market $65,000 Active 6 DOM
-
2026-05-31days on market $65,000 Active 5 DOM
-
2026-05-26$65,000 Active
ⓘ Source: listings_history table (triggers on properties + properties_extension) + one-shot
backfill from property_details.listing_events for pre-trigger history.
Climate risk First Street
- Flood 1/10 Low FEMA zone X (unshaded) · 0% chance over 30 yrs
- Wildfire 1/10 Low
- Heat 9/10 Extreme 7 d/yr ≥106°F today · 26 d/yr by 30 yrs out
- Wind 10/10 Extreme 99% chance of damaging wind over 30 yrs
- Air quality 2/10 Low 1 unhealthy d/yr today · 3 by 30 yrs out
Nearby sold comps map
Loading sold comps map…
Walkable amenities ~0.75 mi
Loading nearby amenities…
Taxation est. · year 1
- Rental income
- $27,803
- − Mortgage interest
- −$3,641
- − Property taxes
- −$975
- − Insurance
- −$325
- − Repairs & maintenance
- −$2,224
- − Management
- −$2,224
- − Depreciation
- −$1,891
- Taxable income
- $16,523
- Est. tax owed @ 24.0%
- −$3,965
- After-tax cash flow
- $12,609/yr
For passive investors: Depreciation is non-cash, so a rental often shows a tax loss while cash-flowing — sheltering income. Rental losses are passive: they offset passive income freely, and up to $25,000/yr can offset ordinary (W-2) income if you actively participate and your MAGI is under $100k (phasing out to $0 by $150k); unused losses carry forward. On sale, claimed depreciation is recaptured at up to 25%, and gains may owe capital-gains tax (a 1031 exchange can defer both). Figures are a year-1 estimate at your 24.0% rate — not tax advice; consult a CPA.
Condition & rehab AI · 1 photo
This home is in excellent condition with modern finishes and a spa bathroom, making it a great investment in a senior community.
Value-add opportunities
- Both Landscaping — Enhances curb appeal and adds value
- Both Painting — Fresh paint can make the home look new
- Both Lighting — Improved lighting can make the home more inviting
Renovation cost estimate screening
Value-add ROI direction
- Both Landscaping — Enhances curb appeal and adds value ↑
- Both Painting — Fresh paint can make the home look new ↑
- Both Lighting — Improved lighting can make the home more inviting ↑
ⓘ Cost ranges are severity-bucket heuristics (US national rule-of-thumb). Get contractor quotes + a written scope before underwriting a rehab budget.
Schools (NCES district)
- District
- Broward
- NCES district ID
- 1200180
- Math proficiency
- 42% ▼ -18.00%
- Reading proficiency
- 53% ▼ -5.00%
- Median HH income
- $52,139
- Composite
- 40.88/100
- National rank
- #3621
- State rank
- #46 of 73 in FL
Livability — Pompano Beach
- Score
- 74/100
- State rank
- #284
- US rank
- #4541
Category grades
Schools grade is shown separately in the Schools card above.
Census & demographics
- Census place
- Pompano Beach, FL
- County
- Broward County · 1,963,430 people
- City population
- 155,861
- Metro
- Miami-Fort Lauderdale-Pompano Beach, FL
- Population (ZIP)
- 64,563
- Household income
- $71,301
- Rent vs Own
- Severe rent burden
- 2907.0
Population outlook (Broward County) Hauer SSP2
- Today (2025)
- 2,207,033 people
- By 2030
- 2,360,704 · +7.0%
- By 2040
- 2,661,208 · +20.6%
- By 2050
- 2,946,698 · +33.5%
- By 2075
- 3,602,273 · +63.2%
- By 2100
- 3,970,984 · +79.9%
Race, ethnicity, and origin ACS 2023
- Neighborhood character
- Highly diverse neighborhood (Simpson 0.75)
- Race & ethnicity
- White 34% Hispanic / Latino 27% Black 25% Two or more races 24% Asian 2%
- Hispanic origin (detail)
- Mexican 4% Puerto Rican 4% Cuban 4% Dominican 2%
- Common ancestry
- Hispanic 13% Estonian 10% Romanian 1%
- Foreign-born
- 43% · Canada, Jamaica, Dominican Republic
- Languages at home
- 45% English-only · Spanish 23% French/Haitian/Cajun 16% Other Indo-European 13%
Political lean MEDSL · Broward
- 2024 margin
- D (+17.0) · D 58.0% · R 41.0%
- 2008→2024 swing
- -17.8pp toward R · 2008: 34.7pp · 2024: 17.0pp
- All cycles
- 2024: D+17.0 2020: D+29.8 2016: D+35.0 2012: D+34.9 2008: D+34.7
Not yet ingested
- Civics
- —
Market trends
- HPI YoY
- ▼ -109.09%
- Current HPI
- 474.7007
- Rent YoY
- ▲ 1.75%
- Metro
- Miami-Fort Lauderdale-Pompano Beach, FL
- State GDP YoY
- ▲ 3.28%
- F500 in state
- 36
Industry mix (Fortune 500 HQ in FL)
| Industry | F500 HQs | Revenue |
|---|---|---|
| Industrial Technology | 2 | $29B |
|
||
| Insurance | 2 | $17B |
|
||
| Retail | 1 | $60B |
|
||
| Technology Distribution | 1 | $58B |
|
||
| Homebuilding | 1 | $35B |
|
||
| Technology Manufacturing | 1 | $35B |
|
||
Price history
1 event — show timeline
- 2026-05-26 Listed $65,000 FSBO.com
Cash-flow waterfall
monthlySold comps — $/sqft
last 12 mo · ≤1 miLoading sold comps…