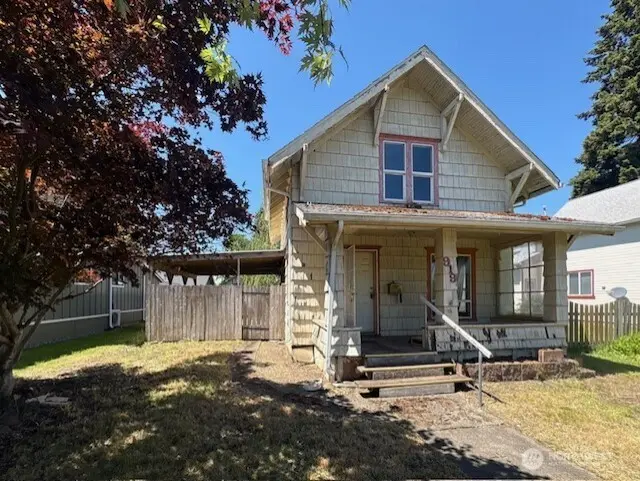
919 E St · Centralia, WA
Flood risk 1/10 · Minimal
- FEMA flood zone
- X
- Chance of flooding over 30 yrs
- 0.0%
- Est. flood insurance / yr
- $507 – $1,088
Fire risk 3/10 · Minor
- Est. fire insurance / yr
- $604 – $1,122
Heat risk 3/10 · Minor
- Hot days now (above 90°F)
- 7 days/yr
- Hot days in 30 yrs
- 15 days/yr
Wind risk 1/10 · Minimal
- Chance of severe wind over 30 yrs
- —
Air-quality risk 6/10 · Moderate
- Unhealthy air days now
- 8 days/yr
- Unhealthy air days in 30 yrs
- 8 days/yr
Risk factors via First Street. Map © Google.
Why this score? — see what drove the C+ grade
The composite is a weighted blend of 9 inputs, each scored 0–100. Each bar is that input's sub-score; the figure is the points it added to the 100-point composite (weight × sub-score).
- Cash flow +20.4/30.0
- ARV discount +15.0/15.0
- DSCR +6.5/10.0
- 1% rule +5.4/10.0
- Schools +4.0/10.0
- Livability +4.0/5.0
- Rent growth +3.2/5.0
- Condition / age +2.5/5.0
- Appreciation +0.0/10.0
$179,900
🖨 Deal sheet 📄 Offer letter ✓ Due diligence
Listing remarks
Bring your hopes, dreams and toolbelt. Buy a few more toolbelts, get a cooler full of cold drinks, invite your friends. Cash offers only.
Key facts
- 6,534 sq ft lot
- Garage
- Built 1920
Property features AI
Finance
- Other: Living area reported as 1,390 (tax record / calculated); Lot size approximately 0.15 acres
- Financial info: Listing terms: Cash
Exterior
- Parking: Detached garage with covered parking for 2 vehicles
- Security: Partially fenced
- Utilities: Electric energy source; Public water (City of Centralia); Sewer connected (City of Centralia); Power provided by City of Centralia
- Home design: Single-family residence; One-and-one-half story house; Built on lot; Has a view; Main-level entry
- Construction: Wood construction; Composition roof
- Exterior features: Wood exterior and wood products; Patio; Curbs, paved streets and sidewalks; Partially fenced lot
Interior
- Bedrooms: Three bedrooms total — two upstairs and one on the main level
- Bathrooms: One full bathroom with a bathtub
- Heating & cooling: Has heating (details in remarks); No central cooling
- Interior features: Partially fenced yard (security feature); Level topography; Main entry
Neighborhood map
What this means for you Summary
Snapshot
- This is a 3-bed/1.0-bath single-family listed at $180k.
Deal economics
- At list price, monthly cash flow is $235 ($3k/yr) — positive.
- The deal already cash-flows at list — no discount required.
- Meets the 1% rule at list price ($2k rent vs $180k).
- Cap rate 7.9% vs local median 3.0% in Centralia — top-decile yield for the area; either an underpriced asset or a hidden risk that comps aren't pricing in. Stress-test before assuming the spread holds.
Location & tenants
- Location reads 81/100 on livability (#81 in WA, #1,497 nationally) — a professional / high-income tenant draw. Strengths: commute A+, health & safety A+, cost of living A; Watch: schools C-, crime C-, employment F.
- Centralia School District (town): math 39% / reading 52% proficiency, ranked #187 of 291 in WA (top 64%) — families likely to look elsewhere, expect single-tenant / working-renter base with shorter leases; 65% free/reduced lunch — lower-income household profile, screen leases tightly.
- Market conditions: Rents rising (+3.0%/yr); 258 active listings in the ZIP; 9 comparable units currently listed for rent nearby; rentals lingering (median 44d on market — plan ~5-8 weeks vacancy on turnover, expect pricing pressure); 89% of comp listings sitting > 30 days — soft ceiling on asking rent; 265 units permitted in Lewis County in 2024 (44 in 5+ unit buildings).
- This rent runs 35% of the median local income ($63k/yr) — at the standard rent-burdened threshold; future hikes will face affordability resistance.
Forward outlook
- Local home prices are declining (-3.0%/yr); year-one equity from $1k of loan paydown is wiped out by about $5k of value loss. Plan a longer hold.
- Lewis County population projected at -11% by 2050 — secular population decline; favor cash flow + early exit over multi-decade hold.
Negotiation context
- Only 14 days on market — expect competitive offers; lowballing is unlikely to land.
- 2 sale attempts since 21y ago; this cycle's ask has dropped $10k (5%) from the opening price — seller is motivated, your offer sets the floor, not the list.
- Current owner paid $146k; 23% above their basis — modest negotiation headroom, anchor on the comps not their cost.
Risks & watch-outs
- Watch-outs: built in 1920 — expect roof / HVAC / electrical / plumbing capex.
Questions for the listing agent
- Built in 1920 — when were the roof, HVAC, electrical panel, plumbing, and water heater last replaced?
- Is there a deadline driving the sale (1031 exchange, divorce, estate, relocation)? That informs how much negotiation room exists.
- What's the average days-on-market for RENTAL listings here right now (not sales)? A rising rental-DOM trend means longer vacancies and softer asking-rent achievability than the comps imply.
- What's the recent tenant-quality profile in this submarket — average credit score on applications, eviction rate, late-payment / NSF rate, and stable-employment percentage? A property-management company in the area should have these aggregated.
- How much new for-sale + rental construction is in the pipeline within 1–3 miles? Heavy new supply typically softens prices + rents 12–24 months out; constrained supply supports both.
Investment metrics
- 1% rule
- 1.04% ✓
- Cap rate
- 7.86%
- Cash-on-cash
- 5.59%
- DSCR
- 1.25
- GRM
- 8.0
CMA / ARV
- ARV (on-the-fly)
- $330,820
- Comps found
- 12
Show comp detail 12 sales within ~0.75 mi
| Address | Dist | Beds/Ba | Sqft | Sold | Price | $/sf | Match |
|---|---|---|---|---|---|---|---|
| 116 E 4th St | 0.21mi | 3/1.0 | 1,428 (+3%) | 2mo | $315,000 | $221 | 84 |
| 815 N Pearl St | 0.12mi | 2/1.5 (-1) | 1,450 (+4%) | 8mo | $345,000 | $238 | 74 |
| 721 W 4th St | 0.29mi | 4/2.0 (+1) | 1,480 (+6%) | 1mo | $415,000 | $280 | 66 |
| 1321 Central Blvd | 0.43mi | 2/1.0 (-1) | 1,428 (+3%) | 7mo | $289,950 | $203 | 65 |
| 729 Euclid Way | 0.49mi | 2/2.0 (-1) | 1,368 (-2%) | 3mo | $330,000 | $241 | 63 |
| 901 L St | 0.44mi | 3/1.0 | 1,550 (+12%) | 1mo | $390,000 | $252 | 59 |
| 429 N Buckner St | 0.53mi | 3/1.0 | 1,299 (-6%) | 7mo | $353,000 | $272 | 59 |
| 700 K St | 0.41mi | 2/1.0 (-1) | 1,273 (-8%) | 6mo | $330,000 | $259 | 57 |
| 515 E Pine St | 0.74mi | 3/1.0 | 1,480 (+6%) | 1mo | $350,000 | $236 | 54 |
| 1431 Oxford Ave | 0.68mi | 3/1.0 | 1,290 (-7%) | 3mo | $185,000 | $143 | 54 |
| 1021 W 4th St | 0.49mi | 3/1.0 | 1,200 (-14%) | 3mo | $282,500 | $235 | 52 |
| 1222 Delaware Ave | 0.49mi | 3/1.0 | 1,200 (-14%) | 4mo | $280,000 | $233 | 51 |
Match score weights: distance 35% · size 25% · config 20% · recency 20%. Top-matched comps best support the ARV.
Projected returns pro-forma
-3.0% appreciation · 3.0% rent growth · sell at horizon
- IRR
- -7.6%
- Equity multiple
- 0.72×
- Total profit
- $-14,175
- Equity at exit
- $26,824
- IRR
- 2.0%
- Equity multiple
- 1.14×
- Total profit
- $7,011
- Equity at exit
- $15,554
Cash invested: $50,372 (down + closing). Projections, not guarantees.
Landlord ↔ Tenant lean methodology
- Overall (STATE)
- 28 Tenant-Leaning
- State Washington
- 28 Tenant-Leaning · D+8
- County
- — inherits STATE
- City
- — inherits STATE
ZIP-level market 98531
- Rents YoY
- 3.0%
- Active inventory
- 258
- Price-to-rent
- 8.0×
Monthly cashflow live
- Estimated rent
- $1,864 high interval (Pro) →
- Mortgage (P&I)
- −$943
- Tax from tax record
- −$220 /mo · $2,637/yr
- Insurance
- −$75
- HOA
- −$0
- Vacancy / Maint / Mgmt
- −$392
- Net cashflow
- $235
Break-even live
UW: 25.0% down · 7.5% · 30yr · 1.5% tax · 5.0% vac · 8.0% maint · 8.0% mgmt
Financing live
Cash to close
- Down payment
- $44,975
- Closing costs
- $5,397
- Reserves months
- —
- Total cash needed
- —
Loan-product check · same deal, 3 products live
Conventional
25% down · 7.5% · 30yr
- Down + closing
- —
- Monthly P&I
- —
- Monthly cashflow
- —
- DSCR
- —
- Eligible?
- —
Personal DTI + credit; lowest rate.
DSCR
20% down · 8.5% · 30yr
- Down + closing
- —
- Monthly P&I
- —
- Monthly cashflow
- —
- DSCR
- —
- Eligible?
- —
No personal income docs; deal must DSCR.
Hard money
10% down · 12.0% · 12mo
- Down + closing
- —
- Monthly P&I
- —
- Monthly cashflow
- —
- DSCR
- —
- Eligible?
- —
Short-term bridge; refi at stabilization.
Rent comps 9 comps
| Address | Beds | Baths | Sqft | Rent | $/sqft | DOM | Units | Dist |
|---|---|---|---|---|---|---|---|---|
| 914 B St Unit B Centralia, WA | 3.0 | 3.0 | 1600 | $2,375 | $1.48 | 43d | 1 | 0.26mi |
| 701 H St Apt E Centralia, WA | 2.0 | 1.0 | 1137 | $1,500 | $1.32 | 43d | 1 | 0.27mi |
| 701 H St Apt R Centralia, WA | 2.0 | 1.5 | 1180 | $1,500 | $1.27 | 43d | 1 | 0.27mi |
| 1207 Windsor Ave Centralia, WA | 3.0 | 1.0 | 1041 | $2,100 | $2.02 | 43d | 1 | 0.53mi |
| 1405 Lewis St Centralia, WA | 2.0 | 1.5 | 1150 | $1,650 | $1.43 | 13d | 1 | 0.91mi |
| 507 S Rock St Centralia, WA | 3.0 | 2.0 | 1100 | $2,050 | $1.86 | 43d | 1 | 0.93mi |
| 609 S Washington Ave Unit B Centralia, WA | 3.0 | 2.0 | 1264 | $2,300 | $1.82 | 43d | 1 | 1.03mi |
| 2711 Niki LN Centralia, WA | 3.0 | 2.0 | 1250 | $2,100 | $1.68 | 43d | 1 | 1.49mi |
| 2711 Niki Ln Bldg D8 Centralia, WA | 3.0 | 2.5 | 1312 | $2,100 | $1.60 | 43d | 1 | 1.50mi |
Listing history 13 events
-
2026-06-19days on market $179,900 Active 14 DOM
-
2026-06-18days on market $179,900 Active 13 DOM
-
2026-06-17days on market $179,900 Active 12 DOM
-
2026-06-17price $179,900 Active 11 DOM
-
2026-06-16days on market $189,900 Active 11 DOM
-
2026-06-15days on market $189,900 Active 10 DOM
-
2026-06-14days on market $189,900 Active 8 DOM
-
2026-06-12days on market $189,900 Active 7 DOM
-
2026-06-09days on market $189,900 Active 4 DOM
-
2026-06-08days on market $189,900 Active 3 DOM
-
2026-06-07days on market $189,900 Active 2 DOM
-
2026-06-07remarks 141-char remark
-
2026-06-07$189,900 Active 1 DOM
ⓘ Source: listings_history table (triggers on properties + properties_extension) + one-shot
backfill from property_details.listing_events for pre-trigger history.
Tax reassessment forecast WA · Resets to sale price
- Current annual tax
- $2,637 · $220/mo
- Projected year-2 tax
- $2,637 · $220/mo
- Expected delta
- $0/yr ($0/mo · 0.0%)
ⓘ Screening estimate from a state-policy table — verify with the county assessor before closing.
Climate risk First Street
- Flood 1/10 Low FEMA zone X · 0% chance over 30 yrs
- Wildfire 3/10 Moderate
- Heat 3/10 Moderate 7 d/yr ≥90°F today · 15 d/yr by 30 yrs out
- Wind 1/10 Low
- Air quality 6/10 Major 8 unhealthy d/yr today · 8 by 30 yrs out
Nearby sold comps map
Loading sold comps map…
Walkable amenities ~0.75 mi
Loading nearby amenities…
Taxation est. · year 1
- Rental income
- $22,373
- − Mortgage interest
- −$10,077
- − Property taxes
- −$2,637
- − Insurance
- −$900
- − Repairs & maintenance
- −$1,790
- − Management
- −$1,790
- − Depreciation
- −$5,233
- Taxable loss
- −$54
- Est. tax savings @ 24.0%
- +$13
- After-tax cash flow
- $2,830/yr
For passive investors: Depreciation is non-cash, so a rental often shows a tax loss while cash-flowing — sheltering income. Rental losses are passive: they offset passive income freely, and up to $25,000/yr can offset ordinary (W-2) income if you actively participate and your MAGI is under $100k (phasing out to $0 by $150k); unused losses carry forward. On sale, claimed depreciation is recaptured at up to 25%, and gains may owe capital-gains tax (a 1031 exchange can defer both). Figures are a year-1 estimate at your 24.0% rate — not tax advice; consult a CPA.
Schools (NCES district)
- District
- Centralia School District
- NCES district ID
- 5301140
- Math proficiency
- 39% ▼ -2.00%
- Reading proficiency
- 52% ▼ -2.00%
- Median HH income
- $38,851
- Composite
- 40.17/100
- National rank
- #7832
- State rank
- #187 of 291 in WA
Livability — Centralia
- Score
- 81/100
- State rank
- #81
- US rank
- #1497
Category grades
Schools grade is shown separately in the Schools card above.
Census & demographics
- Census place
- Centralia, WA
- County
- Lewis County · 27,337 people
- City population
- 27,337
- Metro
- Centralia, WA
- Population (ZIP)
- 27,337
- Household income
- $63,406
- Rent vs Own
- Severe rent burden
- 1000.0
Population outlook (Lewis County) Hauer SSP2
- Today (2025)
- 75,749 people
- By 2030
- 74,647 · -1.5%
- By 2040
- 71,310 · -5.9%
- By 2050
- 67,748 · -10.6%
- By 2075
- 59,829 · -21.0%
- By 2100
- 52,293 · -31.0%
Race, ethnicity, and origin ACS 2023
- Neighborhood character
- Predominantly White (74%)
- Race & ethnicity
- White 74% Hispanic / Latino 19% Two or more races 10% Asian 1%
- Hispanic origin (detail)
- Mexican 15% Puerto Rican 1%
- Common ancestry
- Portuguese 3% Slovak 3% Lithuanian 2%
- Foreign-born
- 9% · Canada, Vietnam
- Languages at home
- 83% English-only · Spanish 16% Tagalog/Filipino 1%
Political lean MEDSL · Lewis
- 2024 margin
- Solid R (+33.0) · D 32.0% · R 65.0% · Other 3.0%
- 2008→2024 swing
- -13.8pp toward R · 2008: -19.2pp · 2024: -33.0pp
- All cycles
- 2024: R+33.0 2020: R+32.8 2016: R+36.2 2012: R+23.5 2008: R+19.2
Not yet ingested
- Civics
- —
Market trends
- HPI YoY
- ▼ -249.98%
- Current HPI
- 378.6936
- Rent YoY
- ▲ 3.00%
- Metro
- Centralia, WA
- State GDP YoY
- ▲ 4.65%
- F500 in state
- 22
Industry mix (Fortune 500 HQ in WA)
| Industry | F500 HQs | Revenue |
|---|---|---|
| Retail | 2 | $269B |
|
||
| Technology / Retail | 1 | $638B |
|
||
| Technology | 1 | $245B |
|
||
| Telecommunications | 1 | $38B |
|
||
| Food / Beverage | 1 | $36B |
|
||
| Automotive / Trucks | 1 | $34B |
|
||
Price history
+26.6% since first listed4 events — show timeline
- 2026-06-05 Listed $189,900 NWMLS as Distributed by MLS Grid
- 2005-12-07 Sold (Public Records) $146,250 Public Records
- 2005-12-07 Sold (MLS) $146,250 NWMLS as Distributed by MLS Grid
- 2005-07-24 Listed $150,000 NWMLS as Distributed by MLS Grid
Property tax history
+4.3%/yrLatest (2026): $2,637 · +8.3% YoY. Source: county tax records.
Cash-flow waterfall
monthlySold comps — $/sqft
last 12 mo · ≤1 miLoading sold comps…