 Duplex
237 W Brooklyn Ave · Dallas, TX
Flood risk 1/10 · Minimal
- FEMA flood zone
- X (unshaded)
- Chance of flooding over 30 yrs
- 0.0%
- Est. flood insurance / yr
- $507 – $1,088
Fire risk 1/10 · Minimal
- Est. fire insurance / yr
- $1,222 – $2,270
Heat risk 7/10 · Major
- Hot days now (above 109°F)
- 7 days/yr
- Hot days in 30 yrs
- 24 days/yr
Wind risk 6/10 · Moderate
- Chance of severe wind over 30 yrs
- 27.0%
Air-quality risk 2/10 · Minimal
- Unhealthy air days now
- 1 days/yr
- Unhealthy air days in 30 yrs
- 2 days/yr
Risk factors via First Street. Map © Google.
Why this score? — see what drove the C- grade
The composite is a weighted blend of 9 inputs, each scored 0–100. Each bar is that input's sub-score; the figure is the points it added to the 100-point composite (weight × sub-score).
- Cash flow +21.6/30.0
- DSCR +6.9/10.0
- ARV discount +6.5/15.0
- 1% rule +6.2/10.0
- Livability +4.0/5.0
- Schools +2.8/10.0
- Condition / age +2.5/5.0
- Rent growth +2.0/5.0
- Appreciation +0.0/10.0
$350,000
🖨 Deal sheet 📄 Offer letter ✓ Due diligence
Multi-family units
County records classify this as Multi-Family (2-4 Unit). Listing-text estimate: 2 units. confirmed
Listing remarks MLS
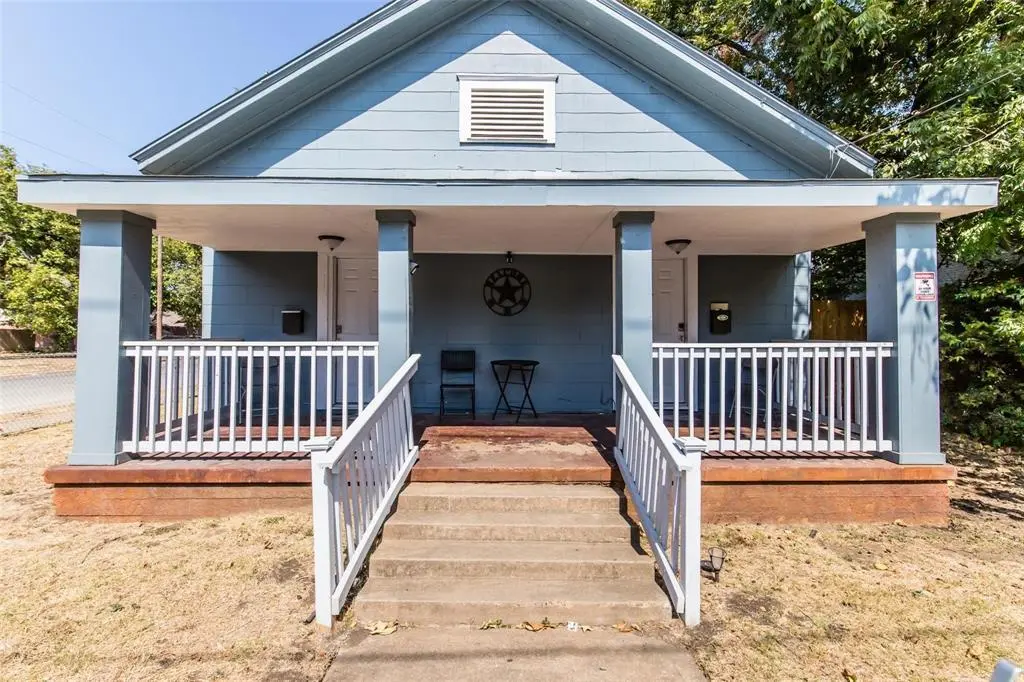
FULL DUPLEX !! GREAT LOCATION !! Calling all investors ! Are you looking to invest in the heart of Dallas ? Here is your opportunity to own a full duplex where you can live in one side and lease the other! Each side features comfortable living areas, private entrances, and functional layouts that create a warm and inviting feel. Close distance to Bishop Arts with trendy shops, dining, and entertainment and conveniently located about 10 minutes drive to Downtown Dallas. Don't miss this opportunity ! Tenant occupied, please do not disturb. Call agent directly to set up a showing. Buyers agent to verify schools.
Key facts
- Private entrances
- Full duplex
- Functional layouts
Tags
Neighborhood map
What this means for you Summary
Snapshot
- This is a 2 × 3-bed/3.0-bath units multifamily listed at $350k.
Deal economics
- At list price, monthly cash flow is $530 ($6k/yr) — positive. Per door: $265/mo.
- The deal already cash-flows at list — no discount required.
- Meets the 1% rule at list price ($4k rent vs $350k).
- Recommended offer: $318k (9.0% below list) — sets the bar for market timing.
- Cap rate 8.1% vs local median 2.3% in Dallas — top-decile yield for the area; either an underpriced asset or a hidden risk that comps aren't pricing in. Stress-test before assuming the spread holds.
Location & tenants
- Location reads 81/100 on livability (#24 in TX, #1,380 nationally) — a professional / high-income tenant draw. Strengths: amenities A+, commute A+, housing A+; Watch: schools C-, crime F.
- Dallas ISD (urban): math 31% / reading 36% proficiency, ranked #559 of 826 in TX (top 68%) — families likely to look elsewhere, expect single-tenant / working-renter base with shorter leases; 83% free/reduced lunch — lower-income household profile, screen leases tightly.
- Market conditions: Rents soft (-1.8%/yr); 242 active listings in the ZIP; 40 comparable units currently listed for rent nearby; rentals lingering (median 44d on market — plan ~5-8 weeks vacancy on turnover, expect pricing pressure); 50% of comp listings sitting > 30 days — soft ceiling on asking rent; solid renter incomes; 12,577 units permitted in Dallas County in 2024 (6,829 in 5+ unit buildings).
- At $3,923/mo this rent would consume 57% of the median local household income ($82k/yr) (locally 1005% of renters already pay >50% of income on rent) — very limited rent-growth headroom before tenants either downsize or default.
Forward outlook
- Local home prices are declining (-3.0%/yr); year-one equity from $2k of loan paydown is wiped out by about $10k of value loss. Plan a longer hold.
- Dallas County population projected at +35% by 2050 — long-run rental-demand tailwind backs the buy-and-hold thesis.
Negotiation context
- It's been on market 105 days — a 9% lower offer ($318k) is reasonable based on typical stale-listing flexibility.
- 8 sale attempts since 13y ago; this cycle's ask has dropped $25k (7%) from the opening price — seller is motivated, your offer sets the floor, not the list.
Risks & watch-outs
- Watch-outs: built in 1915 — expect roof / HVAC / electrical / plumbing capex.
- Climate carrying-cost: major wind risk, 27% chance of damaging wind over 30y; extreme-heat days projected 7→24/yr by 2055 (HVAC capex compounding) — expect insurance premiums to compound above CPI over the hold.
Questions for the listing agent
- It's been on market 105 days. Have you received any prior offers? Is the seller open to a 9% concession, seller financing, or rate buy-down credit?
- Can we see the unit-by-unit rent roll, current vacancy, and any below-market leases? What's the average tenancy length?
- What capital expenditures (roof, boiler, parking lot, exteriors) have been made in the last 5 years, and what's planned in the next 2?
- Built in 1915 — when were the roof, HVAC, electrical panel, plumbing, and water heater last replaced?
- Why hasn't it sold? Are there any deal-killer items the seller is aware of (foundation, flood, title, zoning, code violations)?
- Is there a deadline driving the sale (1031 exchange, divorce, estate, relocation)? That informs how much negotiation room exists.
- Crime grade is F in this area — have there been break-ins, vandalism, or insurance claims at this property in the last 3 years? What carrier currently insures it and at what premium?
- What's the average days-on-market for RENTAL listings here right now (not sales)? A rising rental-DOM trend means longer vacancies and softer asking-rent achievability than the comps imply.
- What's the recent tenant-quality profile in this submarket — average credit score on applications, eviction rate, late-payment / NSF rate, and stable-employment percentage? A property-management company in the area should have these aggregated.
- How much new apartment / multifamily construction is in the pipeline within 1–3 miles? Heavy new supply (>2% of stock underway) typically softens rents 12–24 months out; light construction supports rent growth.
Investment metrics
- 1% rule
- 1.12% ✓
- Cap rate
- 8.11%
- Cash-on-cash
- 6.49%
- DSCR
- 1.29
- GRM
- 7.4
CMA / ARV
- ARV (median comp)
- $342,678
- List price
- $350,000
- Delta
- 2.14%
- Verdict
- FAIR
- Comps
- 16 within 1.0 mi
Show comp detail 2 sales within ~0.75 mi
| Address | Dist | Beds/Ba | Sqft | Sold | Price | $/sf | Match |
|---|---|---|---|---|---|---|---|
| 700 Cumberland St | 0.36mi | 4/2.0 | 1,692 (+6%) | 18mo | $315,000 | $186 | 59 |
| 205 W Jerden Ln | 0.27mi | 4/2.0 | 1,478 (-8%) | 19mo | $250,000 | $169 | 58 |
Match score weights: distance 35% · size 25% · config 20% · recency 20%. Top-matched comps best support the ARV.
Projected returns pro-forma
-3.0% appreciation · 0.0% rent growth · sell at horizon
- IRR
- -9.9%
- Equity multiple
- 0.65×
- Total profit
- $-34,301
- Equity at exit
- $52,186
- IRR
- -5.5%
- Equity multiple
- 0.69×
- Total profit
- $-30,214
- Equity at exit
- $30,262
Cash invested: $98,000 (down + closing). Projections, not guarantees.
Landlord ↔ Tenant lean methodology
- Overall (STATE)
- 87 Strongly Landlord-Friendly
- State Texas
- 87 Strongly Landlord-Friendly · R+5
- County
- — inherits STATE
- City
- — inherits STATE
ZIP-level market 75208
- Rents YoY
- -1.8%
- Active inventory
- 242
- Price-to-rent
- 14.9×
Monthly cashflow live
- Estimated rent
- $3,923 high interval (Pro) →
- Mortgage (P&I)
- −$1,835
- Tax from tax record
- −$588 /mo · $7,054/yr
- Insurance
- −$146
- HOA
- −$0
- Vacancy / Maint / Mgmt
- −$824
- Net cashflow
- $530
Break-even live
2-unit breakdown (identical units grouped — click to expand)
| Units | Beds | Baths | Est. rent |
|---|---|---|---|
| 2× units | 3 | 3 | $3,924 |
| #1 | 3 | 3 | $1,962 |
| #2 | 3 | 3 | $1,962 |
| Total (2 units) | $3,923 | ||
UW: 25.0% down · 7.5% · 30yr · 1.5% tax · 5.0% vac · 8.0% maint · 8.0% mgmt
Financing live
Cash to close
- Down payment
- $87,500
- Closing costs
- $10,500
- Reserves months
- —
- Total cash needed
- —
Loan-product check · same deal, 3 products live
Conventional
25% down · 7.5% · 30yr
- Down + closing
- —
- Monthly P&I
- —
- Monthly cashflow
- —
- DSCR
- —
- Eligible?
- —
Personal DTI + credit; lowest rate.
DSCR
20% down · 8.5% · 30yr
- Down + closing
- —
- Monthly P&I
- —
- Monthly cashflow
- —
- DSCR
- —
- Eligible?
- —
No personal income docs; deal must DSCR.
Hard money
10% down · 12.0% · 12mo
- Down + closing
- —
- Monthly P&I
- —
- Monthly cashflow
- —
- DSCR
- —
- Eligible?
- —
Short-term bridge; refi at stabilization.
Rent comps 40 comps
| Address | Beds | Baths | Sqft | Rent | $/sqft | DOM | Units | Dist |
|---|---|---|---|---|---|---|---|---|
| 219 W Yarmouth St Dallas, TX | 3.0 | 2.5 | 2155 | $3,500 | $1.62 | 43d | 1 | 0.10mi |
| 217 W Yarmouth St Dallas, TX | 3.0 | 2.5 | 2155 | $3,500 | $1.62 | 43d | 1 | 0.11mi |
| 314 W Clarendon Dr Dallas, TX | 4.0 | 2.0 | 2096 | $1,900 | $0.91 | 43d | 1 | 0.34mi |
| 416 W 9th St Unit a Dallas, TX | 4.0 | 2.0 | 1279 | $2,800 | $2.19 | 43d | 1 | 0.53mi |
| 236 Melba St #101 Dallas, TX | 3.0 | 3.5 | 2225 | $3,800 | $1.71 | 2d | 1 | 0.56mi |
| 435 W 9th St Unit E, F, G Dallas, TX | 3.0 | 3.0 | 1120 | $2,800 | $2.50 | 24d | 1 | 0.57mi |
| 410 Melba St #2 Dallas, TX | 3.0 | 3.0 | 2158 | $3,800 | $1.76 | 7d | 1 | 0.58mi |
| 521 Melba St #101 Dallas, TX | 3.0 | 3.5 | 2100 | $3,800 | $1.81 | 43d | 1 | 0.66mi |
| 723 W 10th St #101 Dallas, TX | 3.0 | 3.5 | 1994 | $3,450 | $1.73 | 24d | 1 | 0.68mi |
| 723 W 10th St Unit 103 Dallas, TX | 3.0 | 3.5 | 1994 | $3,100 | $1.55 | 24d | 1 | 0.68mi |
| 723 W 10th St Unit 109 Dallas, TX | 3.0 | 3.5 | 1994 | $3,200 | $1.60 | 7d | 1 | 0.68mi |
| 727 W 10th St Dallas, TX | 3.0 | 4.0 | 1994 | $3,350 | $1.68 | 43d | 1 | 0.69mi |
| 727 W 10th St Unit 108 Dallas, TX | 3.0 | 3.5 | 1994 | $3,150 | $1.58 | 24d | 1 | 0.69mi |
| 632 Melba St Dallas, TX | 3.0 | 2.5 | 1765 | $2,900 | $1.64 | 43d | 1 | 0.71mi |
| 820 W 10th St Dallas, TX | 3.0 | 2.5 | 1200 | $2,100 | $1.75 | 43d | 1 | 0.75mi |
| 627 Finley Ct Dallas, TX | 3.0 | 3.0 | 2014 | $3,450 | $1.71 | 43d | 1 | 0.78mi |
| 405 S Ewing Ave Unit 309 Dallas, TX | 3.0 | 2.0 | 1343 | $2,875 | $2.14 | 24d | 1 | 0.83mi |
| 112 E Oscar Dr Dallas, TX | 3.0 | 3.0 | 2012 | $3,400 | $1.69 | 10d | 1 | 0.85mi |
| 114 E Chester Ct Dallas, TX | 3.0 | 3.0 | 1834 | $3,000 | $1.64 | 24d | 1 | 0.87mi |
| 734 W 7th St Dallas, TX | 3.0 | 3.0 | 2008 | $4,250 | $2.12 | 43d | 1 | 0.87mi |
| 1731 Seevers Ave Dallas, TX | 3.0 | 2.0 | 1980 | $2,480 | $1.25 | 43d | 1 | 0.88mi |
| 728 N Beckley Ave Dallas, TX | 3.0 | 2.0 | 1320 | $2,800 | $2.12 | 7d | 1 | 0.90mi |
| 1805 S Zang Blvd Dallas, TX | 1.0–3.0 | 1.0–2.0 | 940 | $1,701 | $1.81 | 7d | 1 | 0.92mi |
| 715 Dover St Dallas, TX | 3.0 | 2.0 | 1180 | $1,995 | $1.69 | 7d | 1 | 0.95mi |
| 1810 Ramsey Ave Dallas, TX | 3.0 | 2.0 | 1546 | $2,350 | $1.52 | 43d | 1 | 0.96mi |
| 901 Elsbeth St Dallas, TX | 3.0 | 3.5 | 1976 | $4,200 | $2.13 | 16d | 1 | 1.03mi |
| 909 Elsbeth St Unit 1019507P Dallas, TX | 3.0 | 3.0 | 1786 | $9,981 | $5.59 | 22d | 1 | 1.05mi |
| 1018 E Waco Ave Dallas, TX | 3.0 | 1.0 | 1112 | $1,395 | $1.25 | 44d | 1 | 1.05mi |
| 642 N Tyler St Dallas, TX | 3.0 | 4.0 | 2102 | $3,495 | $1.66 | 17d | 1 | 1.06mi |
| 642 N Tyler St Dallas, TX | 3.0 | 4.0 | 2102 | $3,495 | $1.66 | 7d | 1 | 1.06mi |
| 1311 Nolte Dr Dallas, TX | 3.0 | 2.0 | 1318 | $1,950 | $1.48 | 43d | 1 | 1.07mi |
| 645 N Tyler St Dallas, TX | 2.0–3.0 | 2.5 | 1672 | $3,200 | $1.91 | 43d | 2 | 1.08mi |
| 335 N Marsalis Ave Dallas, TX | 3.0 | 2.0 | 1260 | $2,100 | $1.67 | 43d | 1 | 1.10mi |
| 1007 N Madison Ave Dallas, TX | 4.0 | 2.0 | 1895 | $3,500 | $1.85 | 43d | 1 | 1.10mi |
| 312 S Lancaster Ave Unit 104 Dallas, TX | 3.0 | 3.5 | 1941 | $2,750 | $1.42 | 43d | 1 | 1.13mi |
| 1131 Forester Dr Dallas, TX | 4.0 | 3.0 | 1866 | $2,600 | $1.39 | 43d | 1 | 1.13mi |
| 1210 Grant St Dallas, TX | 4.0 | 1.0 | 1370 | $2,050 | $1.50 | 7d | 1 | 1.14mi |
| 407 S Windomere Ave Dallas, TX | 3.0 | 2.0 | 1567 | $2,600 | $1.66 | 43d | 1 | 1.16mi |
| 1218 Grant St Dallas, TX | 3.0 | 2.5 | 2057 | $2,699 | $1.31 | 22d | 1 | 1.16mi |
| 1218 Grant St Dallas, TX | 3.0 | 2.5 | 2057 | $2,699 | $1.31 | 24d | 1 | 1.16mi |
Listing history 43 events
-
2026-06-18days on market $350,000 Active 105 DOM
-
2026-06-17days on market $350,000 Active 104 DOM
-
2026-06-16days on market $350,000 Active 103 DOM
-
2026-06-15days on market $350,000 Active 102 DOM
-
2026-06-13days on market $350,000 Active 100 DOM
-
2026-06-09days on market $350,000 Active 96 DOM
-
2026-06-08days on market $350,000 Active 95 DOM
-
2026-06-07days on market $350,000 Active 94 DOM
-
2026-06-04days on market $350,000 Active 91 DOM
-
2026-06-03days on market $350,000 Active 90 DOM
-
2026-06-02days on market $350,000 Active 89 DOM
-
2026-06-02days on market $350,000 Active 88 DOM
-
2026-05-31days on market $350,000 Active 87 DOM
-
2026-04-13price $350,000 620-char remark
Show marketing remark (620 chars)
FULL DUPLEX !! GREAT LOCATION !! Calling all investors ! Are you looking to invest in the heart of Dallas ? Here is your opportunity to own a full duplex where you can live in one side and lease the other! Each side features comfortable living areas, private entrances, and functional layouts that create a warm and inviting feel. Close distance to Bishop Arts with trendy shops, dining, and entertainment and conveniently located about 10 minutes drive to Downtown Dallas. Don't miss this opportunity ! Tenant occupied, please do not disturb. Call agent directly to set up a showing. Buyers agent to verify schools.
-
2026-03-05$375,000 Active 620-char remark
Show marketing remark (620 chars)
FULL DUPLEX !! GREAT LOCATION !! Calling all investors ! Are you looking to invest in the heart of Dallas ? Here is your opportunity to own a full duplex where you can live in one side and lease the other! Each side features comfortable living areas, private entrances, and functional layouts that create a warm and inviting feel. Close distance to Bishop Arts with trendy shops, dining, and entertainment and conveniently located about 10 minutes drive to Downtown Dallas. Don't miss this opportunity ! Tenant occupied, please do not disturb. Call agent directly to set up a showing. Buyers agent to verify schools.
-
2025-12-31historical
-
2025-10-08price $400,000
-
2025-09-21$425,000 Active
-
2025-08-27historical
-
2025-07-19price $430,000
-
2025-06-13price $434,000
-
2025-05-03price $435,000
-
2025-04-14$450,000 Active
-
2021-10-27soldstatus
-
2021-10-21soldstatus Sold
-
2021-10-06status Pending
-
2021-09-19status Active
-
2021-09-16historical Active Option Contract
-
2021-09-09status Active
-
2021-09-02historical Active Option Contract
-
2021-08-27$360,000 Active
-
2020-11-02soldstatus
-
2019-01-11soldstatus
-
2018-07-13soldstatus
-
2018-07-12soldstatus Sold
-
2018-05-31status Pending
-
2018-05-21historical Active Contingent
-
2018-05-10$220,000 Active
-
2013-06-18soldstatus
-
2013-06-07status Pending
-
2013-05-05$68,000 Active
-
2011-04-08soldstatus
-
1986-12-22soldstatus
ⓘ Source: listings_history table (triggers on properties + properties_extension) + one-shot
backfill from property_details.listing_events for pre-trigger history.
Tax reassessment forecast TX · Resets to sale price
- Current annual tax
- $7,054 · $588/mo
- Projected year-2 tax
- $7,054 · $588/mo
- Expected delta
- $0/yr ($0/mo · -0.0%)
ⓘ Screening estimate from a state-policy table — verify with the county assessor before closing.
Climate risk First Street
- Flood 1/10 Low FEMA zone X (unshaded) · 0% chance over 30 yrs
- Wildfire 1/10 Low
- Heat 7/10 Severe 7 d/yr ≥109°F today · 24 d/yr by 30 yrs out
- Wind 6/10 Major 27% chance of damaging wind over 30 yrs
- Air quality 2/10 Low 1 unhealthy d/yr today · 2 by 30 yrs out
Nearby sold comps map
Loading sold comps map…
Walkable amenities ~0.75 mi
Loading nearby amenities…
Taxation est. · year 1
- Rental income
- $47,076
- − Mortgage interest
- −$19,605
- − Property taxes
- −$7,054
- − Insurance
- −$1,750
- − Repairs & maintenance
- −$3,766
- − Management
- −$3,766
- − Depreciation
- −$10,182
- Taxable income
- $952
- Est. tax owed @ 24.0%
- −$229
- After-tax cash flow
- $6,132/yr
For passive investors: Depreciation is non-cash, so a rental often shows a tax loss while cash-flowing — sheltering income. Rental losses are passive: they offset passive income freely, and up to $25,000/yr can offset ordinary (W-2) income if you actively participate and your MAGI is under $100k (phasing out to $0 by $150k); unused losses carry forward. On sale, claimed depreciation is recaptured at up to 25%, and gains may owe capital-gains tax (a 1031 exchange can defer both). Figures are a year-1 estimate at your 24.0% rate — not tax advice; consult a CPA.
Schools (NCES district)
- District
- Dallas ISD
- NCES district ID
- 4816230
- Math proficiency
- 31% ▼ -16.00%
- Reading proficiency
- 36% ▼ -4.00%
- Median HH income
- $42,881
- Composite
- 28.41/100
- National rank
- #6763
- State rank
- #559 of 826 in TX
Livability — Dallas
- Score
- 81/100
- State rank
- #24
- US rank
- #1380
Category grades
Schools grade is shown separately in the Schools card above.
Census & demographics
- Census place
- Dallas, TX
- County
- Dallas County · 2,612,404 people
- City population
- 1,168,437
- Metro
- Dallas-Fort Worth-Arlington, TX
- Population (ZIP)
- 29,367
- Household income
- $81,950
- Rent vs Own
- Severe rent burden
- 1005.0
Population outlook (Dallas County) Hauer SSP2
- Today (2025)
- 2,979,839 people
- By 2030
- 3,191,823 · +7.1%
- By 2040
- 3,619,611 · +21.5%
- By 2050
- 4,026,915 · +35.1%
- By 2075
- 4,957,073 · +66.4%
- By 2100
- 5,508,725 · +84.9%
Race, ethnicity, and origin ACS 2023
- Neighborhood character
- Diverse neighborhood (Simpson 0.57)
- Race & ethnicity
- Hispanic / Latino 55% White 34% Two or more races 21% Black 7% Native American 2% Asian 1%
- Hispanic origin (detail)
- Mexican 48%
- Common ancestry
- Romanian 2% Italian 2% Slovak 2%
- Foreign-born
- 22% · Canada
- Languages at home
- 56% English-only · Spanish 42% Other Indo-European 1% French/Haitian/Cajun 1%
Political lean MEDSL · Dallas
- 2024 margin
- Strong D (+22.2) · D 60.2% · R 38.0% · Other 1.8%
- 2008→2024 swing
- +6.9pp toward D · 2008: 15.3pp · 2024: 22.2pp
- All cycles
- 2024: D+22.2 2020: D+31.6 2016: D+26.2 2012: D+15.4 2008: D+15.3
Not yet ingested
- Civics
- —
Market trends
- HPI YoY
- ▼ -410.06%
- Current HPI
- 393.6928
- Rent YoY
- ▼ -1.83%
- Metro
- Dallas-Fort Worth-Arlington, TX
- State GDP YoY
- ▲ 3.95%
- F500 in state
- 110
Industry mix (Fortune 500 HQ in TX)
| Industry | F500 HQs | Revenue |
|---|---|---|
| Energy | 16 | $1,198B |
|
||
| Technology | 5 | $198B |
|
||
| Engineering / Construction | 4 | $72B |
|
||
| Energy Services | 3 | $60B |
|
||
| Utilities | 3 | $41B |
|
||
| Healthcare | 2 | $330B |
|
||
Price history
+414.7% since first listed30 events — show timeline
- 2026-04-13 Price Changed $350,000 NTREIS
- 2026-03-05 Listed $375,000 NTREIS
- 2025-12-31 Listing Removed — NTREIS
- 2025-10-08 Price Changed $400,000 NTREIS
- 2025-09-21 Listed $425,000 NTREIS
- 2025-08-27 Listing Removed — NTREIS
- 2025-07-19 Price Changed $430,000 NTREIS
- 2025-06-13 Price Changed $434,000 NTREIS
- 2025-05-03 Price Changed $435,000 NTREIS
- 2025-04-14 Listed $450,000 NTREIS
- 2021-10-27 Sold (Public Records) — Public Records
- 2021-10-21 Sold (MLS) — NTREIS
- 2021-10-06 Pending — NTREIS
- 2021-09-19 Relisted — NTREIS
- 2021-09-16 Contingent — NTREIS
- 2021-09-09 Relisted — NTREIS
- 2021-09-02 Contingent — NTREIS
- 2021-08-27 Listed $360,000 NTREIS
- 2020-11-02 Sold (Public Records) — Public Records
- 2019-01-11 Sold (Public Records) — Public Records
- 2018-07-13 Sold (Public Records) — Public Records
- 2018-07-12 Sold (MLS) — NTREIS
- 2018-05-31 Pending — NTREIS
- 2018-05-21 Contingent — NTREIS
- 2018-05-10 Listed $220,000 NTREIS
- 2013-06-18 Sold (Public Records) — Public Records
- 2013-06-07 Pending — NTREIS
- 2013-05-05 Listed $68,000 NTREIS
- 2011-04-08 Sold (Public Records) — Public Records
- 1986-12-22 Sold (Public Records) — Public Records
Property tax history
+10.0%/yrLatest (2025): $7,054 · -3.3% YoY. Source: county tax records.
Cash-flow waterfall
monthlySold comps — $/sqft
last 12 mo · ≤1 miLoading sold comps…