 🏷️ Likely Rental
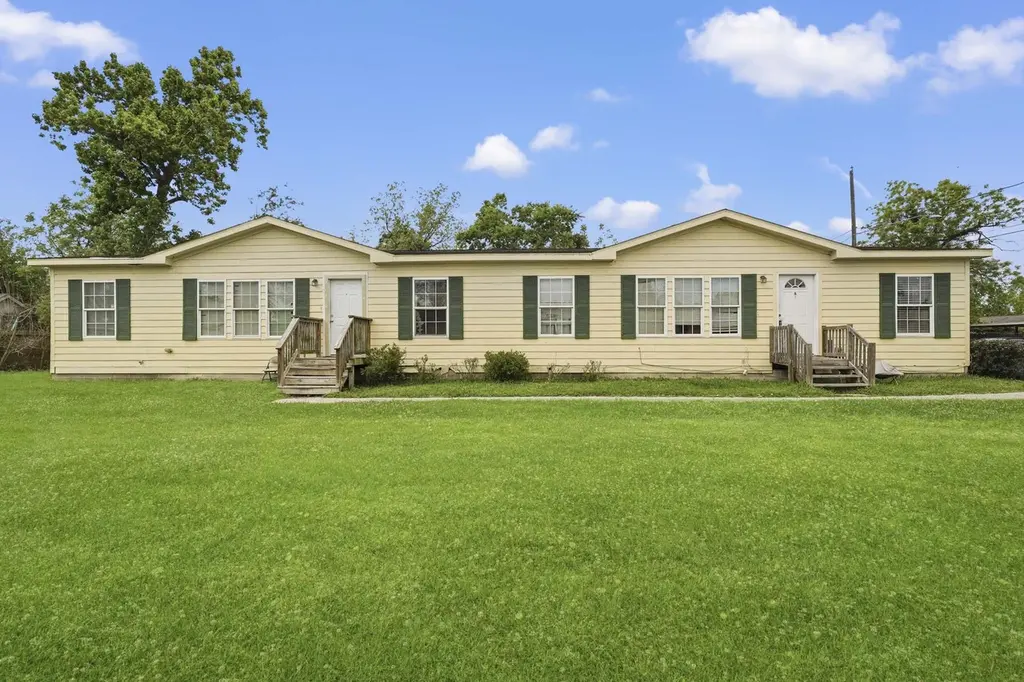
7446 Weyburn St · Houston, TX
Flood risk 3/10 · Minor
- FEMA flood zone
- X (unshaded)
- Chance of flooding over 30 yrs
- 0.2%
- Est. flood insurance / yr
- $507 – $1,088
Fire risk 1/10 · Minimal
- Est. fire insurance / yr
- $1,222 – $2,270
Heat risk 9/10 · Severe
- Hot days now (above 111°F)
- 7 days/yr
- Hot days in 30 yrs
- 24 days/yr
Wind risk 9/10 · Severe
- Chance of severe wind over 30 yrs
- 99.0%
Air-quality risk 3/10 · Minor
- Unhealthy air days now
- 2 days/yr
- Unhealthy air days in 30 yrs
- 3 days/yr
Risk factors via First Street. Map © Google.
Why this score? — see what drove the A- grade
The composite is a weighted blend of 9 inputs, each scored 0–100. Each bar is that input's sub-score; the figure is the points it added to the 100-point composite (weight × sub-score).
- Cash flow +30.0/30.0
- ARV discount +15.0/15.0
- DSCR +10.0/10.0
- 1% rule +9.9/10.0
- Appreciation +7.6/10.0
- Livability +3.7/5.0
- Schools +2.7/10.0
- Condition / age +2.5/5.0
- Rent growth +2.1/5.0
$232,999
🖨 Deal sheet 📄 Offer letter ✓ Due diligence
Multi-family units
County records classify this as Multi-Family (2-4 Unit). Listing-text estimate: 2 units. confirmed
Listing remarks MLS
Excellent investment opportunity! This duplex features two spacious 3-bedroom, 2-bathroom units, each offering comfortable layouts and strong rental appeal. Both units are currently tenant-occupied. Each side offers functional living spaces, well-sized bedrooms, and private amenities suited for long-term tenancy.Property is being sold as-is.
Key facts
- 8,320 sq ft lot
- Built 2006
- Listed 59 days
Neighborhood map
What this means for you Summary
Snapshot
- This is a 2 × 3-bed/2.0-bath units multifamily listed at $233k.
Deal economics
- At list price, monthly cash flow is $945 ($11k/yr) — positive. Per door: $473/mo.
- The deal already cash-flows at list — no discount required.
- Meets the 1% rule at list price ($3k rent vs $233k).
- Recommended offer: $226k (3.0% below list) — sets the bar for market timing.
- Cap rate 11.2% vs local median 3.2% in Houston — top-decile yield for the area; either an underpriced asset or a hidden risk that comps aren't pricing in. Stress-test before assuming the spread holds.
Location & tenants
- Location reads 74/100 on livability (#184 in TX, #4,771 nationally) — a middle-class / working-renter tenant base. Strengths: amenities A+, cost of living A+, housing A+; Watch: schools D, crime F.
- Houston ISD (urban): math 27% / reading 35% proficiency, ranked #593 of 826 in TX (top 72%) — families likely to look elsewhere, expect single-tenant / working-renter base with shorter leases; 71% free/reduced lunch — lower-income household profile, screen leases tightly.
- Market conditions: Rents soft (-1.6%/yr); 353 active listings in the ZIP; 1 comparable units currently listed for rent nearby; lower-income renter base — watch delinquency; 29,883 units permitted in Harris County in 2024 (8,621 in 5+ unit buildings).
- At $3,467/mo this rent would consume 108% of the median local household income ($38k/yr) (locally 1177% of renters already pay >50% of income on rent) — very limited rent-growth headroom before tenants either downsize or default.
Forward outlook
- In year one you build about $14k of equity ($2k loan paydown + $12k appreciation (5.2% local appreciation)).
- Harris County population projected at +47% by 2050 — long-run rental-demand tailwind backs the buy-and-hold thesis.
- At projected returns (5.2% appreciation + 0.0% rent growth), your $65k cash investment doubles in ~3 years — after that, you're playing with house money.
- By year 3, paydown + projected appreciation supports a ~$34k cash-out refi (75% LTV) — recoverable capital for the next deal without selling this one.
Negotiation context
- It's been on market 59 days — a 3% lower offer ($226k) is reasonable based on typical stale-listing flexibility.
- 11 sale attempts since 20y ago; this cycle's ask has dropped $17k (7%) from the opening price — seller is motivated, your offer sets the floor, not the list.
Risks & watch-outs
- Climate carrying-cost: severe wind risk, 99% chance of damaging wind over 30y; extreme-heat days projected 7→24/yr by 2055 (HVAC capex compounding) — expect insurance premiums to compound above CPI over the hold.
Questions for the listing agent
- It's been on market 59 days. Have you received any prior offers? Is the seller open to a 3% concession, seller financing, or rate buy-down credit?
- Can we see the unit-by-unit rent roll, current vacancy, and any below-market leases? What's the average tenancy length?
- What capital expenditures (roof, boiler, parking lot, exteriors) have been made in the last 5 years, and what's planned in the next 2?
- Is there a deadline driving the sale (1031 exchange, divorce, estate, relocation)? That informs how much negotiation room exists.
- Schools are D-rated, which usually means shorter tenancies and higher turnover. Who's the typical renter profile here, and what's been the actual vacancy rate?
- Crime grade is F in this area — have there been break-ins, vandalism, or insurance claims at this property in the last 3 years? What carrier currently insures it and at what premium?
- What's the average days-on-market for RENTAL listings here right now (not sales)? A rising rental-DOM trend means longer vacancies and softer asking-rent achievability than the comps imply.
- What's the recent tenant-quality profile in this submarket — average credit score on applications, eviction rate, late-payment / NSF rate, and stable-employment percentage? A property-management company in the area should have these aggregated.
- How much new apartment / multifamily construction is in the pipeline within 1–3 miles? Heavy new supply (>2% of stock underway) typically softens rents 12–24 months out; light construction supports rent growth.
Investment metrics
- 1% rule
- 1.49% ✓
- Cap rate
- 11.16%
- Cash-on-cash
- 17.38%
- DSCR
- 1.77
- GRM
- 5.6
CMA / ARV
- ARV (median comp)
- $385,309
- List price
- $232,999
- Delta
- -39.53%
- Verdict
- UNDERPRICED
- Comps
- 20 within 1.0 mi
Show comp detail 6 sales within ~0.75 mi
| Address | Dist | Beds/Ba | Sqft | Sold | Price | $/sf | Match |
|---|---|---|---|---|---|---|---|
| 7504 Laura Koppe Rd Unit A and B | 0.26mi | 6/— | 2,473 (+2%) | 10mo | $390,000 | $158 | 76 |
| 8705 Westcott Rd Unit A | 0.55mi | 6/4.0 | 2,550 (+6%) | 15mo | $395,990 | $155 | 52 |
| 9024 Sherbourne St | 0.55mi | 6/2.0 | 2,332 (-4%) | 17mo | $410,000 | $176 | 46 |
| 8707 Westcott Rd Unit A/B | 0.55mi | 6/3.0 | 2,772 (+15%) | 14mo | $122,500 | $44 | 34 |
| 8711 Westcott Rd Unit A/B | 0.54mi | 6/2.0 | 2,772 (+15%) | 14mo | $122,500 | $44 | 31 |
| 8709 Westcott Rd Unit A/B | 0.55mi | 6/2.0 | 2,772 (+15%) | 14mo | $122,500 | $44 | 31 |
Match score weights: distance 35% · size 25% · config 20% · recency 20%. Top-matched comps best support the ARV.
Projected returns pro-forma
5.25% appreciation · 0.0% rent growth · sell at horizon
- IRR
- 26.5%
- Equity multiple
- 2.64×
- Total profit
- $107,175
- Equity at exit
- $135,519
- IRR
- 23.8%
- Equity multiple
- 4.88×
- Total profit
- $253,422
- Equity at exit
- $236,818
Cash invested: $65,240 (down + closing). Projections, not guarantees.
Landlord ↔ Tenant lean methodology
- Overall (STATE)
- 87 Strongly Landlord-Friendly
- State Texas
- 87 Strongly Landlord-Friendly · R+5
- County
- — inherits STATE
- City
- — inherits STATE
ZIP-level market 77028
- Home prices YoY
- 2.0%
- Rents YoY
- -1.6%
- Active inventory
- 353
- Price-to-rent
- 11.2×
Monthly cashflow live
- Estimated rent
- $3,467 high interval (Pro) →
- Mortgage (P&I)
- −$1,222
- Tax from tax record
- −$475 /mo · $5,698/yr
- Insurance
- −$97
- HOA
- −$0
- Vacancy / Maint / Mgmt
- −$728
- Net cashflow
- $945
Break-even live
2-unit breakdown (identical units grouped — click to expand)
| Units | Beds | Baths | Est. rent |
|---|---|---|---|
| 2× units | 3 | 2 | $3,466 |
| #1 | 3 | 2 | $1,733 |
| #2 | 3 | 2 | $1,733 |
| Total (2 units) | $3,467 | ||
UW: 25.0% down · 7.5% · 30yr · 1.5% tax · 5.0% vac · 8.0% maint · 8.0% mgmt
Financing live
Cash to close
- Down payment
- $58,250
- Closing costs
- $6,990
- Reserves months
- —
- Total cash needed
- —
Loan-product check · same deal, 3 products live
Conventional
25% down · 7.5% · 30yr
- Down + closing
- —
- Monthly P&I
- —
- Monthly cashflow
- —
- DSCR
- —
- Eligible?
- —
Personal DTI + credit; lowest rate.
DSCR
20% down · 8.5% · 30yr
- Down + closing
- —
- Monthly P&I
- —
- Monthly cashflow
- —
- DSCR
- —
- Eligible?
- —
No personal income docs; deal must DSCR.
Hard money
10% down · 12.0% · 12mo
- Down + closing
- —
- Monthly P&I
- —
- Monthly cashflow
- —
- DSCR
- —
- Eligible?
- —
Short-term bridge; refi at stabilization.
Rent comps 1 comps
| Address | Beds | Baths | Sqft | Rent | $/sqft | DOM | Units | Dist |
|---|---|---|---|---|---|---|---|---|
| 8117 Richland Dr Houston, TX | 5.0 | 2.0 | 1671 | $1,983 | $1.19 | 2d | 1 | 0.89mi |
Listing history 45 events
-
2026-06-18days on market $232,999 Active 59 DOM
-
2026-06-17days on market $232,999 Active 58 DOM
-
2026-06-16days on market $232,999 Active 57 DOM
-
2026-06-15days on market $232,999 Active 56 DOM
-
2026-06-13days on market $232,999 Active 54 DOM
-
2026-06-10days on market $232,999 Active 50 DOM
-
2026-06-08days on market $232,999 Active 49 DOM
-
2026-06-07pricedays on market $232,999 Active 48 DOM
-
2026-06-04days on market $242,999 Active 45 DOM
-
2026-06-01days on market $242,999 Active 42 DOM
-
2026-05-31days on market $242,999 Active 41 DOM
-
2026-04-20$249,999 Active 343-char remark
Show marketing remark (343 chars)
Excellent investment opportunity! This duplex features two spacious 3-bedroom, 2-bathroom units, each offering comfortable layouts and strong rental appeal. Both units are currently tenant-occupied. Each side offers functional living spaces, well-sized bedrooms, and private amenities suited for long-term tenancy.Property is being sold as-is.
-
2022-03-04soldstatus
-
2021-10-20soldstatus
-
2021-07-28soldstatus
-
2021-07-23soldstatus Sold 388-char remark
Show marketing remark (388 chars)
This duplex is rented and producing income! Investors this is a fantastic opportunity in a hot rental market. Owner has several rental properties available. Please have your real estate agent message me for a list of all properties and monthly rates. Drive by showings ONLY at this time. Home is tenant occupied, do NOT disturb tenants. Owner will allow showings during the option period.
-
2021-06-27status Pending 388-char remark
Show marketing remark (388 chars)
This duplex is rented and producing income! Investors this is a fantastic opportunity in a hot rental market. Owner has several rental properties available. Please have your real estate agent message me for a list of all properties and monthly rates. Drive by showings ONLY at this time. Home is tenant occupied, do NOT disturb tenants. Owner will allow showings during the option period.
-
2021-06-16status Option Pending 388-char remark
Show marketing remark (388 chars)
This duplex is rented and producing income! Investors this is a fantastic opportunity in a hot rental market. Owner has several rental properties available. Please have your real estate agent message me for a list of all properties and monthly rates. Drive by showings ONLY at this time. Home is tenant occupied, do NOT disturb tenants. Owner will allow showings during the option period.
-
2021-06-09status Active 388-char remark
Show marketing remark (388 chars)
This duplex is rented and producing income! Investors this is a fantastic opportunity in a hot rental market. Owner has several rental properties available. Please have your real estate agent message me for a list of all properties and monthly rates. Drive by showings ONLY at this time. Home is tenant occupied, do NOT disturb tenants. Owner will allow showings during the option period.
-
2021-06-03historical 388-char remark
Show marketing remark (388 chars)
This duplex is rented and producing income! Investors this is a fantastic opportunity in a hot rental market. Owner has several rental properties available. Please have your real estate agent message me for a list of all properties and monthly rates. Drive by showings ONLY at this time. Home is tenant occupied, do NOT disturb tenants. Owner will allow showings during the option period.
-
2021-06-02status Active 388-char remark
Show marketing remark (388 chars)
This duplex is rented and producing income! Investors this is a fantastic opportunity in a hot rental market. Owner has several rental properties available. Please have your real estate agent message me for a list of all properties and monthly rates. Drive by showings ONLY at this time. Home is tenant occupied, do NOT disturb tenants. Owner will allow showings during the option period.
-
2021-02-17status Pending 388-char remark
Show marketing remark (388 chars)
This duplex is rented and producing income! Investors this is a fantastic opportunity in a hot rental market. Owner has several rental properties available. Please have your real estate agent message me for a list of all properties and monthly rates. Drive by showings ONLY at this time. Home is tenant occupied, do NOT disturb tenants. Owner will allow showings during the option period.
-
2021-02-06status Option Pending 388-char remark
Show marketing remark (388 chars)
This duplex is rented and producing income! Investors this is a fantastic opportunity in a hot rental market. Owner has several rental properties available. Please have your real estate agent message me for a list of all properties and monthly rates. Drive by showings ONLY at this time. Home is tenant occupied, do NOT disturb tenants. Owner will allow showings during the option period.
-
2021-01-29$216,000 Active 388-char remark
Show marketing remark (388 chars)
This duplex is rented and producing income! Investors this is a fantastic opportunity in a hot rental market. Owner has several rental properties available. Please have your real estate agent message me for a list of all properties and monthly rates. Drive by showings ONLY at this time. Home is tenant occupied, do NOT disturb tenants. Owner will allow showings during the option period.
-
2020-11-27historical
-
2020-11-05status Pending, Continue to Show
-
2020-11-04status Pending
-
2020-10-24status Option Pending
-
2020-10-20historical
-
2020-10-20$205,000 Active
-
2020-10-19$205,000 Active
-
2020-10-19historical
-
2020-09-19status Active
-
2020-09-05historical
-
2020-08-04price $205,000
-
2020-06-02$220,000 Active
-
2020-06-02historical
-
2020-04-30$210,000 Active
-
2009-08-25soldstatus
-
2009-07-28historical
-
2009-07-23$39,999
-
2006-08-29soldstatus
-
2006-06-28historical
-
2006-06-01$12,990
-
1988-01-02soldstatus
ⓘ Source: listings_history table (triggers on properties + properties_extension) + one-shot
backfill from property_details.listing_events for pre-trigger history.
Tax reassessment forecast TX · Resets to sale price
- Current annual tax
- $5,698 · $475/mo
- Projected year-2 tax
- $5,698 · $475/mo
- Expected delta
- $0/yr ($0/mo · 0.0%)
ⓘ Screening estimate from a state-policy table — verify with the county assessor before closing.
Climate risk First Street
- Flood 3/10 Moderate FEMA zone X (unshaded) · 20% chance over 30 yrs
- Wildfire 1/10 Low
- Heat 9/10 Extreme 7 d/yr ≥111°F today · 24 d/yr by 30 yrs out
- Wind 9/10 Extreme 99% chance of damaging wind over 30 yrs
- Air quality 3/10 Moderate 2 unhealthy d/yr today · 3 by 30 yrs out
Nearby sold comps map
Loading sold comps map…
Walkable amenities ~0.75 mi
Loading nearby amenities…
Taxation est. · year 1
- Rental income
- $41,604
- − Mortgage interest
- −$13,052
- − Property taxes
- −$5,698
- − Insurance
- −$1,165
- − Repairs & maintenance
- −$3,328
- − Management
- −$3,328
- − Depreciation
- −$6,778
- Taxable income
- $8,254
- Est. tax owed @ 24.0%
- −$1,981
- After-tax cash flow
- $9,360/yr
For passive investors: Depreciation is non-cash, so a rental often shows a tax loss while cash-flowing — sheltering income. Rental losses are passive: they offset passive income freely, and up to $25,000/yr can offset ordinary (W-2) income if you actively participate and your MAGI is under $100k (phasing out to $0 by $150k); unused losses carry forward. On sale, claimed depreciation is recaptured at up to 25%, and gains may owe capital-gains tax (a 1031 exchange can defer both). Figures are a year-1 estimate at your 24.0% rate — not tax advice; consult a CPA.
Schools (NCES district)
- District
- Houston ISD
- NCES district ID
- 4823640
- Math proficiency
- 27% ▼ -18.00%
- Reading proficiency
- 35% ▼ -6.00%
- Median HH income
- $46,054
- Composite
- 26.63/100
- National rank
- #7173
- State rank
- #593 of 826 in TX
Livability — Houston
- Score
- 74/100
- State rank
- #184
- US rank
- #4771
Category grades
Schools grade is shown separately in the Schools card above.
Census & demographics
- Census place
- Houston, TX
- County
- Harris County · 4,702,590 people
- City population
- 3,226,434
- Metro
- Houston-The Woodlands-Sugar Land, TX
- Population (ZIP)
- 19,109
- Household income
- $38,357
- Rent vs Own
- Severe rent burden
- 1177.0
Population outlook (Harris County) Hauer SSP2
- Today (2025)
- 5,571,493 people
- By 2030
- 6,089,821 · +9.3%
- By 2040
- 7,142,806 · +28.2%
- By 2050
- 8,185,864 · +46.9%
- By 2075
- 10,574,329 · +89.8%
- By 2100
- 12,109,958 · +117.4%
Race, ethnicity, and origin ACS 2023
- Neighborhood character
- Majority Black (57%)
- Race & ethnicity
- Black 57% Hispanic / Latino 41% Two or more races 15% White 2%
- Hispanic origin (detail)
- Mexican 36%
- Foreign-born
- 13% · Canada
- Languages at home
- 61% English-only · Spanish 38%
Political lean MEDSL · Harris
- 2024 margin
- Lean D (+5.5) · D 52.0% · R 46.4% · Other 1.6%
- 2008→2024 swing
- +3.9pp toward D · 2008: 1.6pp · 2024: 5.5pp
- All cycles
- 2024: D+5.5 2020: D+13.3 2016: D+12.4 2012: D+0.1 2008: D+1.6
Not yet ingested
- Civics
- —
Market trends
- HPI YoY
- ▲ 5.25%
- Current HPI
- 267.7798
- Rent YoY
- ▼ -1.55%
- Metro
- Houston-The Woodlands-Sugar Land, TX
- State GDP YoY
- ▲ 3.95%
- F500 in state
- 110
Industry mix (Fortune 500 HQ in TX)
| Industry | F500 HQs | Revenue |
|---|---|---|
| Energy | 16 | $1,198B |
|
||
| Technology | 5 | $198B |
|
||
| Engineering / Construction | 4 | $72B |
|
||
| Energy Services | 3 | $60B |
|
||
| Utilities | 3 | $41B |
|
||
| Healthcare | 2 | $330B |
|
||
Price history
+1824.5% since first listed34 events — show timeline
- 2026-04-20 Listed $249,999 HARMLS
- 2022-03-04 Sold (Public Records) — Public Records
- 2021-10-20 Sold (Public Records) — Public Records
- 2021-07-28 Sold (Public Records) — Public Records
- 2021-07-23 Sold (MLS) — HARMLS
- 2021-06-27 Pending — HARMLS
- 2021-06-16 Pending — HARMLS
- 2021-06-09 Relisted — HARMLS
- 2021-06-03 Listing Removed — HARMLS
- 2021-06-02 Relisted — HARMLS
- 2021-02-17 Pending — HARMLS
- 2021-02-06 Pending — HARMLS
- 2021-01-29 Listed $216,000 HARMLS
- 2020-11-27 Listing Removed — HARMLS
- 2020-11-05 Pending — HARMLS
- 2020-11-04 Pending — HARMLS
- 2020-10-24 Pending — HARMLS
- 2020-10-20 Listed $205,000 HARMLS
- 2020-10-20 Listing Removed — HARMLS
- 2020-10-19 Listing Removed — HARMLS
- 2020-10-19 Listed $205,000 HARMLS
- 2020-09-19 Relisted — HARMLS
- 2020-09-05 Listing Removed — HARMLS
- 2020-08-04 Price Changed $205,000 HARMLS
- 2020-06-02 Listing Removed — HARMLS
- 2020-06-02 Listed $220,000 HARMLS
- 2020-04-30 Listed $210,000 HARMLS
- 2009-08-25 Sold (MLS) — HARMLS
- 2009-07-28 Listing Removed — HARMLS
- 2009-07-23 Listed $39,999 HARMLS
- 2006-08-29 Sold (Public Records) — Public Records
- 2006-06-28 Listing Removed — HARMLS
- 2006-06-01 Listed $12,990 HARMLS
- 1988-01-02 Sold (Public Records) — Public Records
Property tax history
+1.6%/yrLatest (2025): $5,698 · -1.7% YoY. Source: county tax records.
Cash-flow waterfall
monthlySold comps — $/sqft
last 12 mo · ≤1 miLoading sold comps…