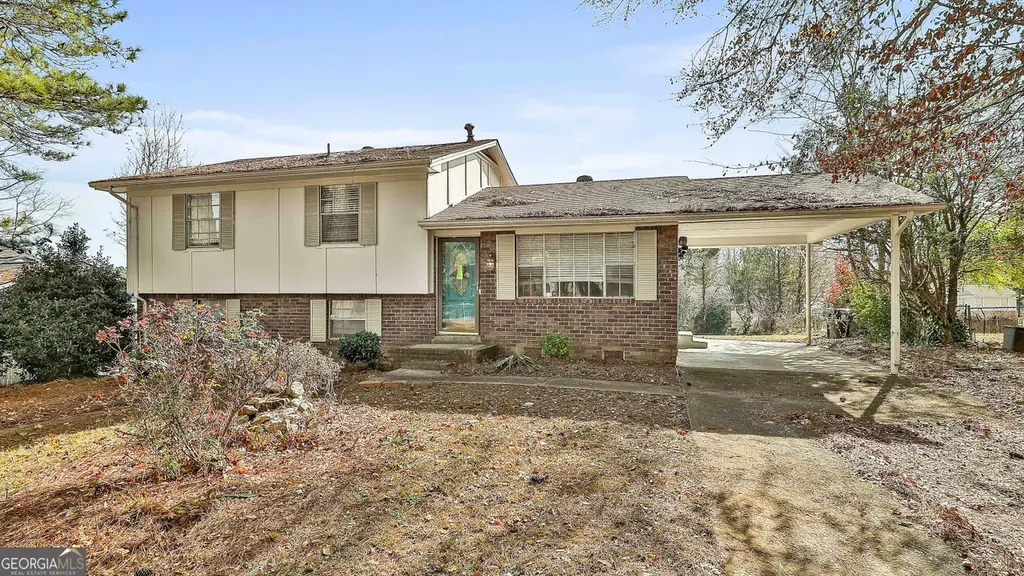
538 Wexwood Dr · Riverdale, GA
Flood risk 1/10 · Minimal
- FEMA flood zone
- X (unshaded)
- Chance of flooding over 30 yrs
- 0.0%
- Est. flood insurance / yr
- $507 – $1,088
Fire risk 3/10 · Minor
- Est. fire insurance / yr
- $963 – $1,789
Heat risk 6/10 · Moderate
- Hot days now (above 105°F)
- 7 days/yr
- Hot days in 30 yrs
- 18 days/yr
Wind risk 6/10 · Moderate
- Chance of severe wind over 30 yrs
- 27.0%
Air-quality risk 4/10 · Minor
- Unhealthy air days now
- 4 days/yr
- Unhealthy air days in 30 yrs
- 6 days/yr
Risk factors via First Street. Map © Google.
Why this score? — see what drove the C+ grade
The composite is a weighted blend of 9 inputs, each scored 0–100. Each bar is that input's sub-score; the figure is the points it added to the 100-point composite (weight × sub-score).
- Cash flow +22.7/30.0
- ARV discount +15.0/15.0
- DSCR +7.3/10.0
- 1% rule +6.5/10.0
- Livability +3.5/5.0
- Rent growth +2.8/5.0
- Condition / age +2.5/5.0
- Schools +1.3/10.0
- Appreciation +0.0/10.0
$155,000
🖨 Deal sheet (PDF) 📄 Offer letter ✓ Due diligence
Listing remarks
3-bedroom home featuring a functional layout with spacious living areas, this property is designed to accommodate a variety of lifestyles and needs. Inside, you'll find abundant natural light, well-sized bedrooms, and a kitchen with plenty of cabinet and counter space ready for your personal touch. The layout provides flexibility for everyday living, entertaining, or creating a space that fits your style. The outdoor area offers room for relaxing, gardening, or hosting gatherings. Conveniently located near shopping, dining, parks, schools, and major highways, this property provides easy access to local amenities and commuting routes. Whether you're looking for a primary residence or an inve
Key facts
- Outdoor area
- Functional layout
- 0.26 acre lot
Tags
Property features AI
Finance
- Other: Lot approximately 0.26 acres
- HOA & community: No HOA
Exterior
- Parking: Carport (1 parking space)
- Utilities: Public water; Public sewer; No additional utilities listed
- Home design: Single family residence; House structure; Resale property; Built in 1974
- Construction: Brick construction; Composition roof; Partial unfinished basement (foundation details not specified)
- Exterior features: No lot features listed
Interior
- Kitchen: No appliances listed
- Bedrooms: 3 bedrooms (all on the main level)
- Flooring: Other flooring
- Bathrooms: 2 bathrooms total (1 full, 1 half; main level has 1 bathroom)
- Heating & cooling: Natural gas heating; Central air conditioning; Other heating listed
- Interior features: Other interior features; Multi/split levels; Partial unfinished basement
- Laundry & utility: No laundry features listed
Neighborhood map
What this means for you Summary
Snapshot
- This is a 3-bed/2.0-bath single-family listed at $155k.
Deal economics
- At list price, monthly cash flow is $267 ($3k/yr) — positive.
- The deal already cash-flows at list — no discount required.
- Meets the 1% rule at list price ($2k rent vs $155k).
- Recommended offer: $153k (1.5% below list) — sets the bar for market timing.
- Cap rate 8.4% vs local median 5.5% in Riverdale — top-decile yield for the area; either an underpriced asset or a hidden risk that comps aren't pricing in. Stress-test before assuming the spread holds.
Location & tenants
- Location reads 70/100 on livability (#100 in GA) — a middle-class / working-renter tenant base. Strengths: cost of living A+, housing A+; Watch: crime D, amenities F, commute F.
- Clayton County (suburban): math 11% / reading 20% proficiency, ranked #155 of 174 in GA (top 89%) — low school quality limits family demand, transient renter base, plan for 1-2y turnover; 78% free/reduced lunch — lower-income household profile, screen leases tightly.
- Zoned schools: Pointe South Elementary School (math 5% / reading 17%, grade F, #1,071 of 1,228 statewide, top 88%, 531 students, 90% FRL); Pointe South Middle School (math 8% / reading 22%, grade F, #399 of 470 statewide, top 86%, 760 students, 90% FRL); Riverdale High School (math 12% / reading 17%, grade F, #315 of 424 statewide, top 76%, 1,333 students, 90% FRL).
- Market conditions: Rents rising (+1.3%/yr); 189 active listings in the ZIP; 40 comparable units currently listed for rent nearby; rentals at typical pace (median 21d on market — plan ~3-4 weeks tenant-placement turnaround); 865 units permitted in Clayton County in 2024 (448 in 5+ unit buildings).
- This rent runs 41% of the median local income ($52k/yr) — at the standard rent-burdened threshold; future hikes will face affordability resistance.
Forward outlook
- Local home prices are declining (-3.0%/yr); year-one equity from $1k of loan paydown is wiped out by about $5k of value loss. Plan a longer hold.
- Clayton County population projected at +29% by 2050 — long-run rental-demand tailwind backs the buy-and-hold thesis.
Negotiation context
- It's been on market 22 days — a 2% lower offer ($153k) is reasonable based on typical stale-listing flexibility.
- 8 sale attempts since 4y ago with the ask held roughly flat each time — persistent listings suggest the price (not the market) is what's stuck; bring a comps-based counter.
Risks & watch-outs
- Climate carrying-cost: major wind risk, 27% chance of damaging wind over 30y; extreme-heat days projected 7→18/yr by 2055 (HVAC capex compounding) — expect insurance premiums to compound above CPI over the hold.
Questions for the listing agent
- Built in 1974 — when were the roof, HVAC, electrical panel, plumbing, and water heater last replaced?
- Is there a deadline driving the sale (1031 exchange, divorce, estate, relocation)? That informs how much negotiation room exists.
- Schools are D-rated, which usually means shorter tenancies and higher turnover. Who's the typical renter profile here, and what's been the actual vacancy rate?
- Crime grade is D in this area — have there been break-ins, vandalism, or insurance claims at this property in the last 3 years? What carrier currently insures it and at what premium?
- What's the average days-on-market for RENTAL listings here right now (not sales)? A rising rental-DOM trend means longer vacancies and softer asking-rent achievability than the comps imply.
- What's the recent tenant-quality profile in this submarket — average credit score on applications, eviction rate, late-payment / NSF rate, and stable-employment percentage? A property-management company in the area should have these aggregated.
- How much new for-sale + rental construction is in the pipeline within 1–3 miles? Heavy new supply typically softens prices + rents 12–24 months out; constrained supply supports both.
Investment metrics
- 1% rule
- 1.15% ✓
- Cap rate
- 8.36%
- Cash-on-cash
- 7.38%
- DSCR
- 1.33
- GRM
- 7.3
CMA / ARV
- ARV (median comp)
- $225,086
- List price
- $155,000
- Delta
- -31.14%
- Verdict
- UNDERPRICED
- Comps
- 20 within 1.0 mi
Show comp detail 12 sales within ~0.75 mi
| Address | Dist | Beds/Ba | Sqft | Sold | Price | $/sf | Match |
|---|---|---|---|---|---|---|---|
| 530 Wexwood Dr | 0.01mi | 3/2.5 | 1,751 (+1%) | 5mo | $245,000 | $140 | 91 |
| 8521 Cedar Creek Rdg | 0.32mi | 3/2.0 | 1,776 (+3%) | 1mo | $128,000 | $72 | 79 |
| 8455 Cedar Creek Rdg | 0.17mi | 3/2.0 | 1,575 (-9%) | 2mo | $205,000 | $130 | 76 |
| 391 Park Ridge Cir | 0.52mi | 3/2.0 | 1,782 (+3%) | 3mo | $282,000 | $158 | 68 |
| 638 Wellington Way | 0.66mi | 3/2.0 | 1,692 (-2%) | 1mo | $65,000 | $38 | 65 |
| 339 Park Ridge Cir | 0.59mi | 3/2.0 | 1,782 (+3%) | 3mo | $250,000 | $140 | 64 |
| 8601 Cedar Creek Rdg | 0.42mi | 3/2.0 | 1,555 (-10%) | 2mo | $209,900 | $135 | 62 |
| 690 Trailwood Dr | 0.43mi | 4/3.0 (+1) | 1,839 (+6%) | 3mo | $271,350 | $148 | 57 |
| 408 Park Ridge Cir | 0.46mi | 3/2.0 | 1,525 (-12%) | 4mo | $237,500 | $156 | 56 |
| 764 Trailwood Dr | 0.53mi | 4/3.0 (+1) | 1,612 (-7%) | 1mo | $170,000 | $105 | 54 |
| 274 Park Ridge Ct | 0.54mi | 3/2.0 | 1,535 (-11%) | 3mo | $165,000 | $107 | 54 |
| 8303 Taylor Rd | 0.72mi | 3/3.0 | 1,876 (+9%) | 5mo | $227,000 | $121 | 44 |
Match score weights: distance 35% · size 25% · config 20% · recency 20%. Top-matched comps best support the ARV.
Projected returns pro-forma
-3.0% appreciation · 1.3% rent growth · sell at horizon
- IRR
- -7.0%
- Equity multiple
- 0.75×
- Total profit
- $-11,029
- Equity at exit
- $23,111
- IRR
- 0.3%
- Equity multiple
- 1.02×
- Total profit
- $725
- Equity at exit
- $13,402
Cash invested: $43,400 (down + closing). Projections, not guarantees.
Landlord ↔ Tenant lean methodology
- Overall (STATE)
- 90 Strongly Landlord-Friendly
- State Georgia
- 90 Strongly Landlord-Friendly · R+3
- County
- — inherits STATE
- City
- — inherits STATE
ZIP-level market 30274
- Home prices YoY
- -19.6%
- Rents YoY
- 1.3%
- Active inventory
- 189
- Price-to-rent
- 7.3×
Monthly cashflow live
- Estimated rent
- $1,775 high interval (Pro) →
- Mortgage (P&I)
- −$813
- Tax from tax record
- −$258 /mo · $3,091/yr
- Insurance
- −$65
- HOA
- −$0
- Vacancy / Maint / Mgmt
- −$373
- Net cashflow
- $267
Break-even live
Sensitivity live
| Price | -10% $355 | -5% $311 | +0% $267 | +5% $223 | +10% $179 |
|---|---|---|---|---|---|
| Rent | -10% $127 | -5% $197 | +0% $267 | +5% $337 | +10% $407 |
| Rate | -1.0pp $345 | -0.5pp $306 | base $267 | +0.5pp $227 | +1.0pp $186 |
UW: 25.0% down · 7.5% · 30yr · 1.5% tax · 5.0% vac · 8.0% maint · 8.0% mgmt
Financing live
Cash to close
- Down payment
- $38,750
- Closing costs
- $4,650
- Reserves months
- —
- Total cash needed
- —
Loan-product check · same deal, 3 products live
Conventional
25% down · 7.5% · 30yr
- Down + closing
- —
- Monthly P&I
- —
- Monthly cashflow
- —
- DSCR
- —
- Eligible?
- —
Personal DTI + credit; lowest rate.
DSCR
20% down · 8.5% · 30yr
- Down + closing
- —
- Monthly P&I
- —
- Monthly cashflow
- —
- DSCR
- —
- Eligible?
- —
No personal income docs; deal must DSCR.
Hard money
10% down · 12.0% · 12mo
- Down + closing
- —
- Monthly P&I
- —
- Monthly cashflow
- —
- DSCR
- —
- Eligible?
- —
Short-term bridge; refi at stabilization.
Rent comps 40 comps
| Address | Beds | Baths | Sqft | Rent | $/sqft | DOM | Units | Dist |
|---|---|---|---|---|---|---|---|---|
| 8443 Cedar Creek Rdg Riverdale, GA | 3.0 | 2.0 | 1476 | $1,735 | $1.18 | 20d | 1 | 0.18mi |
| 8406 Red Cedar Way Riverdale, GA | 3.0 | 2.0 | 2168 | $2,250 | $1.04 | 5d | 1 | 0.20mi |
| 693 Oak Dr Riverdale, GA | 4.0 | 2.5 | 1325 | $1,825 | $1.38 | 6d | 1 | 0.30mi |
| 426 Park Ridge Cir Riverdale, GA | 3.0 | 2.0 | 1578 | $1,773 | $1.12 | 44d | 1 | 0.39mi |
| 8609 Thomas Ln Riverdale, GA | 3.0 | 2.5 | 1530 | $1,658 | $1.08 | 25d | 1 | 0.41mi |
| 8612 Thomas Rd Riverdale, GA | 3.0 | 2.5 | 1532 | $1,623 | $1.06 | 44d | 1 | 0.41mi |
| 8630 Thomas Rd Riverdale, GA | 3.0 | 2.5 | 1530 | $1,500 | $0.98 | 25d | 1 | 0.45mi |
| 8631 Thomas Ln Riverdale, GA | 3.0 | 2.5 | 1530 | $1,673 | $1.09 | 23d | 1 | 0.45mi |
| 8600 Cedar Creek Rdg Riverdale, GA | 3.0 | 2.0 | 1555 | $1,745 | $1.12 | 6d | 1 | 0.46mi |
| 8640 Thomas Ln Riverdale, GA | 3.0 | 2.5 | 1530 | $1,673 | $1.09 | 25d | 1 | 0.47mi |
| 8644 Thomas Ln Riverdale, GA | 3.0 | 2.5 | 1530 | $1,623 | $1.06 | 44d | 1 | 0.48mi |
| 8641 Thomas Ln Riverdale, GA | 4.0 | 3.0 | 1540 | $1,863 | $1.21 | 6d | 1 | 0.48mi |
| 8643 Thomas Ln Riverdale, GA | 3.0 | 2.5 | 1530 | $1,818 | $1.19 | 25d | 1 | 0.48mi |
| 8614 Cedar Creek Rdg Riverdale, GA | 3.0 | 2.5 | 1728 | $1,500 | $0.87 | 44d | 1 | 0.49mi |
| 8669 Thomas Rd Riverdale, GA | 3.0 | 2.5 | 1532 | $1,623 | $1.06 | 44d | 1 | 0.52mi |
| 8584 Guthrie Dr Riverdale, GA | 3.0 | 2.0 | 1445 | $1,650 | $1.14 | 16d | 1 | 0.53mi |
| 8327 Glenwoods Ter Unit A Riverdale, GA | 3.0 | 1.0 | 2079 | $1,550 | $0.75 | 25d | 1 | 0.53mi |
| 634 Morton Ct Unit 636 Jonesboro, GA | 2.0 | 1.5 | 1050 | $1,225 | $1.17 | 44d | 1 | 0.56mi |
| 8078 Woodlake Dr Riverdale, GA | 2.0 | 2.5 | 1280 | $1,445 | $1.13 | 2d | 1 | 0.57mi |
| 8062 Creekstone Way Riverdale, GA | 2.0 | 2.5 | 1232 | $1,286 | $1.04 | 44d | 1 | 0.58mi |
| 227 Avalon Way Riverdale, GA | 4.0 | 2.0 | 1812 | $2,091 | $1.15 | 5d | 1 | 0.58mi |
| 8066 Woodlake Dr Riverdale, GA | 2.0 | 2.5 | 1280 | $1,505 | $1.18 | 4d | 1 | 0.60mi |
| 8104 Webb Rd Riverdale, GA | 1.0–2.0 | 1.0–2.0 | 890 | $1,549 | $1.74 | 2d | 18 | 0.61mi |
| 8195 Rhodes Way Riverdale, GA | 3.0 | 2.0 | 1546 | $2,090 | $1.35 | 25d | 1 | 0.66mi |
| 8183 Rhodes Way Riverdale, GA | 3.0 | 2.5 | 1650 | $1,945 | $1.18 | 20d | 1 | 0.66mi |
| 8588 Creekwood Way Jonesboro, GA | 3.0 | 1.5 | 1344 | $1,300 | $0.97 | 6d | 1 | 0.69mi |
| 8194 Canyon Forge Dr Riverdale, GA | 3.0 | 2.5 | 1488 | $1,555 | $1.05 | 5d | 1 | 0.70mi |
| 785 Redland Dr Jonesboro, GA | 4.0 | 2.0 | 1496 | $1,935 | $1.29 | 13d | 1 | 0.70mi |
| 801 Redland Dr Jonesboro, GA | 3.0 | 2.0 | 1370 | $1,725 | $1.26 | 13d | 1 | 0.74mi |
| 801 Redland Dr Jonesboro, GA | 3.0 | 2.0 | 1370 | $1,750 | $1.28 | 44d | 1 | 0.74mi |
| 100 Chase Ridge Dr Riverdale, GA | 2.0 | 2.0 | 1175 | $1,545 | $1.31 | 44d | 1 | 0.75mi |
| 100 Chase Ridge Dr Riverdale, GA | 1.0–2.0 | 1.0–2.0 | 1002 | $1,545 | $1.54 | 6d | 6 | 0.75mi |
| 8226 Canyon Forge Dr Riverdale, GA | 3.0 | 2.5 | 1512 | $1,631 | $1.08 | 13d | 1 | 0.75mi |
| 8238 Canyon Forge Dr Riverdale, GA | 2.0 | 2.5 | 1246 | $1,400 | $1.12 | 5d | 1 | 0.77mi |
| 8050 Taylor Rd Riverdale, GA | 1.0–3.0 | 1.0–2.0 | 944 | $1,315 | $1.39 | 2d | 12 | 0.77mi |
| 779 Edenton Ct Jonesboro, GA | 3.0 | 2.5 | 2165 | $1,700 | $0.79 | 20d | 1 | 0.79mi |
| 561 Chatham Trl Jonesboro, GA | 4.0 | 2.5 | 2142 | $2,275 | $1.06 | 23d | 1 | 0.80mi |
| 100 Chase Ridge Dr Unit 1005 Riverdale, GA | 2.0 | 2.0 | 1175 | $1,395 | $1.19 | 44d | 1 | 0.84mi |
| 102 Palisades Pointe Riverdale, GA | 2.0 | 2.5 | 1224 | $1,673 | $1.37 | 5d | 1 | 0.84mi |
| 772 Pointe South Pkwy Jonesboro, GA | 3.0 | 2.5 | 1202 | $1,384 | $1.15 | 44d | 1 | 0.86mi |
Listing history 37 events
-
2026-06-15status $155,000 Under Contract 22 DOM
-
2026-06-13statusdays on market $155,000 Pending Offer Approval 22 DOM
-
2026-06-09days on market $155,000 Active 21 DOM
-
2026-06-08days on market $155,000 Active 20 DOM
-
2026-06-07days on market $155,000 Active 19 DOM
-
2026-06-04days on market $155,000 Active 16 DOM
-
2026-06-03days on market $155,000 Active 15 DOM
-
2026-06-02days on market $155,000 Active 14 DOM
-
2026-06-01days on market $155,000 Active 13 DOM
-
2026-05-31days on market $155,000 Active 12 DOM
-
2026-05-12$155,000 New 794-char remark
-
2024-10-08historical
-
2024-06-11price $250,000
-
2024-06-11price $250,000
-
2024-05-03$265,000 New
-
2023-02-28soldstatus $200,000
-
2023-02-21soldstatus $200,000 Sold
-
2023-02-21soldstatus $200,000 Closed
-
2023-02-01status Under Contract
-
2023-02-01status Pending
-
2023-02-01status Back On Market
-
2023-01-26status Under Contract
-
2023-01-26historical Active Under Contract
-
2023-01-20status Price Change
-
2023-01-20status Active
-
2023-01-20price $200,000
-
2023-01-20price $200,000
-
2023-01-17price $215,000
-
2023-01-16status Under Contract
-
2023-01-16historical Active Under Contract
-
2023-01-16price $215,000
-
2023-01-14price $200,000
-
2023-01-14price $200,000
-
2022-12-06$215,000 New
-
2022-12-06$215,000 Active
-
1997-02-04soldstatus $69,000
-
1980-03-27soldstatus $40,200
ⓘ Source: listings_history table (triggers on properties + properties_extension) + one-shot
backfill from property_details.listing_events for pre-trigger history.
Tax reassessment forecast GA · Resets to sale price
- Current annual tax
- $3,091 · $258/mo
- Projected year-2 tax
- $3,091 · $258/mo
- Expected delta
- $0/yr ($0/mo · 0.0%)
ⓘ Screening estimate from a state-policy table — verify with the county assessor before closing.
Climate risk First Street
- Flood 1/10 Low FEMA zone X (unshaded) · 0% chance over 30 yrs
- Wildfire 3/10 Moderate
- Heat 6/10 Major 7 d/yr ≥105°F today · 18 d/yr by 30 yrs out
- Wind 6/10 Major 27% chance of damaging wind over 30 yrs
- Air quality 4/10 Moderate 4 unhealthy d/yr today · 6 by 30 yrs out
Nearby sold comps map
Loading sold comps map…
Walkable amenities ~0.75 mi
Loading nearby amenities…
Taxation est. · year 1
- Rental income
- $21,297
- − Mortgage interest
- −$8,682
- − Property taxes
- −$3,091
- − Insurance
- −$775
- − Repairs & maintenance
- −$1,704
- − Management
- −$1,704
- − Depreciation
- −$4,509
- Taxable income
- $832
- Est. tax owed @ 24.0%
- −$200
- After-tax cash flow
- $3,005/yr
For passive investors: Depreciation is non-cash, so a rental often shows a tax loss while cash-flowing — sheltering income. Rental losses are passive: they offset passive income freely, and up to $25,000/yr can offset ordinary (W-2) income if you actively participate and your MAGI is under $100k (phasing out to $0 by $150k); unused losses carry forward. On sale, claimed depreciation is recaptured at up to 25%, and gains may owe capital-gains tax (a 1031 exchange can defer both). Figures are a year-1 estimate at your 24.0% rate — not tax advice; consult a CPA.
Schools (NCES district)
- District
- Clayton County
- NCES district ID
- 1301230
- Math proficiency
- 11% ▼ -13.00%
- Reading proficiency
- 20% ▼ -9.00%
- Median HH income
- $42,266
- Composite
- 13.41/100
- National rank
- #9527
- State rank
- #155 of 174 in GA
Livability — Riverdale
- Score
- 70/100
- State rank
- #100
- US rank
- #7907
Category grades
Schools grade is shown separately in the Schools card above.
Census & demographics
- County
- Clayton County · 230,153 people
- City population
- 61,126
- Metro
- Atlanta-Sandy Springs-Alpharetta, GA
- Population (ZIP)
- 34,081
- Household income
- $52,209
- Rent vs Own
- Severe rent burden
- 2586.0
Population outlook (Clayton County) Hauer SSP2
- Today (2025)
- 310,777 people
- By 2030
- 329,762 · +6.1%
- By 2040
- 368,052 · +18.4%
- By 2050
- 401,196 · +29.1%
- By 2075
- 472,488 · +52.0%
- By 2100
- 500,446 · +61.0%
Race, ethnicity, and origin ACS 2023
- Neighborhood character
- Predominantly Black (76%)
- Race & ethnicity
- Black 76% Hispanic / Latino 14% Two or more races 5% Asian 5% White 5%
- Hispanic origin (detail)
- Mexican 9% Puerto Rican 1%
- Foreign-born
- 15% · Canada, Vietnam
- Languages at home
- 80% English-only · Spanish 12% Vietnamese 2% Other Asian/Pacific 2%
Political lean MEDSL · Clayton
- 2024 margin
- Solid D (+69.2) · D 84.3% · R 15.1%
- 2008→2024 swing
- +2.8pp toward D · 2008: 66.4pp · 2024: 69.2pp
- All cycles
- 2024: D+69.2 2020: D+70.9 2016: D+71.9 2012: D+70.1 2008: D+66.4
Not yet ingested
- Civics
- —
Market trends
- HPI YoY
- ▼ -57.82%
- Current HPI
- 236.3592
- Rent YoY
- ▲ 1.30%
- Metro
- Atlanta-Sandy Springs-Alpharetta, GA
- State GDP YoY
- ▲ 2.66%
- F500 in state
- 28
Industry mix (Fortune 500 HQ in GA)
| Industry | F500 HQs | Revenue |
|---|---|---|
| Paper / Packaging | 2 | $29B |
|
||
| Retail | 1 | $160B |
|
||
| Transportation / Logistics | 1 | $91B |
|
||
| Airlines | 1 | $62B |
|
||
| Consumer Goods | 1 | $47B |
|
||
| Utilities | 1 | $25B |
|
||
Price history
+285.6% since first listed31 events — show timeline
- 2026-06-14 Pending — GAMLS
- 2026-06-10 Pending — GAMLS
- 2026-05-27 Relisted — GAMLS
- 2026-05-21 Pending — GAMLS
- 2026-05-12 Listed $155,000 GAMLS
- 2024-10-08 Listing Removed — GAMLS
- 2024-06-11 Price Changed $250,000 GAMLS
- 2024-06-11 Price Changed $250,000 FMLS
- 2024-05-03 Listed $265,000 GAMLS
- 2023-02-28 Sold (Public Records) $200,000 Public Records
- 2023-02-21 Sold (MLS) $200,000 GAMLS
- 2023-02-21 Sold (MLS) $200,000 FMLS
- 2023-02-01 Pending — GAMLS
- 2023-02-01 Pending — FMLS
- 2023-02-01 Relisted — GAMLS
- 2023-01-26 Pending — GAMLS
- 2023-01-26 Contingent — FMLS
- 2023-01-20 Relisted — GAMLS
- 2023-01-20 Relisted — FMLS
- 2023-01-20 Price Changed $200,000 GAMLS
- 2023-01-20 Price Changed $200,000 FMLS
- 2023-01-17 Price Changed $215,000 FMLS
- 2023-01-16 Pending — GAMLS
- 2023-01-16 Contingent — FMLS
- 2023-01-16 Price Changed $215,000 GAMLS
- 2023-01-14 Price Changed $200,000 FMLS
- 2023-01-14 Price Changed $200,000 GAMLS
- 2022-12-06 Listed $215,000 GAMLS
- 2022-12-06 Listed $215,000 FMLS
- 1997-02-04 Sold (Public Records) $69,000 Public Records
- 1980-03-27 Sold (Public Records) $40,200 Public Records
Property tax history
+7.6%/yrLatest (2025): $3,091 · -0.5% YoY. Source: county tax records.
Cash-flow waterfall
monthlySold comps — $/sqft
last 12 mo · ≤1 miLoading sold comps…