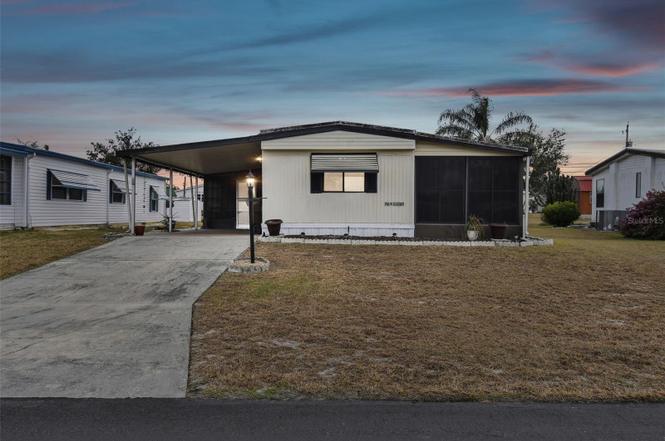
313 Monroe Dr · Lakeland, FL
Flood risk 1/10 · Minimal
- FEMA flood zone
- X (unshaded)
- Chance of flooding over 30 yrs
- 0.0%
- Est. flood insurance / yr
- $507 – $1,088
Fire risk 5/10 · Moderate
- Est. fire insurance / yr
- $947 – $1,759
Heat risk 8/10 · Major
- Hot days now (above 108°F)
- 7 days/yr
- Hot days in 30 yrs
- 23 days/yr
Wind risk 9/10 · Severe
- Chance of severe wind over 30 yrs
- 99.0%
Air-quality risk 2/10 · Minimal
- Unhealthy air days now
- 1 days/yr
- Unhealthy air days in 30 yrs
- 1 days/yr
Risk factors via First Street. Map © Google.
Why this score? — see what drove the B- grade
The composite is a weighted blend of 9 inputs, each scored 0–100. Each bar is that input's sub-score; the figure is the points it added to the 100-point composite (weight × sub-score).
- Cash flow +30.0/30.0
- 1% rule +10.0/10.0
- DSCR +10.0/10.0
- ARV discount +7.5/15.0
- Livability +3.9/5.0
- Schools +3.5/10.0
- Rent growth +2.7/5.0
- Condition / age +2.5/5.0
- Appreciation +0.0/10.0
$69,900
🖨 Deal sheet 📄 Offer letter ✓ Due diligence
Listing remarks
Check out this 2 bedroom 2 bathroom manufactured home located in North Lakeland's Martin Estates. This home spans over 868 Sq ft with a nice yard, extra outside rooms, and storage shed in the back of the property. It is located within a 55+ mobile home community that features a clubhouse and pool. NO LOT RENT! HOA only 46/mo This is a CO-OP. AC is 8-9 yrs old Roof was installed 2017. Buyer Approval is required.
Key facts
- Clubhouse
- Manufactured home
- Extra outside rooms
Tags
Property features AI
Finance
- Other: Association required; Unfurnished
- Financial info: Total monthly fees: $46; Total annual fees: $552
- HOA & community: Monthly HOA fee of $46; HOA includes pool and recreational facilities; Community clubhouse and pool; Senior community; Pets allowed with number and size limits (max 25 lbs)
Exterior
- Parking: Driveway; Carport (1 space)
- Security: Smoke detector(s)
- Utilities: Public water; Septic tank; Electricity connected; Water connected
- Home design: Manufactured home (single wide); One level; Faces east
- Construction: Metal siding; Other roof; Crawlspace foundation; Completed condition
- Exterior features: Front porch; Rear porch; Screened porch; Sliding doors; Shed(s) / storage; Mature landscaping; Paved road access; In county location
Interior
- Kitchen: Cooktop; Range hood; Dishwasher; Refrigerator
- Bedrooms: 2 bedrooms
- Flooring: Carpet; Laminate; Linoleum
- Bathrooms: 2 full bathrooms
- Heating & cooling: Central heating; Central air
- Interior features: Ceiling fans; Eat-in kitchen; Kitchen/family room combo; Living room/dining room combo; Thermostat; Blinds
- Laundry & utility: Laundry room (outside); Electric water heater; Washer; Dryer
Neighborhood map
What this means for you Summary
Snapshot
- This is a 2-bed/2.0-bath manufactured listed at $70k.
Deal economics
- At list price, monthly cash flow is $626 ($8k/yr) — positive.
- The deal already cash-flows at list — no discount required.
- Meets the 1% rule at list price ($1k rent vs $70k).
Location & tenants
- Location reads 77/100 on livability (#206 in FL, #3,179 nationally) — a middle-class / working-renter tenant base. Strengths: cost of living A+, housing A+, health & safety A+; Watch: employment D+, amenities F, commute F.
- Polk (suburban): math 39% / reading 43% proficiency, ranked #62 of 73 in FL (top 85%) — families likely to look elsewhere, expect single-tenant / working-renter base with shorter leases.
- Market conditions: Rents flat; 259 active listings in the ZIP; 8 comparable units currently listed for rent nearby; rentals at typical pace (median 24d on market — plan ~3-4 weeks tenant-placement turnaround); 10,384 units permitted in Polk County in 2024 (1,716 in 5+ unit buildings).
Forward outlook
- Local home prices are declining (-3.0%/yr); year-one equity from $483 of loan paydown is wiped out by about $2k of value loss. Plan a longer hold.
- Polk County population projected at +33% by 2050 — long-run rental-demand tailwind backs the buy-and-hold thesis.
- At projected returns (-3.0% appreciation + 0.7% rent growth), your $20k cash investment doubles in ~4 years — after that, you're playing with house money.
Negotiation context
- Only 3 days on market — expect competitive offers; lowballing is unlikely to land.
- 3 sale attempts with the ask held roughly flat each time — persistent listings suggest the price (not the market) is what's stuck; bring a comps-based counter.
- Current owner paid $35k; list at $70k implies a 100% gain — meaningful room to come down on a strong offer.
Risks & watch-outs
- Climate carrying-cost: severe wind risk, 99% chance of damaging wind over 30y; moderate wildfire risk; extreme-heat days projected 7→23/yr by 2055 (HVAC capex compounding) — expect insurance premiums to compound above CPI over the hold.
Questions for the listing agent
- What does the HOA fee cover, when was the last increase, and are there any pending special assessments or reserve-fund shortfalls?
- Is there a deadline driving the sale (1031 exchange, divorce, estate, relocation)? That informs how much negotiation room exists.
- What's the average days-on-market for RENTAL listings here right now (not sales)? A rising rental-DOM trend means longer vacancies and softer asking-rent achievability than the comps imply.
- What's the recent tenant-quality profile in this submarket — average credit score on applications, eviction rate, late-payment / NSF rate, and stable-employment percentage? A property-management company in the area should have these aggregated.
- How much new for-sale + rental construction is in the pipeline within 1–3 miles? Heavy new supply typically softens prices + rents 12–24 months out; constrained supply supports both.
Investment metrics
- 1% rule
- 2.11% ✓
- Cap rate
- 17.04%
- Cash-on-cash
- 38.36%
- DSCR
- 2.71
- GRM
- 4.0
CMA / ARV
No comps found within radius.
Projected returns pro-forma
-3.0% appreciation · 0.65% rent growth · sell at horizon
- IRR
- 31.7%
- Equity multiple
- 2.29×
- Total profit
- $25,180
- Equity at exit
- $10,422
- IRR
- 37.4%
- Equity multiple
- 4.07×
- Total profit
- $60,152
- Equity at exit
- $6,044
Cash invested: $19,572 (down + closing). Projections, not guarantees.
Landlord ↔ Tenant lean methodology
- Overall (STATE)
- 87 Strongly Landlord-Friendly
- State Florida
- 87 Strongly Landlord-Friendly · R+3
- County
- — inherits STATE
- City
- — inherits STATE
ZIP-level market 33809
- Home prices YoY
- -20.9%
- Rents YoY
- 0.7%
- Active inventory
- 259
- Price-to-rent
- 4.0×
Monthly cashflow live
- Estimated rent
- $1,472 high interval (Pro) →
- Mortgage (P&I)
- −$367
- Tax from tax record
- −$96 /mo · $1,150/yr
- Insurance
- −$29
- HOA
- −$46
- Vacancy / Maint / Mgmt
- −$309
- Net cashflow
- $626
Break-even live
UW: 25.0% down · 7.5% · 30yr · 1.5% tax · 5.0% vac · 8.0% maint · 8.0% mgmt
Financing live
Cash to close
- Down payment
- $17,475
- Closing costs
- $2,097
- Reserves months
- —
- Total cash needed
- —
Loan-product check · same deal, 3 products live
Conventional
25% down · 7.5% · 30yr
- Down + closing
- —
- Monthly P&I
- —
- Monthly cashflow
- —
- DSCR
- —
- Eligible?
- —
Personal DTI + credit; lowest rate.
DSCR
20% down · 8.5% · 30yr
- Down + closing
- —
- Monthly P&I
- —
- Monthly cashflow
- —
- DSCR
- —
- Eligible?
- —
No personal income docs; deal must DSCR.
Hard money
10% down · 12.0% · 12mo
- Down + closing
- —
- Monthly P&I
- —
- Monthly cashflow
- —
- DSCR
- —
- Eligible?
- —
Short-term bridge; refi at stabilization.
Rent comps 8 comps
| Address | Beds | Baths | Sqft | Rent | $/sqft | DOM | Units | Dist |
|---|---|---|---|---|---|---|---|---|
| 239 Village Crest Ct Lakeland, FL | 2.0 | 2.0 | 912 | $1,495 | $1.64 | 23d | 1 | 1.13mi |
| 114 Rosalynn Cir Lakeland, FL | 2.0 | 2.0 | 1033 | $1,450 | $1.40 | 23d | 1 | 1.15mi |
| 124 Rosalynn Cir Lakeland, FL | 2.0 | 2.0 | 1033 | $1,550 | $1.50 | 3d | 1 | 1.15mi |
| 259 Village View Ln Lakeland, FL | 2.0 | 2.0 | 885 | $1,600 | $1.81 | 23d | 1 | 1.18mi |
| 235 Leelon Rd Lakeland, FL | 2.0 | 1.0 | 921 | $1,295 | $1.41 | 23d | 1 | 1.27mi |
| 165 Shannon Dr Lakeland, FL | 2.0 | 2.0 | 1008 | $1,350 | $1.34 | 3d | 1 | 1.35mi |
| 6031 Crafton Dr Lakeland, FL | 2.0 | 1.0 | 914 | $1,125 | $1.23 | 14d | 1 | 1.42mi |
| 6032 Norton Rd Unit 6032 Lakeland, FL | 2.0 | 2.0 | 880 | $1,295 | $1.47 | 23d | 1 | 1.49mi |
HOA detail
- Monthly dues
- $46 · $552/yr
- Likely covers
- pool
Listing history 4 events
-
2026-06-18days on market $69,900 Active 3 DOM
-
2026-06-17days on market $69,900 Active 2 DOM
-
2026-06-15remarks 414-char remark
-
2026-06-15$69,900 Active 1 DOM
ⓘ Source: listings_history table (triggers on properties + properties_extension) + one-shot
backfill from property_details.listing_events for pre-trigger history.
Tax reassessment forecast FL · Resets to sale price
- Current annual tax
- $1,150 · $96/mo
- Projected year-2 tax
- $1,150 · $96/mo
- Expected delta
- $0/yr ($0/mo · 0.0%)
ⓘ Screening estimate from a state-policy table — verify with the county assessor before closing.
Climate risk First Street
- Flood 1/10 Low FEMA zone X (unshaded) · 0% chance over 30 yrs
- Wildfire 5/10 Major
- Heat 8/10 Severe 7 d/yr ≥108°F today · 23 d/yr by 30 yrs out
- Wind 9/10 Extreme 99% chance of damaging wind over 30 yrs
- Air quality 2/10 Low 1 unhealthy d/yr today · 1 by 30 yrs out
Nearby sold comps map
Loading sold comps map…
Walkable amenities ~0.75 mi
Loading nearby amenities…
Taxation est. · year 1
- Rental income
- $17,670
- − Mortgage interest
- −$3,915
- − Property taxes
- −$1,150
- − Insurance
- −$350
- − Repairs & maintenance
- −$1,414
- − Management
- −$1,414
- − HOA
- −$552
- − Depreciation
- −$2,033
- Taxable income
- $6,842
- Est. tax owed @ 24.0%
- −$1,642
- After-tax cash flow
- $5,867/yr
For passive investors: Depreciation is non-cash, so a rental often shows a tax loss while cash-flowing — sheltering income. Rental losses are passive: they offset passive income freely, and up to $25,000/yr can offset ordinary (W-2) income if you actively participate and your MAGI is under $100k (phasing out to $0 by $150k); unused losses carry forward. On sale, claimed depreciation is recaptured at up to 25%, and gains may owe capital-gains tax (a 1031 exchange can defer both). Figures are a year-1 estimate at your 24.0% rate — not tax advice; consult a CPA.
Schools (NCES district)
- District
- Polk
- NCES district ID
- 1201590
- Math proficiency
- 39% ▼ -11.00%
- Reading proficiency
- 43% ▼ -4.00%
- Median HH income
- $43,979
- Composite
- 34.74/100
- National rank
- #5132
- State rank
- #62 of 73 in FL
Livability — Lakeland
- Score
- 77/100
- State rank
- #206
- US rank
- #3179
Category grades
Schools grade is shown separately in the Schools card above.
Census & demographics
- County
- Polk County · 740,051 people
- City population
- 277,690
- Metro
- Lakeland-Winter Haven, FL
- Population (ZIP)
- 30,797
- Household income
- $70,066
- Rent vs Own
- Severe rent burden
- 924.0
Population outlook (Polk County) Hauer SSP2
- Today (2025)
- 752,975 people
- By 2030
- 804,621 · +6.9%
- By 2040
- 906,117 · +20.3%
- By 2050
- 1,000,476 · +32.9%
- By 2075
- 1,197,520 · +59.0%
- By 2100
- 1,271,518 · +68.9%
Race, ethnicity, and origin ACS 2023
- Neighborhood character
- Diverse neighborhood (Simpson 0.55)
- Race & ethnicity
- White 63% Hispanic / Latino 18% Black 11% Two or more races 11% Asian 3%
- Hispanic origin (detail)
- Puerto Rican 9% Cuban 1% Dominican 2%
- Common ancestry
- Lithuanian 2% Italian 2% Romanian 2%
- Foreign-born
- 11% · Canada, Jamaica
- Languages at home
- 81% English-only · Spanish 15% Other Asian/Pacific 2% Other Indo-European 1%
Political lean MEDSL · Polk
- 2024 margin
- Strong R (+20.7) · D 39.2% · R 59.9%
- 2008→2024 swing
- -14.6pp toward R · 2008: -6.1pp · 2024: -20.7pp
- All cycles
- 2024: R+20.7 2020: R+14.4 2016: R+14.1 2012: R+6.8 2008: R+6.1
Not yet ingested
- Civics
- —
Market trends
- HPI YoY
- ▼ -79.46%
- Current HPI
- 301.3054
- Rent YoY
- ▲ 0.65%
- Metro
- Lakeland-Winter Haven, FL
- State GDP YoY
- ▲ 3.28%
- F500 in state
- 36
Industry mix (Fortune 500 HQ in FL)
| Industry | F500 HQs | Revenue |
|---|---|---|
| Industrial Technology | 2 | $29B |
|
||
| Insurance | 2 | $17B |
|
||
| Retail | 1 | $60B |
|
||
| Technology Distribution | 1 | $58B |
|
||
| Homebuilding | 1 | $35B |
|
||
| Technology Manufacturing | 1 | $35B |
|
||
Price history
+99.7% since first listed10 events — show timeline
- 2026-06-15 Listed $69,900 Stellar MLS as Distributed by MLS Grid
- 2026-03-03 Listing Removed — Stellar MLS as Distributed by MLS Grid
- 2025-12-18 Price Changed $83,000 Stellar MLS as Distributed by MLS Grid
- 2025-11-07 Price Changed $93,000 Stellar MLS as Distributed by MLS Grid
- 2025-05-24 Relisted — Stellar MLS as Distributed by MLS Grid
- 2025-05-17 Pending — Stellar MLS as Distributed by MLS Grid
- 2025-04-15 Price Changed $99,000 Stellar MLS as Distributed by MLS Grid
- 2025-03-17 Price Changed $109,000 Stellar MLS as Distributed by MLS Grid
- 2025-01-31 Listed $119,000 Stellar MLS as Distributed by MLS Grid
- 2009-04-06 Sold (Public Records) $35,000 Public Records
Property tax history
+6.3%/yrLatest (2025): $1,150 · +300.2% YoY. Source: county tax records.
Cash-flow waterfall
monthlySold comps — $/sqft
last 12 mo · ≤1 miLoading sold comps…