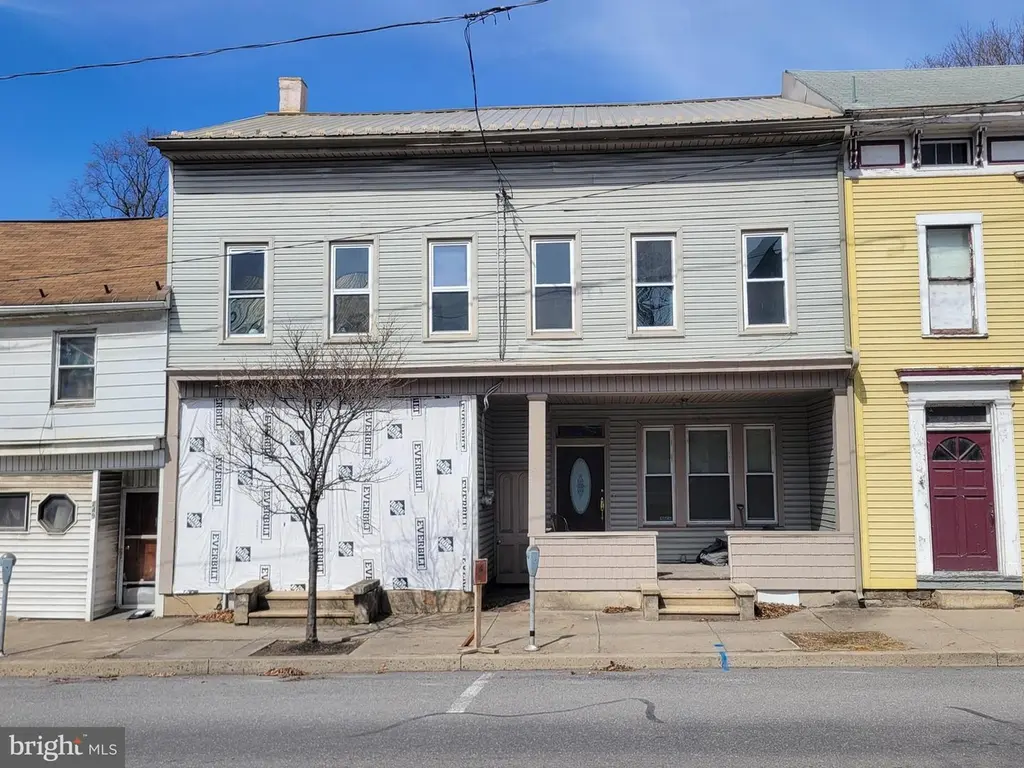
255 Union St · Millersburg, PA
Flood risk No data
- FEMA flood zone
- —
- Chance of flooding over 30 yrs
- —
- Est. flood insurance / yr
- —
Fire risk No data
- Est. fire insurance / yr
- —
Heat risk No data
- Hot days now (above threshold)
- —
- Hot days in 30 yrs
- —
Wind risk No data
- Chance of severe wind over 30 yrs
- —
Air-quality risk No data
- Unhealthy air days now
- —
- Unhealthy air days in 30 yrs
- —
Risk factors via First Street. Map © Google.
Why this score? — see what drove the B+ grade
The composite is a weighted blend of 9 inputs, each scored 0–100. Each bar is that input's sub-score; the figure is the points it added to the 100-point composite (weight × sub-score).
- Cash flow +28.1/30.0
- ARV discount +15.0/15.0
- DSCR +10.0/10.0
- 1% rule +7.7/10.0
- Appreciation +5.6/10.0
- Schools +3.7/10.0
- Livability +3.7/5.0
- Rent growth +2.5/5.0
- Condition / age +1.5/5.0
$119,900
🖨 Deal sheet 📄 Offer letter ✓ Due diligence
Listing remarks MLS
Attention flippers. .. this 3,076 sf property not only has a 4 bedroom, 1 bath home, but a separate commercial space that has the potential to be converted into a 1 bedroom, 1 bath rental. Home has new mini splits that were installed throughout. However, the property does need quite a bit of work to get it to where it needs to be. ARV is somewhere around $250-270K. Property does have a backyard and a driveway with 2 parking spots.
Key facts
- 2 parking spots
- Driveway
- Backyard
Tags
Neighborhood map
What this means for you Summary
Snapshot
- This is a 4-bed/1.0-bath single-family listed at $120k. Condition is rated poor.
Deal economics
- At list price, monthly cash flow is $375 ($5k/yr) — positive.
- The deal already cash-flows at list — no discount required.
- Meets the 1% rule at list price ($2k rent vs $120k).
- Recommended offer: $113k (6.0% below list) — sets the bar for market timing.
Location & tenants
- Location reads 74/100 on livability (#480 in PA, #4,444 nationally) — a middle-class / working-renter tenant base. Strengths: crime A+, cost of living A+, housing A+; Watch: amenities F, commute F.
- Millersburg Area SD (town): math 36% / reading 51% proficiency, ranked #288 of 539 in PA (top 53%) — families likely to look elsewhere, expect single-tenant / working-renter base with shorter leases.
- Market conditions: 32 active listings in the ZIP; 540 units permitted in Dauphin County in 2024 (194 in 5+ unit buildings).
Forward outlook
- In year one you build about $2k of equity ($829 loan paydown + $1k appreciation (1.2% local appreciation)).
- At projected returns (1.2% appreciation + 3.0% rent growth), your $34k cash investment doubles in ~5 years — after that, you're playing with house money.
Negotiation context
- It's been on market 88 days — a 6% lower offer ($113k) is reasonable based on typical stale-listing flexibility.
Risks & watch-outs
- Watch-outs: built in 1900 — expect roof / HVAC / electrical / plumbing capex.
Questions for the listing agent
- It's been on market 88 days. Have you received any prior offers? Is the seller open to a 6% concession, seller financing, or rate buy-down credit?
- Have any recent inspections been done? Can we get a copy of the seller's disclosures and any deferred-maintenance estimates?
- Built in 1900 — when were the roof, HVAC, electrical panel, plumbing, and water heater last replaced?
- Why hasn't it sold? Are there any deal-killer items the seller is aware of (foundation, flood, title, zoning, code violations)?
- Is there a deadline driving the sale (1031 exchange, divorce, estate, relocation)? That informs how much negotiation room exists.
- What's the average days-on-market for RENTAL listings here right now (not sales)? A rising rental-DOM trend means longer vacancies and softer asking-rent achievability than the comps imply.
- What's the recent tenant-quality profile in this submarket — average credit score on applications, eviction rate, late-payment / NSF rate, and stable-employment percentage? A property-management company in the area should have these aggregated.
- How much new for-sale + rental construction is in the pipeline within 1–3 miles? Heavy new supply typically softens prices + rents 12–24 months out; constrained supply supports both.
Investment metrics
- 1% rule
- 1.27% ✓
- Cap rate
- 10.05%
- Cash-on-cash
- 13.42%
- DSCR
- 1.60
- GRM
- 6.6
CMA / ARV
- ARV (median comp)
- $210,968
- List price
- $119,900
- Delta
- -43.17%
- Verdict
- UNDERPRICED
- Comps
- 16 within 1.0 mi
Projected returns pro-forma
1.2% appreciation · 3.0% rent growth · sell at horizon
- IRR
- 15.8%
- Equity multiple
- 1.82×
- Total profit
- $27,381
- Equity at exit
- $42,211
- IRR
- 19.0%
- Equity multiple
- 3.35×
- Total profit
- $78,738
- Equity at exit
- $57,097
Cash invested: $33,572 (down + closing). Projections, not guarantees.
Landlord ↔ Tenant lean methodology
- Overall (STATE)
- 62 Landlord-Friendly
- State Pennsylvania
- 62 Landlord-Friendly · EVEN
- County
- — inherits STATE
- City
- — inherits STATE
ZIP-level market 17061
- Home prices YoY
- 0.4%
- Active inventory
- 32
- Price-to-rent
- 6.6×
Monthly cashflow live
- Estimated rent
- $1,524 medium interval (Pro) →
- Mortgage (P&I)
- −$629
- Tax est. 1.5%
- −$150 /mo · $1,798/yr
- Insurance
- −$50
- HOA
- −$0
- Vacancy / Maint / Mgmt
- −$320
- Net cashflow
- $375
Break-even live
UW: 25.0% down · 7.5% · 30yr · 1.5% tax · 5.0% vac · 8.0% maint · 8.0% mgmt
Financing live
Cash to close
- Down payment
- $29,975
- Closing costs
- $3,597
- Reserves months
- —
- Total cash needed
- —
Loan-product check · same deal, 3 products live
Conventional
25% down · 7.5% · 30yr
- Down + closing
- —
- Monthly P&I
- —
- Monthly cashflow
- —
- DSCR
- —
- Eligible?
- —
Personal DTI + credit; lowest rate.
DSCR
20% down · 8.5% · 30yr
- Down + closing
- —
- Monthly P&I
- —
- Monthly cashflow
- —
- DSCR
- —
- Eligible?
- —
No personal income docs; deal must DSCR.
Hard money
10% down · 12.0% · 12mo
- Down + closing
- —
- Monthly P&I
- —
- Monthly cashflow
- —
- DSCR
- —
- Eligible?
- —
Short-term bridge; refi at stabilization.
Listing history 15 events
-
2026-06-18days on market $119,900 Active 88 DOM
-
2026-06-17days on market $119,900 Active 87 DOM
-
2026-06-16days on market $119,900 Active 86 DOM
-
2026-06-15days on market $119,900 Active 85 DOM
-
2026-06-13days on market $119,900 Active 83 DOM
-
2026-06-12days on market $119,900 Active 82 DOM
-
2026-06-09days on market $119,900 Active 79 DOM
-
2026-06-08days on market $119,900 Active 78 DOM
-
2026-06-08days on market $119,900 Active 77 DOM
-
2026-06-07days on market $119,900 Active 76 DOM
-
2026-06-04days on market $119,900 Active 73 DOM
-
2026-06-02days on market $119,900 Active 72 DOM
-
2026-06-01days on market $119,900 Active 71 DOM
-
2026-05-31days on market $119,900 Active 70 DOM
-
2026-03-22$119,900 Active 434-char remark
Show marketing remark (434 chars)
Attention flippers. .. this 3,076 sf property not only has a 4 bedroom, 1 bath home, but a separate commercial space that has the potential to be converted into a 1 bedroom, 1 bath rental. Home has new mini splits that were installed throughout. However, the property does need quite a bit of work to get it to where it needs to be. ARV is somewhere around $250-270K. Property does have a backyard and a driveway with 2 parking spots.
ⓘ Source: listings_history table (triggers on properties + properties_extension) + one-shot
backfill from property_details.listing_events for pre-trigger history.
Nearby sold comps map
Loading sold comps map…
Walkable amenities ~0.75 mi
Loading nearby amenities…
Taxation est. · year 1
- Rental income
- $18,290
- − Mortgage interest
- −$6,716
- − Property taxes
- −$1,798
- − Insurance
- −$600
- − Repairs & maintenance
- −$1,463
- − Management
- −$1,463
- − Depreciation
- −$3,488
- Taxable income
- $2,761
- Est. tax owed @ 24.0%
- −$663
- After-tax cash flow
- $3,843/yr
For passive investors: Depreciation is non-cash, so a rental often shows a tax loss while cash-flowing — sheltering income. Rental losses are passive: they offset passive income freely, and up to $25,000/yr can offset ordinary (W-2) income if you actively participate and your MAGI is under $100k (phasing out to $0 by $150k); unused losses carry forward. On sale, claimed depreciation is recaptured at up to 25%, and gains may owe capital-gains tax (a 1031 exchange can defer both). Figures are a year-1 estimate at your 24.0% rate — not tax advice; consult a CPA.
Condition & rehab AI · 12 photos
This property requires extensive renovations, including new kitchen cabinets, countertops, bathroom fixtures, and a new roof. The satellite image shows a worn roof, and the interior photos reveal significant wear and tear. The home has the potential to be a great investment with the right updates.
Repairs flagged
- Major Kitchen cabinets — Old and outdated
- Major Kitchen countertops — Missing
- Major Bathroom vanity — Missing
- Major Bathroom fixtures — Old and outdated
- Major Roof — Worn
Value-add opportunities
- Both New kitchen cabinets and countertops — Modernizes the kitchen and adds value
- Both New bathroom vanity and fixtures — Modernizes the bathroom and adds value
- Both New roof — Improves the home's overall condition and adds value
Renovation cost estimate screening
| Repair item | Severity | Est. cost |
|---|---|---|
| Kitchen cabinets · Old and outdated | Major | $15,000–50,000 |
| Kitchen countertops · Missing | Major | $15,000–50,000 |
| Bathroom vanity · Missing | Major | $15,000–50,000 |
| Bathroom fixtures · Old and outdated | Major | $15,000–50,000 |
| Roof · Worn | Major | $15,000–50,000 |
| Total estimated repair cost · 5 items | $75,000–250,000 |
Value-add ROI direction
- Both New kitchen cabinets and countertops — Modernizes the kitchen and adds value ↑
- Both New bathroom vanity and fixtures — Modernizes the bathroom and adds value ↑
- Both New roof — Improves the home's overall condition and adds value ↑
ⓘ Cost ranges are severity-bucket heuristics (US national rule-of-thumb). Get contractor quotes + a written scope before underwriting a rehab budget.
Schools (NCES district)
- District
- Millersburg Area SD
- NCES district ID
- 4215360
- Math proficiency
- 36% ▼ -16.00%
- Reading proficiency
- 51% ▼ -14.00%
- Median HH income
- $50,625
- Composite
- 37.4/100
- National rank
- #4426
- State rank
- #288 of 539 in PA
Livability — Millersburg
- Score
- 74/100
- State rank
- #480
- US rank
- #4444
Category grades
Schools grade is shown separately in the Schools card above.
Census & demographics
- Census place
- Millersburg, PA
- Population (ZIP)
- 6,825
Population outlook (Dauphin County) Hauer SSP2
- Today (2025)
- 281,628 people
- By 2030
- 283,549 · +0.7%
- By 2040
- 285,385 · +1.3%
- By 2050
- 286,188 · +1.6%
- By 2075
- 291,053 · +3.3%
- By 2100
- 282,374 · +0.3%
Race, ethnicity, and origin ACS 2023
- Neighborhood character
- Predominantly White (89%)
- Race & ethnicity
- White 89% Two or more races 6% Hispanic / Latino 2% Asian 1% Black 1%
- Common ancestry
- Romanian 3% Polish 2% Slovak 1%
- Foreign-born
- 1% · China
- Languages at home
- 94% English-only · German/W. Germanic 4% Other Indo-European 1% Chinese 1%
Political lean MEDSL · Dauphin
- 2024 margin
- Lean D (+5.9) · D 52.4% · R 46.5% · Other 1.1%
- 2008→2024 swing
- -3.1pp toward R · 2008: 9.1pp · 2024: 5.9pp
- All cycles
- 2024: D+5.9 2020: D+8.5 2016: D+2.8 2012: D+6.0 2008: D+9.1
Not yet ingested
- Civics
- —
Market trends
- HPI YoY
- ▲ 1.20%
- Current HPI
- 271.943
- Rent YoY
- —
- Metro
- —
- State GDP YoY
- ▲ 1.68%
- F500 in state
- 34
Industry mix (Fortune 500 HQ in PA)
| Industry | F500 HQs | Revenue |
|---|---|---|
| Healthcare | 2 | $309B |
|
||
| Insurance | 2 | $27B |
|
||
| Telecommunications / Media | 1 | $124B |
|
||
| Industrial Distribution | 1 | $22B |
|
||
| Financial Services | 1 | $20B |
|
||
| Chemicals / Materials | 1 | $18B |
|
||
Price history
1 event — show timeline
- 2026-03-22 Listed $119,900 BRIGHT MLS
Cash-flow waterfall
monthlySold comps — $/sqft
last 12 mo · ≤1 miLoading sold comps…