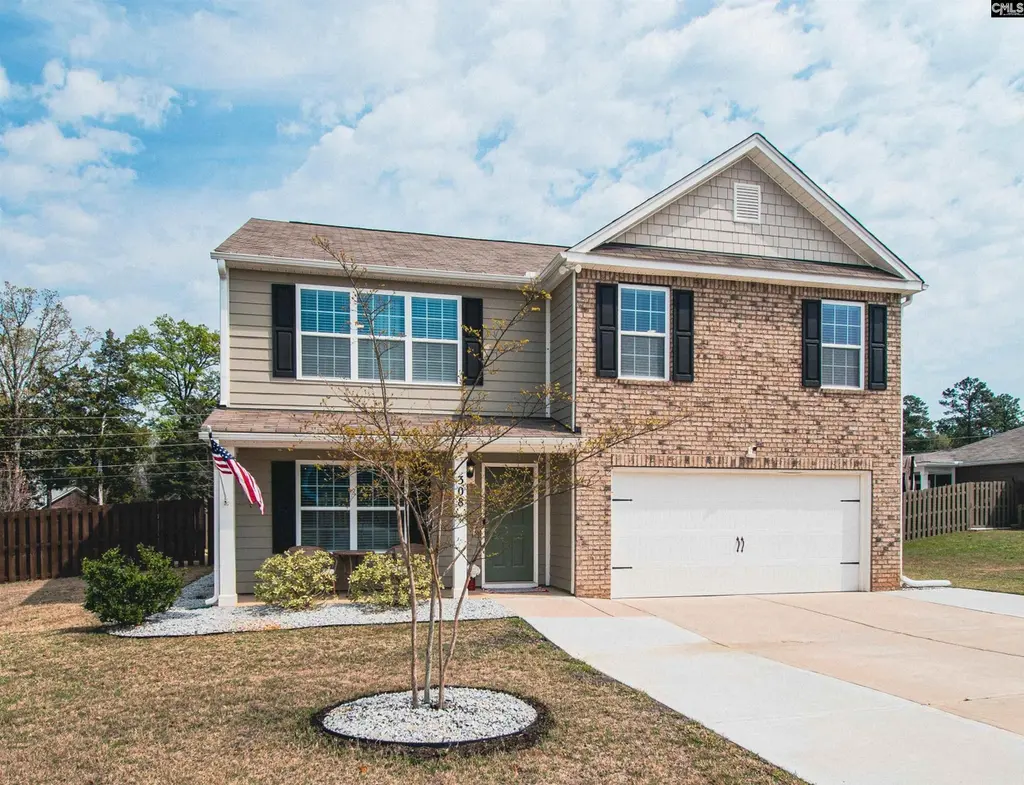
308 Throne Ct · Lake Murray of Richland, SC
Flood risk No data
- FEMA flood zone
- —
- Chance of flooding over 30 yrs
- —
- Est. flood insurance / yr
- —
Fire risk No data
- Est. fire insurance / yr
- —
Heat risk No data
- Hot days now (above threshold)
- —
- Hot days in 30 yrs
- —
Wind risk No data
- Chance of severe wind over 30 yrs
- —
Air-quality risk No data
- Unhealthy air days now
- —
- Unhealthy air days in 30 yrs
- —
Risk factors via First Street. Map © Google.
Why this score? — see what drove the C grade
The composite is a weighted blend of 9 inputs, each scored 0–100. Each bar is that input's sub-score; the figure is the points it added to the 100-point composite (weight × sub-score).
- Cash flow +21.5/30.0
- ARV discount +7.5/15.0
- DSCR +6.9/10.0
- 1% rule +4.9/10.0
- Schools +4.5/10.0
- Condition / age +4.0/5.0
- Livability +3.4/5.0
- Rent growth +2.5/5.0
- Appreciation +0.0/10.0
$319,900
🖨 Deal sheet (PDF) 📄 Offer letter ✓ Due diligence
Listing remarks
Welcome home to this beautifully maintained 5-bedroom, 3-bath gem with 2,546 sq ft of like-new living space in one of the area's most desirable communities. Meticulously cared for and truly move-in ready, this home checks every box from the moment you walk in. The thoughtful floor plan includes a convenient main-floor bedroom and full bath — ideal for guests, in-laws, or flexible everyday living. But the real showstopper is out back. Step outside to your own private oasis on a sprawling 0.29-acre fully fenced lot, where an extra-large covered patio sets the stage for year-round entertaining and a cozy firepit beckons for evenings under the stars. With impressive space between neighbor
Key facts
- Main-floor bedroom
- Cozy firepit
- Full bath
Tags
Property features AI
Finance
- Other: Lot with paved road access; Approximately 0.29 acres
- HOA & community: Homeowners association present; Association maintains common areas, pool, and green areas
Exterior
- Parking: Attached garage with 2 garage spaces (main level)
- Utilities: Public water; Public sewer
- Home design: Two-story house; House faces southwest; Property type: single-family home
- Construction: Fiber cement (HardiePlank) and stone exterior; Slab foundation
- Exterior features: Covered front porch; Covered back porch; Outdoor fireplace; Rear wood privacy fence
Interior
- Kitchen: Eat-in kitchen; Granite countertops; Tiled backsplash; Painted cabinets; Vinyl flooring; Free-standing smooth-surface range; Dishwasher; Garbage disposal
- Bedrooms: Primary bedroom on second floor with double vanity, separate shower, walk-in closet, vaulted ceilings, carpeted floors; Second bedroom on second floor with walk-in closet and carpeted floors; Third bedroom on second floor with walk-in closet and carpeted floors; Fourth bedroom (FROG - requires closet) on second floor with carpeted floors; Fifth bedroom on main level with private closet and carpeted floors
- Flooring: Carpet in bedrooms and select areas; Vinyl flooring in formal dining and great room; Vinyl in kitchen
- Bathrooms: Three full bathrooms total; One main-level full bathroom; Two additional full bathrooms
- Heating & cooling: Central heating; Central air conditioning
- Interior features: Ceiling fan(s); Garage door opener; Gas log (natural) fireplace; Single fireplace
- Laundry & utility: Laundry room in heated space; Washer/dryer area on second floor
Neighborhood map
What this means for you Summary
Snapshot
- This is a 5-bed/3.0-bath single-family listed at $320k. Condition is rated good.
Deal economics
- At list price, monthly cash flow is $481 ($6k/yr) — positive.
- The deal already cash-flows at list — no discount required.
- To meet the 1% rule (rent ≥ 1% of price), the offer needs to be $318k (0.7% below list).
- Recommended offer: $301k (6.0% below list) — sets the bar for market timing.
Location & tenants
- Location reads 67/100 on livability (#102 in SC) — a middle-class / working-renter tenant base. Strengths: crime A+, employment A+, housing A+; Watch: amenities F, commute F, cost of living F.
- Lexington 05 (suburban): math 47% / reading 55% proficiency, ranked #5 of 80 in SC (top 6%) — acceptable for families but not a draw, mixed tenant base, ~2y average lease.
- Zoned schools: Chapin Elementary (math 53% / reading 51%, grade C-, #145 of 597 statewide, top 26%, 790 students, 34% FRL); Chapin High (math 82% / reading 91%, grade A, #7 of 196 statewide, top 4%, 1,615 students, 100% FRL) — zoned schools average 67% FRL vs 27% district-wide (40 pts higher); higher-poverty schools than district average — tighter screening recommended.
- Zoned-school proficiency averages 69% at this address vs 51% district-wide (+18 pts) — the actual schools serving this property are materially stronger than the Lexington 05 average implies; a family-tenant draw the district grade alone would hide.
- Market conditions: 443 active listings in the ZIP; 2 comparable units currently listed for rent nearby; high-income renter base; 1,712 units permitted in Lexington County in 2024 (0 in 5+ unit buildings).
- This rent runs 33% of the median local income ($114k/yr) — at the standard rent-burdened threshold; future hikes will face affordability resistance.
Forward outlook
- Local home prices are declining (-3.0%/yr); year-one equity from $2k of loan paydown is wiped out by about $10k of value loss. Plan a longer hold.
- Lexington County population projected at +26% by 2050 — long-run rental-demand tailwind backs the buy-and-hold thesis.
Negotiation context
- It's been on market 72 days — a 6% lower offer ($301k) is reasonable based on typical stale-listing flexibility.
- 2 sale attempts since 5y ago; this cycle's ask has dropped $35k (10%) from the opening price — seller is motivated, your offer sets the floor, not the list.
Questions for the listing agent
- It's been on market 72 days. Have you received any prior offers? Is the seller open to a 6% concession, seller financing, or rate buy-down credit?
- What does the HOA fee cover, when was the last increase, and are there any pending special assessments or reserve-fund shortfalls?
- Why hasn't it sold? Are there any deal-killer items the seller is aware of (foundation, flood, title, zoning, code violations)?
- Is there a deadline driving the sale (1031 exchange, divorce, estate, relocation)? That informs how much negotiation room exists.
- Schools are D-rated, which usually means shorter tenancies and higher turnover. Who's the typical renter profile here, and what's been the actual vacancy rate?
- What's the average days-on-market for RENTAL listings here right now (not sales)? A rising rental-DOM trend means longer vacancies and softer asking-rent achievability than the comps imply.
- What's the recent tenant-quality profile in this submarket — average credit score on applications, eviction rate, late-payment / NSF rate, and stable-employment percentage? A property-management company in the area should have these aggregated.
- How much new for-sale + rental construction is in the pipeline within 1–3 miles? Heavy new supply typically softens prices + rents 12–24 months out; constrained supply supports both.
Investment metrics
- 1% rule
- 0.99% ✗
- Cap rate
- 8.10%
- Cash-on-cash
- 6.45%
- DSCR
- 1.29
- GRM
- 8.4
CMA / ARV
No comps found within radius.
Projected returns pro-forma
-3.0% appreciation · 3.0% rent growth · sell at horizon
- IRR
- -6.4%
- Equity multiple
- 0.76×
- Total profit
- $-21,257
- Equity at exit
- $47,698
- IRR
- 3.2%
- Equity multiple
- 1.23×
- Total profit
- $20,689
- Equity at exit
- $27,659
Cash invested: $89,572 (down + closing). Projections, not guarantees.
Landlord ↔ Tenant lean methodology
- Overall (STATE)
- 90 Strongly Landlord-Friendly
- State South Carolina
- 90 Strongly Landlord-Friendly · R+6
- County
- — inherits STATE
- City
- — inherits STATE
ZIP-level market 29036
- Active inventory
- 443
- Price-to-rent
- 8.4×
Monthly cashflow live
- Estimated rent
- $3,177 medium interval (Pro) →
- Mortgage (P&I)
- −$1,678
- Tax from tax record
- −$153 /mo · $1,833/yr
- Insurance
- −$133
- HOA
- −$65
- Vacancy / Maint / Mgmt
- −$667
- Net cashflow
- $481
Break-even live
Sensitivity live
| Price | -10% $662 | -5% $572 | +0% $481 | +5% $391 | +10% $300 |
|---|---|---|---|---|---|
| Rent | -10% $230 | -5% $356 | +0% $481 | +5% $607 | +10% $732 |
| Rate | -1.0pp $642 | -0.5pp $563 | base $481 | +0.5pp $398 | +1.0pp $314 |
UW: 25.0% down · 7.5% · 30yr · 1.5% tax · 5.0% vac · 8.0% maint · 8.0% mgmt
Financing live
Cash to close
- Down payment
- $79,975
- Closing costs
- $9,597
- Reserves months
- —
- Total cash needed
- —
Loan-product check · same deal, 3 products live
Conventional
25% down · 7.5% · 30yr
- Down + closing
- —
- Monthly P&I
- —
- Monthly cashflow
- —
- DSCR
- —
- Eligible?
- —
Personal DTI + credit; lowest rate.
DSCR
20% down · 8.5% · 30yr
- Down + closing
- —
- Monthly P&I
- —
- Monthly cashflow
- —
- DSCR
- —
- Eligible?
- —
No personal income docs; deal must DSCR.
Hard money
10% down · 12.0% · 12mo
- Down + closing
- —
- Monthly P&I
- —
- Monthly cashflow
- —
- DSCR
- —
- Eligible?
- —
Short-term bridge; refi at stabilization.
Rent comps 2 comps
| Address | Beds | Baths | Sqft | Rent | $/sqft | DOM | Units | Dist |
|---|---|---|---|---|---|---|---|---|
| 628 Willowood Pkwy Chapin, SC | 4.0 | 2.0 | 2000 | $2,760 | $1.38 | 4d | 1 | 0.95mi |
| 40 Rustyred Ct Chapin, SC | 4.0 | 2.5 | 2400 | $2,450 | $1.02 | 12d | 1 | 1.39mi |
HOA detail
- Monthly dues
- $65 · $780/yr
Listing history 12 events
-
2026-06-07statusdays on market $319,900 Pending 72 DOM
-
2026-06-03days on market $319,900 Active - Contingent 70 DOM
-
2026-06-03days on market $319,900 Active - Contingent 69 DOM
-
2026-06-01days on market $319,900 Active - Contingent 68 DOM
-
2026-05-31days on market $319,900 Active - Contingent 67 DOM
-
2026-05-22historical Active - Contingent
-
2026-05-19price $319,900
-
2026-05-03price $327,500
-
2026-04-11price $344,900
-
2026-03-25$354,900 Active
-
2021-11-10historical
-
2021-09-23$302,490 Active
ⓘ Source: listings_history table (triggers on properties + properties_extension) + one-shot
backfill from property_details.listing_events for pre-trigger history.
Tax reassessment forecast SC · Resets to sale price
- Current annual tax
- $1,833 · $153/mo
- Projected year-2 tax
- $1,833 · $153/mo
- Expected delta
- $0/yr ($0/mo · 0.0%)
ⓘ Screening estimate from a state-policy table — verify with the county assessor before closing.
Nearby sold comps map
Loading sold comps map…
Walkable amenities ~0.75 mi
Loading nearby amenities…
Taxation est. · year 1
- Rental income
- $38,123
- − Mortgage interest
- −$17,919
- − Property taxes
- −$1,833
- − Insurance
- −$1,600
- − Repairs & maintenance
- −$3,050
- − Management
- −$3,050
- − HOA
- −$780
- − Depreciation
- −$9,306
- Taxable income
- $585
- Est. tax owed @ 24.0%
- −$141
- After-tax cash flow
- $5,633/yr
For passive investors: Depreciation is non-cash, so a rental often shows a tax loss while cash-flowing — sheltering income. Rental losses are passive: they offset passive income freely, and up to $25,000/yr can offset ordinary (W-2) income if you actively participate and your MAGI is under $100k (phasing out to $0 by $150k); unused losses carry forward. On sale, claimed depreciation is recaptured at up to 25%, and gains may owe capital-gains tax (a 1031 exchange can defer both). Figures are a year-1 estimate at your 24.0% rate — not tax advice; consult a CPA.
Condition & rehab AI · 12 photos
This move-in ready home in a desirable community offers a spacious floor plan and a private backyard oasis.
Value-add opportunities
- Both landscaping — enhances curb appeal and adds value
- Both paint exterior — improves curb appeal and adds value
- Both replace carpet — modern flooring increases appeal and value
Renovation cost estimate screening
Value-add ROI direction
- Both landscaping — enhances curb appeal and adds value ↑
- Both paint exterior — improves curb appeal and adds value ↑
- Both replace carpet — modern flooring increases appeal and value ↑
ⓘ Cost ranges are severity-bucket heuristics (US national rule-of-thumb). Get contractor quotes + a written scope before underwriting a rehab budget.
Schools (NCES district)
- District
- Lexington 05
- NCES district ID
- 4502820
- Math proficiency
- 47% ▼ -7.00%
- Reading proficiency
- 55% ▼ -4.00%
- Median HH income
- $67,732
- Composite
- 45.28/100
- National rank
- #2656
- State rank
- #5 of 80 in SC
Livability — Lake Murray of Richland
- Score
- 67/100
- State rank
- #102
- US rank
- #10903
Category grades
Schools grade is shown separately in the Schools card above.
Census & demographics
- County
- Lexington County · 232,571 people
- City population
- 179
- Metro
- Columbia, SC
- Population (ZIP)
- 26,620
- Household income
- $113,986
- Rent vs Own
- Severe rent burden
- 212.0
Population outlook (Lexington County) Hauer SSP2
- Today (2025)
- 322,999 people
- By 2030
- 342,356 · +6.0%
- By 2040
- 377,715 · +16.9%
- By 2050
- 406,984 · +26.0%
- By 2075
- 465,447 · +44.1%
- By 2100
- 485,674 · +50.4%
Race, ethnicity, and origin ACS 2023
- Neighborhood character
- Predominantly White (86%)
- Race & ethnicity
- White 86% Asian 5% Two or more races 4% Black 3% Hispanic / Latino 3%
- Common ancestry
- Lithuanian 4% Slovak 4% Italian 2%
- Foreign-born
- 6% · Canada, South Korea, China
- Languages at home
- 95% English-only · Other Indo-European 2% Spanish 1% Korean 1%
Political lean MEDSL · Lexington
- 2024 margin
- Solid R (+33.5) · D 32.5% · R 66.0% · Other 1.4%
- 2008→2024 swing
- +4.6pp toward D · 2008: -38.0pp · 2024: -33.5pp
- All cycles
- 2024: R+33.5 2020: R+30.1 2016: R+36.7 2012: R+37.8 2008: R+38.0
Not yet ingested
- Civics
- —
Market trends
- HPI YoY
- ▼ -134.76%
- Current HPI
- 248.3807
- Rent YoY
- —
- Metro
- Columbia, SC
- State GDP YoY
- ▲ 4.51%
- F500 in state
- 2
Industry mix (Fortune 500 HQ in SC)
| Industry | F500 HQs | Revenue |
|---|---|---|
| Packaging | 1 | $7B |
|
||
Price history
+5.8% since first listed7 events — show timeline
- 2026-05-22 Contingent — Consolidated MLS
- 2026-05-19 Price Changed $319,900 Consolidated MLS
- 2026-05-03 Price Changed $327,500 Consolidated MLS
- 2026-04-11 Price Changed $344,900 Consolidated MLS
- 2026-03-25 Listed $354,900 Consolidated MLS
- 2021-11-10 Delisted — Consolidated MLS
- 2021-09-23 Listed $302,490 Consolidated MLS
Property tax history
+192.2%/yrLatest (2024): $1,833 · +0.9% YoY. Source: county tax records.
Cash-flow waterfall
monthlySold comps — $/sqft
last 12 mo · ≤1 miLoading sold comps…