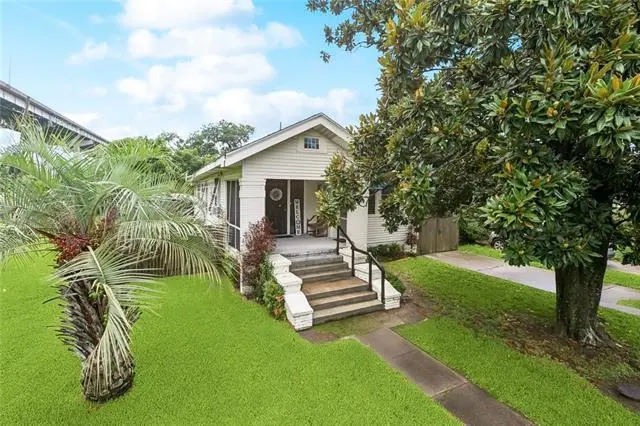
1615 Bodenger Blvd · New Orleans, LA
Flood risk 9/10 · Severe
- FEMA flood zone
- AE
- Chance of flooding over 30 yrs
- 0.99%
- Est. flood insurance / yr
- $1,737 – $8,500
Fire risk 1/10 · Minimal
- Est. fire insurance / yr
- $1,269 – $2,357
Heat risk 10/10 · Severe
- Hot days now (above 108°F)
- 7 days/yr
- Hot days in 30 yrs
- 21 days/yr
Wind risk 10/10 · Severe
- Chance of severe wind over 30 yrs
- 99.0%
Air-quality risk 2/10 · Minimal
- Unhealthy air days now
- 2 days/yr
- Unhealthy air days in 30 yrs
- 2 days/yr
Risk factors via First Street. Map © Google.
Why this score? — see what drove the B grade
The composite is a weighted blend of 9 inputs, each scored 0–100. Each bar is that input's sub-score; the figure is the points it added to the 100-point composite (weight × sub-score).
- Cash flow +30.0/30.0
- ARV discount +15.0/15.0
- DSCR +10.0/10.0
- 1% rule +7.6/10.0
- Livability +4.0/5.0
- Condition / age +2.5/5.0
- Rent growth +2.3/5.0
- Schools +1.6/10.0
- Appreciation +0.0/10.0
$184,000
🖨 Deal sheet (PDF) 📄 Offer letter ✓ Due diligence
Listing remarks MLS
HOME FOR SALE NEAR THE HISTORIC MCDONOUGH NEIGHBORHOOD. THE BIG EASY'S 2ND OLDEST NEIGHBORHOOD.. THIS CHARMING RAISED HOME HAS A BLEND OF LOCATION, CHARACTER AND CONVENIENCE. ON A CORNER LOT WITH OFF STREET PARKING, 1615 BODENGER BLVD HAS 3 BEDROOMS, 1.5 BATHS AND A WELCOMING FRONT PORCH FOR RELAXING AND ENJOYING THE NEIGHBORHOOD CHARM. LOCATED ON THE WESTBANK OF THE MISSISSIPPI RIVER, JUST ACROSS THE WATER FROM DOWNTOWN NEW ORLEANS, THIS HOME PLACES YOU MINUTES FROM THE HEART OF THE CITY WHILE STILL OFFERING A NEIGHBORHOOD FEEL, ENJOY EASY ACCESS TO THE RIVER, LOCAL DINING, SHOPPING AND EVERYTHING NEW ORLEANS OFFERS. WHETHER YOU'RE LOOKING FOR YOUR NEXT HOME OR AN INVESTMENT OPPORTUNITY THIS PROPERTY IS FULL OF POTENTIAL IN A LOCATION RICH WITH HISTORY AND CULTURE.
Key facts
- Off street parking
- Corner lot
- Parking
Tags
Property features AI
Exterior
- Parking: Driveway
- Utilities: Public water; Public sewer
- Home design: Single-story; Shingle roof
- Construction: Raised foundation; Shingle roof
- Exterior features: Corner lot; City lot; Lot dimensions approximately 25 x 122; Raised foundation
Interior
- Bedrooms: Total rooms: 3
- Bathrooms: 1 full bathroom; 1 half bathroom
- Heating & cooling: Central heating; Central air conditioning
- Interior features: Very good condition
Neighborhood map
What this means for you Summary
Snapshot
- This is a 2-bed/1.0-bath single-family listed at $184k.
Deal economics
- At list price, monthly cash flow is $273 ($3k/yr) — positive.
- The deal already cash-flows at list — no discount required.
- Meets the 1% rule at list price ($2k rent vs $184k).
- Recommended offer: $181k (1.5% below list) — sets the bar for market timing.
- Cap rate 10.9% vs local median 4.4% in New Orleans — top-decile yield for the area; either an underpriced asset or a hidden risk that comps aren't pricing in. Stress-test before assuming the spread holds.
Location & tenants
- Location reads 81/100 on livability (#3 in LA, #1,383 nationally) — a professional / high-income tenant draw. Strengths: amenities A+, commute A+, health & safety A+; Watch: crime C-, employment D.
- Orleans Parish (urban): math 11% / reading 27% proficiency, ranked #69 of 98 in LA (top 70%) — low school quality limits family demand, transient renter base, plan for 1-2y turnover; 68% free/reduced lunch — lower-income household profile, screen leases tightly.
- Zoned schools: Benjamin Franklin Elem. Math And Science (math 12% / reading 23%, grade F, #479 of 646 statewide, top 75%, 747 students, 98% FRL, charter) — zoned schools average 98% FRL vs 68% district-wide (30 pts higher); higher-poverty schools than district average — tighter screening recommended.
- Market conditions: Rents soft (-0.7%/yr); 265 active listings in the ZIP; 37 comparable units currently listed for rent nearby; rentals at typical pace (median 25d on market — plan ~3-4 weeks tenant-placement turnaround); lower-income renter base — watch delinquency; 710 units permitted in Orleans Parish in 2024 (244 in 5+ unit buildings).
- At $2,322/mo this rent would consume 64% of the median local household income ($43k/yr) (locally 2240% of renters already pay >50% of income on rent) — very limited rent-growth headroom before tenants either downsize or default.
Forward outlook
- Local home prices are declining (-3.0%/yr); year-one equity from $1k of loan paydown is wiped out by about $6k of value loss. Plan a longer hold.
- Orleans County population projected at +61% by 2050 — long-run rental-demand tailwind backs the buy-and-hold thesis.
Negotiation context
- It's been on market 25 days — a 2% lower offer ($181k) is reasonable based on typical stale-listing flexibility.
- 17 sale attempts since 17y ago with the ask held roughly flat each time — persistent listings suggest the price (not the market) is what's stuck; bring a comps-based counter.
- Current owner paid $35k; list at $184k implies a 426% gain — meaningful room to come down on a strong offer.
Risks & watch-outs
- Watch-outs: flood insurance adds $427/mo; built in 1940 — expect roof / HVAC / electrical / plumbing capex.
- Climate carrying-cost: in FEMA flood zone AE (mandatory federal flood insurance); severe wind risk, 99% chance of damaging wind over 30y; extreme-heat days projected 7→21/yr by 2055 (HVAC capex compounding) — expect insurance premiums to compound above CPI over the hold.
Questions for the listing agent
- Built in 1940 — when were the roof, HVAC, electrical panel, plumbing, and water heater last replaced?
- What's the actual annual flood-insurance premium (NFIP or private), and is the property in a SFHA with mandatory coverage?
- Is there a deadline driving the sale (1031 exchange, divorce, estate, relocation)? That informs how much negotiation room exists.
- What's the average days-on-market for RENTAL listings here right now (not sales)? A rising rental-DOM trend means longer vacancies and softer asking-rent achievability than the comps imply.
- What's the recent tenant-quality profile in this submarket — average credit score on applications, eviction rate, late-payment / NSF rate, and stable-employment percentage? A property-management company in the area should have these aggregated.
- How much new for-sale + rental construction is in the pipeline within 1–3 miles? Heavy new supply typically softens prices + rents 12–24 months out; constrained supply supports both.
Investment metrics
- 1% rule
- 1.26% ✓
- Cap rate
- 10.85%
- Cash-on-cash
- 16.28%
- DSCR
- 1.72
- GRM
- 6.6
CMA / ARV
- ARV (on-the-fly)
- $359,800
- Comps found
- 10
Show comp detail 10 sales within ~0.75 mi
| Address | Dist | Beds/Ba | Sqft | Sold | Price | $/sf | Match |
|---|---|---|---|---|---|---|---|
| 1600 Bodenger Blvd | 0.04mi | 3/2.5 (+1) | 1,558 (-13%) | 1mo | $102,000 | $65 | 64 |
| 935 Belleville St | 0.46mi | 3/2.0 (+1) | 1,847 (+3%) | 2mo | $370,000 | $200 | 63 |
| 441 Hancock St | 0.31mi | 3/2.0 (+1) | 1,730 (-4%) | 10mo | $380,000 | $220 | 62 |
| 422 Red Allen Way | 0.67mi | 3/2.0 (+1) | 1,800 (+0%) | 1mo | $440,000 | $244 | 59 |
| 918 Perry St | 0.55mi | 3/2.0 (+1) | 1,736 (-4%) | 1mo | $80,000 | $46 | 59 |
| 419 Homer St | 0.57mi | 3/2.0 (+1) | 1,785 (-1%) | 13mo | $419,000 | $235 | 52 |
| 800 Hancock St | 0.53mi | 3/1.0 (+1) | 1,873 (+4%) | 15mo | $190,000 | $101 | 51 |
| 1210 Belleville St | 0.28mi | 3/2.0 (+1) | 1,600 (-11%) | 10mo | $55,000 | $34 | 51 |
| 2110 Mardi Gras Blvd | 0.70mi | 3/2.0 (+1) | 1,568 (-13%) | 2mo | $260,500 | $166 | 35 |
| 714 Americus St | 0.48mi | 3/1.5 (+1) | 1,565 (-13%) | 23mo | $359,000 | $229 | 30 |
Match score weights: distance 35% · size 25% · config 20% · recency 20%. Top-matched comps best support the ARV.
Projected returns pro-forma
-3.0% appreciation · 0.0% rent growth · sell at horizon
- IRR
- -10.5%
- Equity multiple
- 0.63×
- Total profit
- $-19,050
- Equity at exit
- $27,435
- IRR
- -7.2%
- Equity multiple
- 0.62×
- Total profit
- $-19,669
- Equity at exit
- $15,909
Cash invested: $51,520 (down + closing). Projections, not guarantees.
Landlord ↔ Tenant lean methodology
- Overall (STATE)
- 90 Strongly Landlord-Friendly
- State Louisiana
- 90 Strongly Landlord-Friendly · R+12
- County
- — inherits STATE
- City
- — inherits STATE
ZIP-level market 70114
- Rents YoY
- -0.7%
- Active inventory
- 265
- Price-to-rent
- 6.6×
Monthly cashflow live
- Estimated rent
- $2,322 high interval (Pro) →
- Mortgage (P&I)
- −$965
- Tax from tax record
- −$94 /mo · $1,124/yr
- Insurance
- −$77
- Flood insurance flood zone
- −$427 /mo · $5,118/yr
- HOA
- −$0
- Vacancy / Maint / Mgmt
- −$488
- Net cashflow
- $273
Break-even live
Sensitivity live
| Price | -10% $377 | -5% $325 | +0% $273 | +5% $220 | +10% $168 |
|---|---|---|---|---|---|
| Rent | -10% $89 | -5% $181 | +0% $273 | +5% $364 | +10% $456 |
| Rate | -1.0pp $365 | -0.5pp $319 | base $273 | +0.5pp $225 | +1.0pp $176 |
UW: 25.0% down · 7.5% · 30yr · 1.5% tax · 5.0% vac · 8.0% maint · 8.0% mgmt
Financing live
Cash to close
- Down payment
- $46,000
- Closing costs
- $5,520
- Reserves months
- —
- Total cash needed
- —
Loan-product check · same deal, 3 products live
Conventional
25% down · 7.5% · 30yr
- Down + closing
- —
- Monthly P&I
- —
- Monthly cashflow
- —
- DSCR
- —
- Eligible?
- —
Personal DTI + credit; lowest rate.
DSCR
20% down · 8.5% · 30yr
- Down + closing
- —
- Monthly P&I
- —
- Monthly cashflow
- —
- DSCR
- —
- Eligible?
- —
No personal income docs; deal must DSCR.
Hard money
10% down · 12.0% · 12mo
- Down + closing
- —
- Monthly P&I
- —
- Monthly cashflow
- —
- DSCR
- —
- Eligible?
- —
Short-term bridge; refi at stabilization.
Rent comps 37 comps
| Address | Beds | Baths | Sqft | Rent | $/sqft | DOM | Units | Dist |
|---|---|---|---|---|---|---|---|---|
| 513 Park Blvd New Orleans, LA | 3.0 | 2.0 | 1600 | $2,300 | $1.44 | 5d | 1 | 0.18mi |
| 1414 Sumner St New Orleans, LA | 3.0 | 2.0 | 1800 | $1,450 | $0.81 | 17d | 1 | 0.56mi |
| 1010 Isbell St Gretna, LA | 3.0 | 1.0 | 1300 | $1,350 | $1.04 | 45d | 1 | 0.57mi |
| 1402 Behrman Ave New Orleans, LA | 2.0 | 1.0 | 1673 | $1,500 | $0.90 | 25d | 1 | 0.62mi |
| 807 Whitney Ave Unit 1 New Orleans, LA | 3.0 | 2.0 | 1262 | $1,500 | $1.19 | 5d | 1 | 0.66mi |
| 543 Atlantic Ave New Orleans, LA | 2.0 | 2.5 | 1430 | $2,200 | $1.54 | 25d | 1 | 0.75mi |
| 527 Atlantic Ave New Orleans, LA | 3.0 | 2.0 | 1800 | $2,050 | $1.14 | 25d | 1 | 0.77mi |
| 701 Behrman Ave New Orleans, LA | 3.0 | 2.0 | 1368 | $2,300 | $1.68 | 5d | 1 | 0.87mi |
| 336 Elmira Ave New Orleans, LA | 3.0 | 1.0 | 1250 | $1,825 | $1.46 | 25d | 1 | 0.92mi |
| 119 Vallette St New Orleans, LA | 3.0 | 2.5 | 1500 | $2,100 | $1.40 | 25d | 1 | 1.09mi |
| 323 Morgan St Unit G New Orleans, LA | 2.0 | 2.5 | 1700 | $2,500 | $1.47 | 45d | 1 | 1.13mi |
| 323 Morgan St New Orleans, LA | 2.0 | 2.5 | 2000 | $3,600 | $1.80 | 18d | 1 | 1.13mi |
| 323 Morgan St Unit C New Orleans, LA | 2.0 | 2.0 | 2000 | $3,200 | $1.60 | 45d | 1 | 1.13mi |
| 323 Morgan St Apt E New Orleans, LA | 2.0 | 2.5 | 2000 | $3,600 | $1.80 | 45d | 1 | 1.13mi |
| 1107 S Peters St #101 New Orleans, LA | 2.0 | 2.5 | 1454 | $3,700 | $2.54 | 17d | 1 | 1.14mi |
| 1107 S Peters St #101 New Orleans, LA | 2.0 | 2.5 | 1454 | $3,700 | $2.54 | 45d | 1 | 1.16mi |
| 1132 Tchoupitoulas St New Orleans, LA | 1.0 | 1.0 | 1599 | $4,600 | $2.88 | 45d | 1 | 1.19mi |
| 2 Canal St #2008 New Orleans, LA | 2.0 | 2.5 | 1533 | $9,000 | $5.87 | 4d | 1 | 1.21mi |
| 2 Canal St #2008 New Orleans, LA | 2.0 | 2.5 | 1533 | $9,300 | $6.07 | 17d | 1 | 1.21mi |
| 700 S Peters St #316 New Orleans, LA | 2.0 | 2.0 | 1250 | $3,250 | $2.60 | 45d | 1 | 1.21mi |
| 1050 Annunciation St Unit 1272355P New Orleans, LA | 2.0–5.0 | 2.0–4.0 | 1544 | $1,488 | $0.96 | 5d | 3 | 1.25mi |
| 840 Tchoupitoulas St #201 New Orleans, LA | 2.0 | 2.0 | 1298 | $5,000 | $3.85 | 17d | 1 | 1.25mi |
| 840 Tchoupitoulas St #201 New Orleans, LA | 2.0 | 2.0 | 1298 | $5,000 | $3.85 | 5d | 1 | 1.25mi |
| 1622 Jo Ann Pl New Orleans, LA | 3.0 | 1.5 | 1301 | $1,500 | $1.15 | 3d | 1 | 1.29mi |
| 3000 Americus St New Orleans, LA | 3.0 | 2.0 | 1280 | $1,400 | $1.09 | 25d | 1 | 1.32mi |
| 1420 Annunciation St New Orleans, LA | 1.0–3.0 | 1.0–2.0 | 1019 | $1,835 | $1.80 | 3d | 78 | 1.34mi |
| 14 Gelbke Dr Gretna, LA | 3.0 | 2.0 | 1327 | $1,800 | $1.36 | 25d | 1 | 1.35mi |
| 14 Gelbke Dr Gretna, LA | 3.0 | 2.0 | 1327 | $1,950 | $1.47 | 45d | 1 | 1.35mi |
| 1825 Murl St New Orleans, LA | 3.0 | 2.0 | 2484 | $1,750 | $0.70 | 25d | 1 | 1.35mi |
| 1325 Annunciation St New Orleans, LA | 1.0–2.0 | 1.0–2.0 | 933 | $2,655 | $2.84 | 3d | 13 | 1.36mi |
| 909 Race St New Orleans, LA | 2.0 | 1.5 | 1375 | $2,100 | $1.53 | 17d | 1 | 1.43mi |
| 921 Race St Unit C New Orleans, LA | 3.0 | 2.0 | 1570 | $3,000 | $1.91 | 12d | 1 | 1.44mi |
| 431 Gravier St Ste 4 New Orleans, LA | 3.0 | 2.0 | 2100 | $3,700 | $1.76 | 45d | 1 | 1.45mi |
| 431 Gravier St Unit 2 New Orleans, LA | 2.0 | 2.0 | 2100 | $4,000 | $1.90 | 45d | 1 | 1.45mi |
| 433 Gravier St Unit 1 New Orleans, LA | 2.0 | 2.0 | 1400 | $4,000 | $2.86 | 45d | 1 | 1.45mi |
| 232 Decatur St Unit 3D New Orleans, LA | 2.0 | 2.0 | 1268 | $2,900 | $2.29 | 45d | 1 | 1.49mi |
| 713 Camp St #400 New Orleans, LA | 2.0 | 2.0 | 1935 | $4,750 | $2.45 | 45d | 1 | 1.50mi |
Listing history 38 events
-
2026-06-21days on market $184,000 Active 25 DOM
-
2026-06-18days on market $184,000 Active 22 DOM
-
2026-06-17days on market $184,000 Active 21 DOM
-
2026-06-16days on market $184,000 Active 20 DOM
-
2026-06-15days on market $184,000 Active 19 DOM
-
2026-06-13days on market $184,000 Active 17 DOM
-
2026-06-10days on market $184,000 Active 14 DOM
-
2026-06-09days on market $184,000 Active 13 DOM
-
2026-06-08days on market $184,000 Active 12 DOM
-
2026-06-07days on market $184,000 Active 11 DOM
-
2026-06-05days on market $184,000 Active 8 DOM
-
2026-06-03days on market $184,000 Active 7 DOM
-
2026-06-02days on market $184,000 Active 6 DOM
-
2026-06-01days on market $184,000 Active 5 DOM
-
2026-05-31days on market $184,000 Active 4 DOM
-
2026-05-27$184,000 Active 776-char remark
Show marketing remark (776 chars)
HOME FOR SALE NEAR THE HISTORIC MCDONOUGH NEIGHBORHOOD. THE BIG EASY'S 2ND OLDEST NEIGHBORHOOD.. THIS CHARMING RAISED HOME HAS A BLEND OF LOCATION, CHARACTER AND CONVENIENCE. ON A CORNER LOT WITH OFF STREET PARKING, 1615 BODENGER BLVD HAS 3 BEDROOMS, 1.5 BATHS AND A WELCOMING FRONT PORCH FOR RELAXING AND ENJOYING THE NEIGHBORHOOD CHARM. LOCATED ON THE WESTBANK OF THE MISSISSIPPI RIVER, JUST ACROSS THE WATER FROM DOWNTOWN NEW ORLEANS, THIS HOME PLACES YOU MINUTES FROM THE HEART OF THE CITY WHILE STILL OFFERING A NEIGHBORHOOD FEEL, ENJOY EASY ACCESS TO THE RIVER, LOCAL DINING, SHOPPING AND EVERYTHING NEW ORLEANS OFFERS. WHETHER YOU'RE LOOKING FOR YOUR NEXT HOME OR AN INVESTMENT OPPORTUNITY THIS PROPERTY IS FULL OF POTENTIAL IN A LOCATION RICH WITH HISTORY AND CULTURE.
-
2026-05-27$184,000 Active
Show marketing remark (776 chars)
HOME FOR SALE NEAR THE HISTORIC MCDONOUGH NEIGHBORHOOD. THE BIG EASY'S 2ND OLDEST NEIGHBORHOOD.. THIS CHARMING RAISED HOME HAS A BLEND OF LOCATION, CHARACTER AND CONVENIENCE. ON A CORNER LOT WITH OFF STREET PARKING, 1615 BODENGER BLVD HAS 3 BEDROOMS, 1.5 BATHS AND A WELCOMING FRONT PORCH FOR RELAXING AND ENJOYING THE NEIGHBORHOOD CHARM. LOCATED ON THE WESTBANK OF THE MISSISSIPPI RIVER, JUST ACROSS THE WATER FROM DOWNTOWN NEW ORLEANS, THIS HOME PLACES YOU MINUTES FROM THE HEART OF THE CITY WHILE STILL OFFERING A NEIGHBORHOOD FEEL, ENJOY EASY ACCESS TO THE RIVER, LOCAL DINING, SHOPPING AND EVERYTHING NEW ORLEANS OFFERS. WHETHER YOU'RE LOOKING FOR YOUR NEXT HOME OR AN INVESTMENT OPPORTUNITY THIS PROPERTY IS FULL OF POTENTIAL IN A LOCATION RICH WITH HISTORY AND CULTURE.
-
2025-06-09price $168,000
-
2025-06-09price $168,000
-
2025-04-09price $170,000
-
2025-04-09price $170,000
-
2025-03-11$177,900 Active
-
2012-09-25$59,900
-
2012-09-25$59,900
-
2012-03-01$69,900
-
2012-03-01$69,900
-
2011-07-28$74,900
-
2011-07-28$74,900
-
2010-03-29$69,900
-
2010-03-29$69,900
-
2009-08-05$59,900
-
2009-08-05$59,900
-
2009-04-27$69,900
-
2009-04-27$69,900
-
2009-04-15soldstatus $35,000
-
2009-03-06$40,000
-
2009-03-06$40,000
-
1994-06-20soldstatus $15,000
ⓘ Source: listings_history table (triggers on properties + properties_extension) + one-shot
backfill from property_details.listing_events for pre-trigger history.
Tax reassessment forecast LA · Resets to sale price
- Current annual tax
- $1,124 · $94/mo
- Projected year-2 tax
- $1,124 · $94/mo
- Expected delta
- $0/yr ($0/mo · 0.0%)
ⓘ Screening estimate from a state-policy table — verify with the county assessor before closing.
Climate risk First Street
- Flood 9/10 Extreme FEMA zone AE · 99% chance over 30 yrs
- Wildfire 1/10 Low
- Heat 10/10 Extreme 7 d/yr ≥108°F today · 21 d/yr by 30 yrs out
- Wind 10/10 Extreme 99% chance of damaging wind over 30 yrs
- Air quality 2/10 Low 2 unhealthy d/yr today · 2 by 30 yrs out
Nearby sold comps map
Loading sold comps map…
Walkable amenities ~0.75 mi
Loading nearby amenities…
Taxation est. · year 1
- Rental income
- $27,863
- − Mortgage interest
- −$10,307
- − Property taxes
- −$1,124
- − Insurance
- −$6,038
- − Repairs & maintenance
- −$2,229
- − Management
- −$2,229
- − Depreciation
- −$5,353
- Taxable income
- $583
- Est. tax owed @ 24.0%
- −$140
- After-tax cash flow
- $3,130/yr
For passive investors: Depreciation is non-cash, so a rental often shows a tax loss while cash-flowing — sheltering income. Rental losses are passive: they offset passive income freely, and up to $25,000/yr can offset ordinary (W-2) income if you actively participate and your MAGI is under $100k (phasing out to $0 by $150k); unused losses carry forward. On sale, claimed depreciation is recaptured at up to 25%, and gains may owe capital-gains tax (a 1031 exchange can defer both). Figures are a year-1 estimate at your 24.0% rate — not tax advice; consult a CPA.
Schools (NCES district)
- District
- Orleans Parish
- NCES district ID
- 2201170
- Math proficiency
- 11% ▼ -52.00%
- Reading proficiency
- 27% ▼ -46.00%
- Median HH income
- $37,011
- Composite
- 15.78/100
- National rank
- #9271
- State rank
- #69 of 98 in LA
Livability — New Orleans
- Score
- 81/100
- State rank
- #3
- US rank
- #1383
Category grades
Schools grade is shown separately in the Schools card above.
Census & demographics
- Census place
- New Orleans, LA
- County
- Orleans Parish · 338,817 people
- City population
- 338,817
- Metro
- New Orleans-Metairie, LA
- Population (ZIP)
- 22,659
- Household income
- $43,493
- Rent vs Own
- Severe rent burden
- 2240.0
Population outlook (Orleans County) Hauer SSP2
- Today (2025)
- 513,025 people
- By 2030
- 575,781 · +12.2%
- By 2040
- 700,174 · +36.5%
- By 2050
- 826,541 · +61.1%
- By 2075
- 1,123,374 · +119.0%
- By 2100
- 1,355,609 · +164.2%
Race, ethnicity, and origin ACS 2023
- Neighborhood character
- Predominantly Black (72%)
- Race & ethnicity
- Black 72% White 16% Hispanic / Latino 8% Two or more races 5%
- Hispanic origin (detail)
- Mexican 2% Puerto Rican 1%
- Common ancestry
- Lithuanian 3% Slovak 1% Italian 1%
- Foreign-born
- 5% · Canada
- Languages at home
- 91% English-only · Spanish 6% French/Haitian/Cajun 2% Other Indo-European 1%
Political lean MEDSL · Orleans
- 2024 margin
- Solid D (+67.0) · D 82.2% · R 15.2% · Other 2.7%
- 2008→2024 swing
- +6.7pp toward D · 2008: 60.3pp · 2024: 67.0pp
- All cycles
- 2024: D+67.0 2020: D+68.2 2016: D+66.2 2012: D+62.5 2008: D+60.3
Not yet ingested
- Civics
- —
Market trends
- HPI YoY
- ▼ -98.56%
- Current HPI
- 149.0172
- Rent YoY
- ▼ -0.72%
- Metro
- New Orleans-Metairie, LA
- State GDP YoY
- ▲ 3.29%
- F500 in state
- 10
Industry mix (Fortune 500 HQ in LA)
| Industry | F500 HQs | Revenue |
|---|---|---|
| Telecommunications | 2 | $23B |
|
||
| Utilities | 1 | $12B |
|
||
| Wholesale / Distribution | 1 | $5B |
|
||
| Advertising | 1 | $2B |
|
||
Price history
+1126.7% since first listed23 events — show timeline
- 2026-05-27 Listed $184,000 GSREIN
- 2026-05-27 Listed $184,000 AcadianaMLS
- 2025-06-09 Price Changed $168,000 AcadianaMLS
- 2025-06-09 Price Changed $168,000 GSREIN
- 2025-04-09 Price Changed $170,000 AcadianaMLS
- 2025-04-09 Price Changed $170,000 GSREIN
- 2025-03-11 Listed $177,900 AcadianaMLS
- 2012-09-25 Listed $59,900 GSREIN
- 2012-09-25 Listed $59,900 AcadianaMLS
- 2012-03-01 Listed $69,900 GSREIN
- 2012-03-01 Listed $69,900 AcadianaMLS
- 2011-07-28 Listed $74,900 GSREIN
- 2011-07-28 Listed $74,900 AcadianaMLS
- 2010-03-29 Listed $69,900 GSREIN
- 2010-03-29 Listed $69,900 AcadianaMLS
- 2009-08-05 Listed $59,900 GSREIN
- 2009-08-05 Listed $59,900 AcadianaMLS
- 2009-04-27 Listed $69,900 GSREIN
- 2009-04-27 Listed $69,900 AcadianaMLS
- 2009-04-15 Sold (MLS) $35,000 GSREIN
- 2009-03-06 Listed $40,000 GSREIN
- 2009-03-06 Listed $40,000 AcadianaMLS
- 1994-06-20 Sold (Public Records) $15,000 Public Records
Property tax history
-4.1%/yrLatest (2026): $1,124 · +25.1% YoY. Source: county tax records.
Cash-flow waterfall
monthlySold comps — $/sqft
last 12 mo · ≤1 miLoading sold comps…