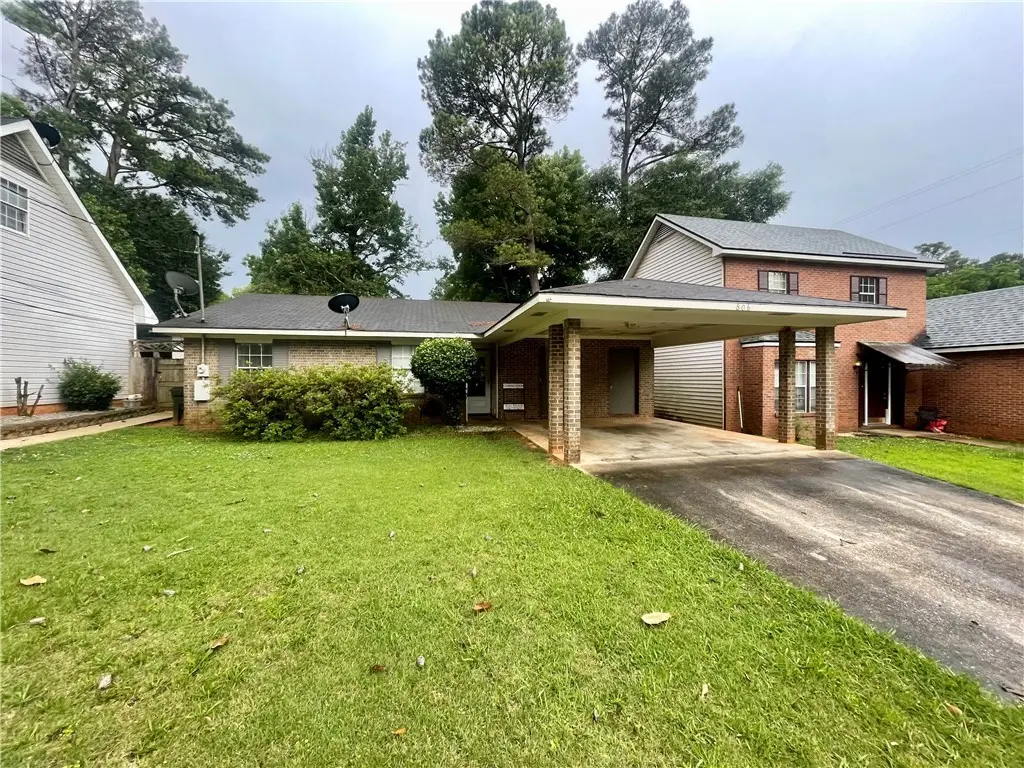
806 Choctaw Ave · Auburn, AL
Flood risk 1/10 · Minimal
- FEMA flood zone
- X (unshaded)
- Chance of flooding over 30 yrs
- 0.0%
- Est. flood insurance / yr
- $507 – $1,088
Fire risk 1/10 · Minimal
- Est. fire insurance / yr
- $916 – $1,700
Heat risk 6/10 · Moderate
- Hot days now (above 104°F)
- 7 days/yr
- Hot days in 30 yrs
- 20 days/yr
Wind risk 6/10 · Moderate
- Chance of severe wind over 30 yrs
- 68.0%
Air-quality risk 2/10 · Minimal
- Unhealthy air days now
- 1 days/yr
- Unhealthy air days in 30 yrs
- 1 days/yr
Risk factors via First Street. Map © Google.
Why this score? — see what drove the D grade
The composite is a weighted blend of 9 inputs, each scored 0–100. Each bar is that input's sub-score; the figure is the points it added to the 100-point composite (weight × sub-score).
- Cash flow +11.3/30.0
- ARV discount +10.4/15.0
- Schools +5.0/10.0
- Livability +4.0/5.0
- Rent growth +3.8/5.0
- DSCR +3.3/10.0
- 1% rule +2.6/10.0
- Condition / age +2.5/5.0
- Appreciation +0.0/10.0
$249,000
🖨 Deal sheet 📄 Offer letter ✓ Due diligence
Listing remarks
Come see this charming 3 bedroom 2 bath all brick home right in heart of Auburn. This home features a double carport, fenced in backyard, and a tiled sunroom right off the back, perfect for entertaining friends and family. No carpet! Step inside to discover an inviting living space filled with natural light and functional layout ideal for everyday living. This property boast a generous yard with mature landscaping, providing plenty of room to relax, garden, or enjoy outdoor gatherings. Come see this lovely home today!
Key facts
- 5,227 sq ft lot
- 2 parking spots
- Built 1985
Property features AI
Finance
- Other: Subdivision: SHELTON PARK; Zoning: DDH; Directions: From Shug Jordan Pkwy toward the Auburn Mall, turn right onto Dekalb Street then left on Choctaw Ave; house on the right.
- HOA & community: No association amenities
Exterior
- Parking: 2-space carport
- Utilities: Cable available; Electricity available; Water available; Sewer connected
- Home design: One-story residence; Residential property
- Construction: Brick veneer and clapboard exterior; Slab foundation
- Exterior features: Rear covered screened porch; Porch; Storage; Privacy fencing in back yard
Interior
- Kitchen: Cooktop; Electric range; Dishwasher; Disposal; Refrigerator
- Bedrooms: Total rooms: 7
- Flooring: Simulated wood; Tile
- Bathrooms: 2 full bathrooms (both on the main level)
- Heating & cooling: Heat pump heating; Heat pump cooling; Ceiling fan(s)
- Interior features: Ceiling fans; Wood-burning fireplace; Storage
- Laundry & utility: Washer hookup
Neighborhood map
What this means for you Summary
Snapshot
- This is a 3-bed/1.0-bath single-family listed at $249k.
Deal economics
- At list price, monthly cash flow is $-90 ($-1k/yr) — negative.
- To cash-flow at today's rent, offer at most $233k (6.4% below list).
- To meet the 1% rule (rent ≥ 1% of price), the offer needs to be $189k (24.2% below list).
- Recommended offer: $189k (24.2% below list) — sets the bar for 1% rule.
- Cap rate 5.9% vs local median 2.7% in Auburn — top-decile yield for the area; either an underpriced asset or a hidden risk that comps aren't pricing in. Stress-test before assuming the spread holds.
Location & tenants
- Location reads 80/100 on livability (#6 in AL, #1,842 nationally) — a professional / high-income tenant draw. Strengths: crime A+, amenities A+, health & safety A+; Watch: commute F.
- Auburn City (urban): math 51% / reading 69% proficiency, ranked #7 of 129 in AL (top 5%) — acceptable for families but not a draw, mixed tenant base, ~2y average lease.
- Market conditions: Rents rising fast (+5.4%/yr); 899 active listings in the ZIP; 19 comparable units currently listed for rent nearby; rentals lingering (median 44d on market — plan ~5-8 weeks vacancy on turnover, expect pricing pressure); 53% of comp listings sitting > 30 days — soft ceiling on asking rent; 1,858 units permitted in Lee County in 2024 (113 in 5+ unit buildings).
- This rent runs 32% of the median local income ($70k/yr) — at the standard rent-burdened threshold; future hikes will face affordability resistance.
Forward outlook
- Local home prices are declining (-3.0%/yr); year-one equity from $2k of loan paydown is wiped out by about $7k of value loss. Plan a longer hold.
- Lee County population projected at +54% by 2050 — long-run rental-demand tailwind backs the buy-and-hold thesis.
Negotiation context
- Only 7 days on market — expect competitive offers; lowballing is unlikely to land.
Risks & watch-outs
- Climate carrying-cost: major wind risk, 68% chance of damaging wind over 30y; extreme-heat days projected 7→20/yr by 2055 (HVAC capex compounding) — expect insurance premiums to compound above CPI over the hold.
Questions for the listing agent
- What do current leases actually rent for vs. the listed asking? Can we see a recent rent roll and the last 12 months of T-12 income?
- Is there a deadline driving the sale (1031 exchange, divorce, estate, relocation)? That informs how much negotiation room exists.
- Schools are A-rated — typically a magnet for longer-tenancy family renters. What's the average tenant stay here, and is there a school-zone premium baked into asking?
- The area grade is low — what's the realistic commute time and amenity access for the typical tenant pool here? Any planned neighborhood developments (good or bad) we should know about?
- What's the average days-on-market for RENTAL listings here right now (not sales)? A rising rental-DOM trend means longer vacancies and softer asking-rent achievability than the comps imply.
- What's the recent tenant-quality profile in this submarket — average credit score on applications, eviction rate, late-payment / NSF rate, and stable-employment percentage? A property-management company in the area should have these aggregated.
- How much new for-sale + rental construction is in the pipeline within 1–3 miles? Heavy new supply typically softens prices + rents 12–24 months out; constrained supply supports both.
Investment metrics
- 1% rule
- 0.76% ✗
- Cap rate
- 5.86%
- Cash-on-cash
- -1.54%
- DSCR
- 0.93
- GRM
- 11.0
CMA / ARV
- ARV (on-the-fly)
- $266,304
- Comps found
- 12
Show comp detail 12 sales within ~0.75 mi
| Address | Dist | Beds/Ba | Sqft | Sold | Price | $/sf | Match |
|---|---|---|---|---|---|---|---|
| 826 Cheyenne Ave | 0.10mi | 3/2.0 | 1,232 (+1%) | 6mo | $250,000 | $203 | 84 |
| 900 Hollins Rd | 0.31mi | 3/2.0 | 1,205 (-1%) | 4mo | $260,000 | $216 | 77 |
| 770 Whitaker Ln | 0.34mi | 3/2.0 | 1,196 (-2%) | 7mo | $250,000 | $209 | 71 |
| 832 Twin Forks Ave | 0.23mi | 2/2.0 (-1) | 1,158 (-5%) | 4mo | $250,000 | $216 | 69 |
| 764 Bruce Ct | 0.27mi | 2/2.0 (-1) | 1,170 (-4%) | 7mo | $260,000 | $222 | 66 |
| 1010 Dekalb St | 0.18mi | 2/2.0 (-1) | 1,144 (-6%) | 8mo | $251,000 | $219 | 66 |
| 1156 Overwood Ct | 0.47mi | 3/2.0 | 1,333 (+10%) | 2mo | $299,000 | $224 | 57 |
| 944 Sandstone Ln | 0.65mi | 3/2.0 | 1,295 (+6%) | 1mo | $300,000 | $232 | 54 |
| 889 Hollins Rd | 0.30mi | 3/2.0 | 1,369 (+13%) | 8mo | $291,000 | $213 | 54 |
| 356 Embry Ln | 0.69mi | 3/2.0 | 1,140 (-6%) | 10mo | $295,000 | $259 | 45 |
| 1008 Gentry Dr | 0.51mi | 4/2.0 (+1) | 1,350 (+11%) | 9mo | $240,000 | $178 | 41 |
| 333 Tullahoma Dr | 0.59mi | 3/2.0 | 1,371 (+13%) | 10mo | $315,000 | $230 | 39 |
Match score weights: distance 35% · size 25% · config 20% · recency 20%. Top-matched comps best support the ARV.
Projected returns pro-forma
-3.0% appreciation · 5.36% rent growth · sell at horizon
- IRR
- -16.5%
- Equity multiple
- 0.40×
- Total profit
- $-41,526
- Equity at exit
- $37,127
- IRR
- -4.8%
- Equity multiple
- 0.66×
- Total profit
- $-23,997
- Equity at exit
- $21,529
Cash invested: $69,720 (down + closing). Projections, not guarantees.
Landlord ↔ Tenant lean methodology
- Overall (STATE)
- 90 Strongly Landlord-Friendly
- State Alabama
- 90 Strongly Landlord-Friendly · R+15
- County
- — inherits STATE
- City
- — inherits STATE
ZIP-level market 36830
- Rents YoY
- 5.4%
- Active inventory
- 899
- Price-to-rent
- 11.0×
Monthly cashflow live
- Estimated rent
- $1,886 high interval (Pro) →
- Mortgage (P&I)
- −$1,306
- Tax from tax record
- −$170 /mo · $2,042/yr
- Insurance
- −$104
- HOA
- −$0
- Vacancy / Maint / Mgmt
- −$396
- Net cashflow
- $-90
Break-even live
UW: 25.0% down · 7.5% · 30yr · 1.5% tax · 5.0% vac · 8.0% maint · 8.0% mgmt
Financing live
Cash to close
- Down payment
- $62,250
- Closing costs
- $7,470
- Reserves months
- —
- Total cash needed
- —
Loan-product check · same deal, 3 products live
Conventional
25% down · 7.5% · 30yr
- Down + closing
- —
- Monthly P&I
- —
- Monthly cashflow
- —
- DSCR
- —
- Eligible?
- —
Personal DTI + credit; lowest rate.
DSCR
20% down · 8.5% · 30yr
- Down + closing
- —
- Monthly P&I
- —
- Monthly cashflow
- —
- DSCR
- —
- Eligible?
- —
No personal income docs; deal must DSCR.
Hard money
10% down · 12.0% · 12mo
- Down + closing
- —
- Monthly P&I
- —
- Monthly cashflow
- —
- DSCR
- —
- Eligible?
- —
Short-term bridge; refi at stabilization.
Rent comps 19 comps
| Address | Beds | Baths | Sqft | Rent | $/sqft | DOM | Units | Dist |
|---|---|---|---|---|---|---|---|---|
| 846 Choctaw Ave Auburn, AL | 3.0 | 2.0 | 1158 | $1,600 | $1.38 | 43d | 1 | 0.06mi |
| 807 Harvard Dr Auburn, AL | 2.0 | 2.5 | 1273 | $1,600 | $1.26 | 43d | 1 | 0.57mi |
| 650 DeKalb St Auburn, AL | 2.0–3.0 | 2.5–3.0 | 1326 | $2,800 | $2.11 | 43d | 1 | 0.61mi |
| 2260 E University Dr Auburn, AL | 1.0–2.0 | 1.0–2.0 | 777 | $1,264 | $1.63 | 13d | 8 | 0.68mi |
| 555 N Dean Rd Auburn, AL | 2.0 | 2.0 | 1235 | $1,625 | $1.32 | 43d | 1 | 0.73mi |
| 555 N Dean Rd Auburn, AL | 1.0–2.0 | 1.0–2.0 | 895 | $1,495 | $1.67 | 21d | 1 | 0.73mi |
| 675 Nissa Ct Auburn, AL | 3.0 | 3.0 | 1500 | $1,850 | $1.23 | 43d | 1 | 0.75mi |
| 640 N Ross St Auburn, AL | 1.0–3.0 | 1.0–3.0 | 927 | $1,775 | $1.91 | 13d | 1 | 0.88mi |
| 1365 Gatewood Dr Unit W-302 Auburn, AL | 2.0 | 1.0 | 977 | $1,650 | $1.69 | 13d | 1 | 0.92mi |
| 420 N Dean Rd Auburn, AL | 1.0–3.0 | 1.0–2.0 | 840 | $1,575 | $1.88 | 13d | 1 | 0.99mi |
| 374 Cherry St Auburn, AL | 3.0 | 2.0 | 1460 | $2,400 | $1.64 | 21d | 1 | 1.09mi |
| 601 N Gay St Auburn, AL | 2.0 | 2.0 | 1150 | $1,700 | $1.48 | 43d | 1 | 1.09mi |
| 535 Heritage Ct Auburn, AL | 2.0 | 3.0 | 1150 | $3,500 | $3.04 | 43d | 1 | 1.21mi |
| 720 Harper Ave Auburn, AL | 4.0 | 2.0 | 1320 | $2,800 | $2.12 | 43d | 1 | 1.22mi |
| 427 Harper Ave Auburn, AL | 2.0 | 2.0 | 1136 | $1,400 | $1.23 | 43d | 1 | 1.25mi |
| 507 E Glenn Ave Auburn, AL | 2.0 | 1.0 | 876 | $1,250 | $1.43 | 13d | 1 | 1.38mi |
| 516 E Glenn Ave Auburn, AL | 1.0–2.0 | 1.0–2.0 | 775 | $1,495 | $1.93 | 13d | 1 | 1.42mi |
| Ross Park 3/3 Duplex Auburn, AL | 3.0 | 3.0 | 1448 | $1,762 | $1.22 | 13d | 3 | 1.45mi |
| Ross Park 3/3 TH Auburn, AL | 3.0 | 3.0 | 1495 | $1,575 | $1.05 | 43d | 1 | 1.49mi |
Listing history 14 events
-
2026-06-18days on market $249,000 Active 7 DOM
-
2026-06-17days on market $249,000 Active 6 DOM
-
2026-06-16days on market $249,000 Active 5 DOM
-
2026-06-15days on market $249,000 Active 4 DOM
-
2026-06-14days on market $249,000 Active 2 DOM
-
2026-06-13statusdays on market $249,000 Active 1 DOM
-
2026-06-10days on market $249,000 Coming Soon 8 DOM
-
2026-06-09days on market $249,000 Coming Soon 7 DOM
-
2026-06-08days on market $249,000 Coming Soon 6 DOM
-
2026-06-07days on market $249,000 Coming Soon 5 DOM
-
2026-06-05days on market $249,000 Coming Soon 2 DOM
-
2026-06-03remarks 524-char remark
-
2026-06-03remarks 518-char remark
-
2026-06-03$249,000 Coming Soon 1 DOM
ⓘ Source: listings_history table (triggers on properties + properties_extension) + one-shot
backfill from property_details.listing_events for pre-trigger history.
Tax reassessment forecast AL · Resets to sale price
- Current annual tax
- $2,042 · $170/mo
- Projected year-2 tax
- $2,042 · $170/mo
- Expected delta
- $0/yr ($0/mo · 0.0%)
ⓘ Screening estimate from a state-policy table — verify with the county assessor before closing.
Climate risk First Street
- Flood 1/10 Low FEMA zone X (unshaded) · 0% chance over 30 yrs
- Wildfire 1/10 Low
- Heat 6/10 Major 7 d/yr ≥104°F today · 20 d/yr by 30 yrs out
- Wind 6/10 Major 68% chance of damaging wind over 30 yrs
- Air quality 2/10 Low 1 unhealthy d/yr today · 1 by 30 yrs out
Nearby sold comps map
Loading sold comps map…
Walkable amenities ~0.75 mi
Loading nearby amenities…
Taxation est. · year 1
- Rental income
- $22,635
- − Mortgage interest
- −$13,948
- − Property taxes
- −$2,042
- − Insurance
- −$1,245
- − Repairs & maintenance
- −$1,811
- − Management
- −$1,811
- − Depreciation
- −$7,244
- Taxable loss
- −$5,465
- Est. tax savings @ 24.0%
- +$1,312
- After-tax cash flow
- $237/yr
For passive investors: Depreciation is non-cash, so a rental often shows a tax loss while cash-flowing — sheltering income. Rental losses are passive: they offset passive income freely, and up to $25,000/yr can offset ordinary (W-2) income if you actively participate and your MAGI is under $100k (phasing out to $0 by $150k); unused losses carry forward. On sale, claimed depreciation is recaptured at up to 25%, and gains may owe capital-gains tax (a 1031 exchange can defer both). Figures are a year-1 estimate at your 24.0% rate — not tax advice; consult a CPA.
Schools (NCES district)
- District
- Auburn City
- NCES district ID
- 0100210
- Math proficiency
- 51% ▼ -21.00%
- Reading proficiency
- 69% ▲ 5.00%
- Median HH income
- $38,126
- Composite
- 49.87/100
- National rank
- #1944
- State rank
- #7 of 129 in AL
Livability — Auburn
- Score
- 80/100
- State rank
- #6
- US rank
- #1842
Category grades
Schools grade is shown separately in the Schools card above.
Census & demographics
- Census place
- Auburn, AL
- County
- Lee County · 144,175 people
- City population
- 80,251
- Metro
- Auburn-Opelika, AL
- Population (ZIP)
- 49,292
- Household income
- $70,188
- Rent vs Own
- Severe rent burden
- 2961.0
Population outlook (Lee County) Hauer SSP2
- Today (2025)
- 196,440 people
- By 2030
- 217,417 · +10.7%
- By 2040
- 259,467 · +32.1%
- By 2050
- 301,557 · +53.5%
- By 2075
- 402,186 · +104.7%
- By 2100
- 474,503 · +141.6%
Race, ethnicity, and origin ACS 2023
- Neighborhood character
- Predominantly White (70%)
- Race & ethnicity
- White 70% Black 14% Asian 10% Hispanic / Latino 4% Two or more races 3%
- Common ancestry
- Slovak 4% Italian 3% Serbian 2%
- Foreign-born
- 11% · South Korea, Canada, China
- Languages at home
- 87% English-only · Korean 4% Spanish 3% Chinese 2%
Political lean MEDSL · Lee
- 2024 margin
- Strong R (+27.8) · D 35.5% · R 63.3% · Other 1.2%
- 2008→2024 swing
- -8.1pp toward R · 2008: -19.8pp · 2024: -27.8pp
- All cycles
- 2024: R+27.8 2020: R+20.1 2016: R+23.1 2012: R+19.9 2008: R+19.8
Not yet ingested
- Civics
- —
Market trends
- HPI YoY
- ▼ -156.53%
- Current HPI
- 270.6646
- Rent YoY
- ▲ 5.36%
- Metro
- Auburn-Opelika, AL
- State GDP YoY
- ▲ 2.94%
- F500 in state
- 4
Industry mix (Fortune 500 HQ in AL)
| Industry | F500 HQs | Revenue |
|---|---|---|
| Financial Services | 1 | $8B |
|
||
| Healthcare | 1 | $5B |
|
||
Price history
1 event — show timeline
- 2026-06-02 Coming Soon $249,000 LCMLS
Property tax history
+5.4%/yrLatest (2025): $2,042 · +7.0% YoY. Source: county tax records.
Cash-flow waterfall
monthlySold comps — $/sqft
last 12 mo · ≤1 miLoading sold comps…