 Duplex
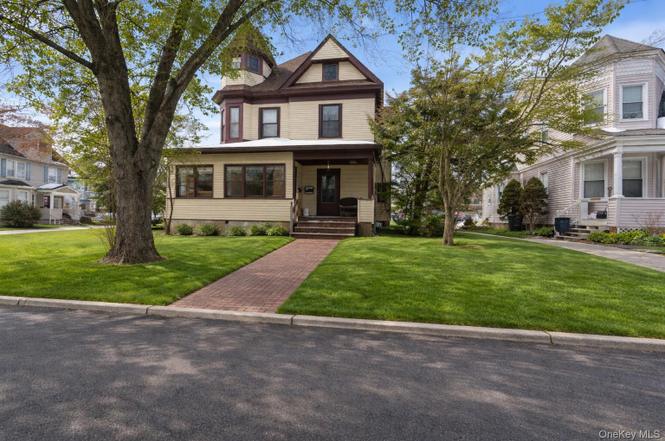
57 Park Ave · Suffern, NY
Flood risk 1/10 · Minimal
- FEMA flood zone
- X (unshaded)
- Chance of flooding over 30 yrs
- 0.0%
- Est. flood insurance / yr
- $473 – $860
Fire risk 5/10 · Moderate
- Est. fire insurance / yr
- $691 – $1,283
Heat risk 6/10 · Moderate
- Hot days now (above 98°F)
- 7 days/yr
- Hot days in 30 yrs
- 16 days/yr
Wind risk 4/10 · Minor
- Chance of severe wind over 30 yrs
- 22.0%
Air-quality risk 3/10 · Minor
- Unhealthy air days now
- 2 days/yr
- Unhealthy air days in 30 yrs
- 3 days/yr
Risk factors via First Street. Map © Google.
Why this score? — see what drove the D+ grade
The composite is a weighted blend of 9 inputs, each scored 0–100. Each bar is that input's sub-score; the figure is the points it added to the 100-point composite (weight × sub-score).
- ARV discount +13.1/15.0
- Cash flow +12.5/30.0
- Schools +5.1/10.0
- 1% rule +5.0/10.0
- DSCR +3.7/10.0
- Livability +3.4/5.0
- Rent growth +2.5/5.0
- Condition / age +2.5/5.0
- Appreciation +0.0/10.0
$675,000
🖨 Deal sheet (PDF) 📄 Offer letter ✓ Due diligence
Multi-family units
County records classify this as Multi-Family (2-4 Unit). Listing-text estimate: 2 units. confirmed
Listing remarks
Grab it before it’s gone! Prime corner property in the heart of Suffern, just a short walk to shopping and the train. This legal two-family offers incredible income potential with separate interior entrance. The first level features a massive kitchen, sun-filled dinette, spacious living room, and two oversized bedrooms full of windows. Upstairs boasts four bedrooms, a beautiful kitchen, and a deck with stunning mountain views. Huge driveway fits 10+ cars plus a 2-car garage. Endless possibilities for investors or end-users looking to generate extra income!
Key facts
- Oversized bedrooms
- Sun-filled dinette
- Corner property
Tags
Neighborhood map
What this means for you Summary
Snapshot
- This is a 2 × 3-bed/1.0-bath units multifamily listed at $675k.
Deal economics
- At list price, monthly cash flow is $-95 ($-1k/yr) — negative. Per door: $-48/mo.
- To cash-flow at today's rent, offer at most $658k (2.5% below list).
- Meets the 1% rule at list price ($7k rent vs $675k).
- Recommended offer: $658k (2.5% below list) — sets the bar for cash-flow.
- Cap rate 6.1% vs local median 3.2% in Suffern — top-decile yield for the area; either an underpriced asset or a hidden risk that comps aren't pricing in. Stress-test before assuming the spread holds.
Location & tenants
- Location reads 68/100 on livability (#546 in NY) — a middle-class / working-renter tenant base. Strengths: employment A+, housing A+; Watch: amenities F, commute F, cost of living F.
- Suffern Central School District (suburban): math 53% / reading 59% proficiency, ranked #242 of 590 in NY (top 41%) — acceptable for families but not a draw, mixed tenant base, ~2y average lease; only 18% free/reduced lunch — higher-income household profile.
- Zoned schools: Richard P Connor Elementary School (math 42% / reading 62%, grade C-, #988 of 2,108 statewide, top 49%, 383 students, 0% FRL); Suffern Middle School (math 30% / reading 56%, grade D-, #370 of 729 statewide, top 51%, 836 students, 38% FRL); Suffern Senior High School (math 96% / reading 95%, grade A+, #76 of 1,100 statewide, top 7%, 1,486 students, 31% FRL).
- Market conditions: 230 active listings in the ZIP; 1 comparable units currently listed for rent nearby; solid renter incomes; 429 units permitted in Rockland County in 2024 (231 in 5+ unit buildings).
- At $6,755/mo this rent would consume 75% of the median local household income ($108k/yr) (locally 828% of renters already pay >50% of income on rent) — very limited rent-growth headroom before tenants either downsize or default.
Forward outlook
- Local home prices are declining (-3.0%/yr); year-one equity from $5k of loan paydown is wiped out by about $20k of value loss. Plan a longer hold.
- Rockland County population projected at +7% by 2050 — modest demand growth; plan on rents tracking national, not racing it.
Negotiation context
- It's been on market 16 days — a 2% lower offer ($665k) is reasonable based on typical stale-listing flexibility.
- 5 sale attempts since 13y ago with the ask held roughly flat each time — persistent listings suggest the price (not the market) is what's stuck; bring a comps-based counter.
- Current owner paid $370k; list at $675k implies a 82% gain — meaningful room to come down on a strong offer.
Risks & watch-outs
- Watch-outs: property tax is 2.9% of price; built in 1900 — expect roof / HVAC / electrical / plumbing capex.
- Climate carrying-cost: moderate wildfire risk; extreme-heat days projected 7→16/yr by 2055 (HVAC capex compounding) — expect insurance premiums to compound above CPI over the hold.
Questions for the listing agent
- What do current leases actually rent for vs. the listed asking? Can we see a recent rent roll and the last 12 months of T-12 income?
- Can we see the unit-by-unit rent roll, current vacancy, and any below-market leases? What's the average tenancy length?
- What capital expenditures (roof, boiler, parking lot, exteriors) have been made in the last 5 years, and what's planned in the next 2?
- Built in 1900 — when were the roof, HVAC, electrical panel, plumbing, and water heater last replaced?
- Property tax is high relative to price — has the assessment been appealed recently, and will the sale trigger a re-assessment?
- Is there a deadline driving the sale (1031 exchange, divorce, estate, relocation)? That informs how much negotiation room exists.
- Schools are B-rated — typically a magnet for longer-tenancy family renters. What's the average tenant stay here, and is there a school-zone premium baked into asking?
- The area grade is low — what's the realistic commute time and amenity access for the typical tenant pool here? Any planned neighborhood developments (good or bad) we should know about?
- What's the average days-on-market for RENTAL listings here right now (not sales)? A rising rental-DOM trend means longer vacancies and softer asking-rent achievability than the comps imply.
- What's the recent tenant-quality profile in this submarket — average credit score on applications, eviction rate, late-payment / NSF rate, and stable-employment percentage? A property-management company in the area should have these aggregated.
- How much new apartment / multifamily construction is in the pipeline within 1–3 miles? Heavy new supply (>2% of stock underway) typically softens rents 12–24 months out; light construction supports rent growth.
Investment metrics
- 1% rule
- 1.00% ✓
- Cap rate
- 6.12%
- Cash-on-cash
- -0.60%
- DSCR
- 0.97
- GRM
- 8.3
CMA / ARV
- ARV (on-the-fly)
- $770,715
- Comps found
- 4
Show comp detail 4 sales within ~0.75 mi
| Address | Dist | Beds/Ba | Sqft | Sold | Price | $/sf | Match |
|---|---|---|---|---|---|---|---|
| 88 Washington Ave | 0.18mi | 6/4.0 | 2,310 (-11%) | 1mo | $850,000 | $368 | 65 |
| 62 Ramapo Ave | 0.23mi | 5/3.0 (-1) | 2,675 (+3%) | 15mo | $605,000 | $226 | 63 |
| 36 Wayne Ave | 0.35mi | 6/3.0 | 2,809 (+8%) | 12mo | $750,000 | $267 | 56 |
| 22 Riverside Dr | 0.40mi | 6/4.0 | 2,944 (+13%) | 21mo | $875,000 | $297 | 34 |
Match score weights: distance 35% · size 25% · config 20% · recency 20%. Top-matched comps best support the ARV.
Projected returns pro-forma
-3.0% appreciation · 3.0% rent growth · sell at horizon
- IRR
- -17.2%
- Equity multiple
- 0.39×
- Total profit
- $-114,860
- Equity at exit
- $100,645
- IRR
- -9.0%
- Equity multiple
- 0.44×
- Total profit
- $-105,486
- Equity at exit
- $58,362
Cash invested: $189,000 (down + closing). Projections, not guarantees.
Landlord ↔ Tenant lean methodology
- Overall (STATE)
- 15 Strongly Tenant-Friendly
- State New York
- 15 Strongly Tenant-Friendly · D+10
- County
- — inherits STATE
- City
- — inherits STATE
ZIP-level market 10901
- Active inventory
- 230
- Price-to-rent
- 16.7×
Monthly cashflow live
- Estimated rent
- $6,755 high interval (Pro) →
- Mortgage (P&I)
- −$3,540
- Tax from tax record
- −$1,610 /mo · $19,326/yr
- Insurance
- −$281
- HOA
- −$0
- Vacancy / Maint / Mgmt
- −$1,419
- Net cashflow
- $-95
Break-even live
Sensitivity live
| Price | -10% $287 | -5% $96 | +0% $-95 | +5% $-286 | +10% $-477 |
|---|---|---|---|---|---|
| Rent | -10% $-629 | -5% $-362 | +0% $-95 | +5% $172 | +10% $439 |
| Rate | -1.0pp $245 | -0.5pp $77 | base $-95 | +0.5pp $-270 | +1.0pp $-448 |
2-unit breakdown (identical units grouped — click to expand)
| Units | Beds | Baths | Est. rent |
|---|---|---|---|
| 2× units | 3 | 1 | $6,756 |
| #1 | 3 | 1 | $3,378 |
| #2 | 3 | 1 | $3,378 |
| Total (2 units) | $6,755 | ||
UW: 25.0% down · 7.5% · 30yr · 1.5% tax · 5.0% vac · 8.0% maint · 8.0% mgmt
Financing live
Cash to close
- Down payment
- $168,750
- Closing costs
- $20,250
- Reserves months
- —
- Total cash needed
- —
Loan-product check · same deal, 3 products live
Conventional
25% down · 7.5% · 30yr
- Down + closing
- —
- Monthly P&I
- —
- Monthly cashflow
- —
- DSCR
- —
- Eligible?
- —
Personal DTI + credit; lowest rate.
DSCR
20% down · 8.5% · 30yr
- Down + closing
- —
- Monthly P&I
- —
- Monthly cashflow
- —
- DSCR
- —
- Eligible?
- —
No personal income docs; deal must DSCR.
Hard money
10% down · 12.0% · 12mo
- Down + closing
- —
- Monthly P&I
- —
- Monthly cashflow
- —
- DSCR
- —
- Eligible?
- —
Short-term bridge; refi at stabilization.
Rent comps 1 comps
| Address | Beds | Baths | Sqft | Rent | $/sqft | DOM | Units | Dist |
|---|---|---|---|---|---|---|---|---|
| 10 Millbury St Suffern, NY | 6.0 | 2.5 | 2578 | $6,500 | $2.52 | 45d | 1 | 1.25mi |
Listing history 15 events
-
2026-03-06status Pending
-
2026-02-17price $675,000
-
2026-02-15$699,000 Active
-
2021-10-05historical
-
2021-07-28historical
-
2021-05-30$509,000 Active
-
2021-03-26price $509,000
-
2021-03-05$489,000 Active
-
2013-09-19soldstatus $370,000
-
2013-09-19soldstatus $370,000
-
2013-09-19soldstatus $370,000
-
2013-03-27historical
-
2013-03-27price $389,000
-
2013-02-05$389,000
-
2013-02-05$370,000
ⓘ Source: listings_history table (triggers on properties + properties_extension) + one-shot
backfill from property_details.listing_events for pre-trigger history.
Tax reassessment forecast NY · Partial reset (capped growth)
- Current annual tax
- $19,326 · $1,610/mo
- Projected year-2 tax
- $19,326 · $1,610/mo
- Expected delta
- $0/yr ($0/mo · 0.0%)
ⓘ Screening estimate from a state-policy table — verify with the county assessor before closing.
Climate risk First Street
- Flood 1/10 Low FEMA zone X (unshaded) · 0% chance over 30 yrs
- Wildfire 5/10 Major
- Heat 6/10 Major 7 d/yr ≥98°F today · 16 d/yr by 30 yrs out
- Wind 4/10 Moderate 22% chance of damaging wind over 30 yrs
- Air quality 3/10 Moderate 2 unhealthy d/yr today · 3 by 30 yrs out
Nearby sold comps map
Loading sold comps map…
Walkable amenities ~0.75 mi
Loading nearby amenities…
Taxation est. · year 1
- Rental income
- $81,060
- − Mortgage interest
- −$37,810
- − Property taxes
- −$19,326
- − Insurance
- −$3,375
- − Repairs & maintenance
- −$6,485
- − Management
- −$6,485
- − Depreciation
- −$19,636
- Taxable loss
- −$12,057
- Est. tax savings @ 24.0%
- +$2,894
- After-tax cash flow
- $1,753/yr
For passive investors: Depreciation is non-cash, so a rental often shows a tax loss while cash-flowing — sheltering income. Rental losses are passive: they offset passive income freely, and up to $25,000/yr can offset ordinary (W-2) income if you actively participate and your MAGI is under $100k (phasing out to $0 by $150k); unused losses carry forward. On sale, claimed depreciation is recaptured at up to 25%, and gains may owe capital-gains tax (a 1031 exchange can defer both). Figures are a year-1 estimate at your 24.0% rate — not tax advice; consult a CPA.
Schools (NCES district)
- District
- Suffern Central School District
- NCES district ID
- 3628320
- Math proficiency
- 53% ▼ -17.00%
- Reading proficiency
- 59% ▼ -4.00%
- Median HH income
- $85,871
- Composite
- 51.17/100
- National rank
- #1758
- State rank
- #242 of 590 in NY
Livability — Suffern
- Score
- 68/100
- State rank
- #546
- US rank
- #9788
Category grades
Schools grade is shown separately in the Schools card above.
Census & demographics
- Census place
- Suffern, NY
- County
- Rockland County · 98,828 people
- Metro
- New York-Newark-Jersey City, NY-NJ-PA
- Population (ZIP)
- 27,095
- Household income
- $108,041
- Rent vs Own
- Severe rent burden
- 828.0
Population outlook (Rockland County) Hauer SSP2
- Today (2025)
- 339,642 people
- By 2030
- 345,987 · +1.9%
- By 2040
- 357,178 · +5.2%
- By 2050
- 362,456 · +6.7%
- By 2075
- 367,281 · +8.1%
- By 2100
- 328,211 · -3.4%
Race, ethnicity, and origin ACS 2023
- Neighborhood character
- Predominantly White (69%)
- Race & ethnicity
- White 69% Hispanic / Latino 13% Black 10% Two or more races 6% Asian 5%
- Hispanic origin (detail)
- Mexican 5% Puerto Rican 3% Dominican 2%
- Common ancestry
- Romanian 8% Scotch-Irish 4% Hispanic 4%
- Foreign-born
- 18% · Canada, China, South Korea
- Languages at home
- 69% English-only · Spanish 10% German/W. Germanic 5% French/Haitian/Cajun 3%
Political lean MEDSL · Rockland
- 2024 margin
- R (+11.8) · D 44.1% · R 55.9%
- 2008→2024 swing
- -17.7pp toward R · 2008: 5.9pp · 2024: -11.8pp
- All cycles
- 2024: R+11.8 2020: D+1.7 2016: D+5.1 2012: D+6.6 2008: D+5.9
Not yet ingested
- Civics
- —
Market trends
- HPI YoY
- ▼ -582.29%
- Current HPI
- 282.4798
- Rent YoY
- —
- Metro
- New York-Newark-Jersey City, NY-NJ-PA
- State GDP YoY
- ▲ 2.60%
- F500 in state
- 92
Industry mix (Fortune 500 HQ in NY)
| Industry | F500 HQs | Revenue |
|---|---|---|
| Financial Services | 10 | $950B |
|
||
| Consumer Goods | 9 | $162B |
|
||
| Insurance | 4 | $225B |
|
||
| Telecommunications | 2 | $144B |
|
||
| Pharmaceuticals | 2 | $112B |
|
||
| Media / Entertainment | 2 | $69B |
|
||
Price history
+73.5% since first listed15 events — show timeline
- 2026-03-06 Pending — OneKey® MLS as Distributed by MLS Grid
- 2026-02-17 Price Changed $675,000 OneKey® MLS as Distributed by MLS Grid
- 2026-02-15 Listed $699,000 OneKey® MLS as Distributed by MLS Grid
- 2021-10-05 Listing Removed — OneKey® MLS as Distributed by MLS Grid
- 2021-07-28 Listing Removed — OneKey® MLS as Distributed by MLS Grid
- 2021-05-30 Listed $509,000 OneKey® MLS as Distributed by MLS Grid
- 2021-03-26 Price Changed $509,000 OneKey® MLS as Distributed by MLS Grid
- 2021-03-05 Listed $489,000 OneKey® MLS as Distributed by MLS Grid
- 2013-09-19 Sold (Public Records) $370,000 Public Records
- 2013-09-19 Sold (MLS) $370,000 HGMLS
- 2013-09-19 Sold (MLS) $370,000 OneKey® MLS as Distributed by MLS Grid
- 2013-03-27 Price Changed $389,000 HGMLS
- 2013-03-27 Delisted — HGMLS
- 2013-02-05 Listed $370,000 HGMLS
- 2013-02-05 Listed $389,000 OneKey® MLS as Distributed by MLS Grid
Property tax history
+2.3%/yrLatest (2025): $19,326 · +5.9% YoY. Source: county tax records.
Cash-flow waterfall
monthlySold comps — $/sqft
last 12 mo · ≤1 miLoading sold comps…