 🔨 Auction
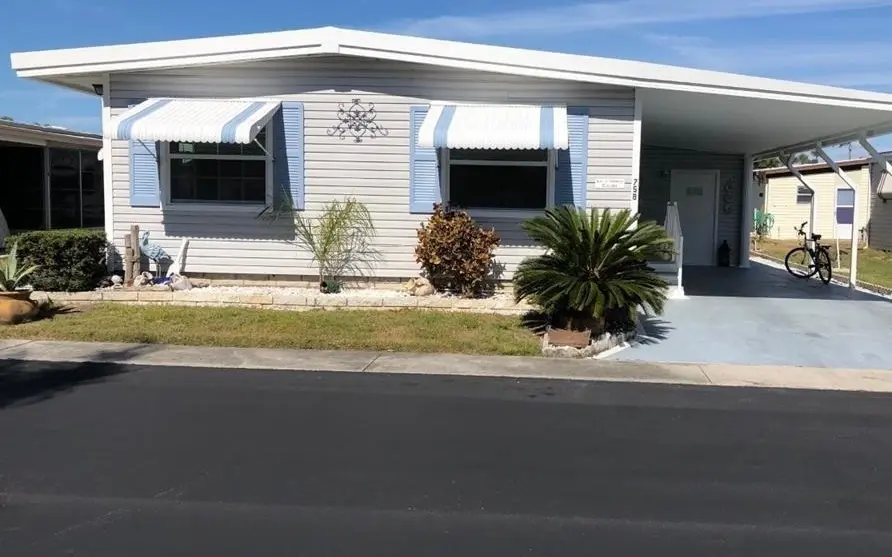
758 Royal Palm Cir · Largo, FL
Flood risk 1/10 · Minimal
- FEMA flood zone
- X (unshaded)
- Chance of flooding over 30 yrs
- 0.0%
- Est. flood insurance / yr
- $507 – $1,088
Fire risk 1/10 · Minimal
- Est. fire insurance / yr
- $947 – $1,759
Heat risk 10/10 · Severe
- Hot days now (above 108°F)
- 6 days/yr
- Hot days in 30 yrs
- 18 days/yr
Wind risk 10/10 · Severe
- Chance of severe wind over 30 yrs
- 99.0%
Air-quality risk 3/10 · Minor
- Unhealthy air days now
- 2 days/yr
- Unhealthy air days in 30 yrs
- 3 days/yr
Risk factors via First Street. Map © Google.
Why this score? — see what drove the B grade
The composite is a weighted blend of 9 inputs, each scored 0–100. Each bar is that input's sub-score; the figure is the points it added to the 100-point composite (weight × sub-score).
- Cash flow +30.0/30.0
- 1% rule +10.0/10.0
- DSCR +10.0/10.0
- ARV discount +7.5/15.0
- Schools +4.3/10.0
- Livability +4.1/5.0
- Rent growth +2.8/5.0
- Condition / age +2.5/5.0
- Appreciation +0.0/10.0
$5,000
🖨 Deal sheet 📄 Offer letter ✓ Due diligence
Listing remarks
Foreclosure Auction Ends June 11, 2026 at 10:00 AM EST. Discover this inviting 2-bedroom, 2-bathroom single-family home, offering a great opportunity in the desirable Largo area. The list price is the opening bid for the online auction. Sold As-is. Explore more details and submit your bid through Federa.
Key facts
- Built 1980
- Listed 5 days
Property features AI
Finance
- Other: Directions: Seminole Blvd north of Ulmerton Road; west into the community, left at the first stop sign, straight to Royal Palm Circle; home is on the right.
Exterior
- Home design: Manufactured home; Residential property
- Construction: One story
- Exterior features: Small lot within a community; Zoned RU
Interior
- Bathrooms: 2 full bathrooms
- Interior features: Single-story layout
Neighborhood map
What this means for you Summary
Snapshot
- This is a 2-bed/2.0-bath manufactured listed at $5k.
Deal economics
- At list price, monthly cash flow is $992 ($12k/yr) — positive.
- The deal already cash-flows at list — no discount required.
- Meets the 1% rule at list price ($2k rent vs $5k).
- Cap rate 20.8% vs local median 4.2% in Largo — top-decile yield for the area; either an underpriced asset or a hidden risk that comps aren't pricing in. Stress-test before assuming the spread holds.
Location & tenants
- Location reads 82/100 on livability (#82 in FL, #1,240 nationally) — a professional / high-income tenant draw. Strengths: commute A+, cost of living A+, housing A+; Watch: employment D+, amenities F.
- Pinellas (suburban): math 51% / reading 51% proficiency, ranked #31 of 73 in FL (top 42%) — acceptable for families but not a draw, mixed tenant base, ~2y average lease.
- Market conditions: Rents rising (+1.4%/yr); 139 active listings in the ZIP; 27 comparable units currently listed for rent nearby; rentals leasing fast (median 8d on market — plan ~1-2 weeks tenant-placement turnaround); 2,676 units permitted in Pinellas County in 2024 (1,422 in 5+ unit buildings).
- This rent runs 36% of the median local income ($65k/yr) — at the standard rent-burdened threshold; future hikes will face affordability resistance.
Forward outlook
- Local home prices are declining (-3.0%/yr); year-one equity from $568 of loan paydown is wiped out by about $2k of value loss. Plan a longer hold.
- Pinellas County population projected at +14% by 2050 — modest demand growth; plan on rents tracking national, not racing it.
- At projected returns (-3.0% appreciation + 1.4% rent growth), your $23k cash investment doubles in ~3 years — after that, you're playing with house money.
Negotiation context
- Only 6 days on market — expect competitive offers; lowballing is unlikely to land.
- 6 sale attempts since 4y ago with the ask held roughly flat each time — persistent listings suggest the price (not the market) is what's stuck; bring a comps-based counter.
Risks & watch-outs
- Watch-outs: property tax is 24.7% of price.
- Climate carrying-cost: severe wind risk, 99% chance of damaging wind over 30y; extreme-heat days projected 6→18/yr by 2055 (HVAC capex compounding) — expect insurance premiums to compound above CPI over the hold.
Questions for the listing agent
- Property tax is high relative to price — has the assessment been appealed recently, and will the sale trigger a re-assessment?
- Is there a deadline driving the sale (1031 exchange, divorce, estate, relocation)? That informs how much negotiation room exists.
- What's the average days-on-market for RENTAL listings here right now (not sales)? A rising rental-DOM trend means longer vacancies and softer asking-rent achievability than the comps imply.
- What's the recent tenant-quality profile in this submarket — average credit score on applications, eviction rate, late-payment / NSF rate, and stable-employment percentage? A property-management company in the area should have these aggregated.
- How much new for-sale + rental construction is in the pipeline within 1–3 miles? Heavy new supply typically softens prices + rents 12–24 months out; constrained supply supports both.
Investment metrics
- 1% rule
- 2.40% ✓
- Cap rate
- 20.77%
- Cash-on-cash
- 51.71%
- DSCR
- 3.30
- GRM
- 3.5
CMA / ARV
- ARV (on-the-fly)
- $82,215
- Comps found
- 12
Show comp detail 12 sales within ~0.75 mi
| Address | Dist | Beds/Ba | Sqft | Sold | Price | $/sf | Match |
|---|---|---|---|---|---|---|---|
| 574 Queen Palm St | 0.16mi | 2/2.0 | 948 (+0%) | 1mo | $109,500 | $116 | 91 |
| 309 Sago Palm St | 0.14mi | 2/2.0 | 952 (+1%) | 6mo | $65,000 | $68 | 87 |
| 724 Sugar Palm St | 0.17mi | 2/2.0 | 948 (+0%) | 9mo | $47,500 | $50 | 84 |
| 624 Queen Palm St | 0.16mi | 2/2.0 | 945 (0%) | 12mo | $150,000 | $159 | 83 |
| 71 Royal Palm Cir | 0.25mi | 2/2.0 | 912 (-4%) | 0mo | $72,000 | $79 | 82 |
| 266 Sago Palm St | 0.17mi | 2/2.0 | 952 (+1%) | 19mo | $77,000 | $81 | 75 |
| 79 Thatch Palm St W | 0.41mi | 2/2.0 | 944 (-0%) | 12mo | $65,000 | $69 | 71 |
| 135 Royal Palm Cir | 0.21mi | 2/2.0 | 1,008 (+7%) | 14mo | $149,000 | $148 | 68 |
| 775 Royal Palm Cir | 0.18mi | 2/2.0 | 1,008 (+7%) | 20mo | $135,350 | $134 | 64 |
| 19 Pindo Palm St W | 0.73mi | 2/1.5 | 912 (-4%) | 1mo | $40,000 | $44 | 58 |
| 38 Pindo Palm St E | 0.43mi | 2/2.0 | 864 (-9%) | 19mo | $135,000 | $156 | 50 |
| 13 Frangipani Cir | 0.68mi | 2/2.0 | 864 (-9%) | 11mo | $75,000 | $87 | 45 |
Match score weights: distance 35% · size 25% · config 20% · recency 20%. Top-matched comps best support the ARV.
Projected returns pro-forma
-3.0% appreciation · 1.38% rent growth · sell at horizon
- IRR
- 47.8%
- Equity multiple
- 3.03×
- Total profit
- $46,720
- Equity at exit
- $12,259
- IRR
- 52.7%
- Equity multiple
- 5.76×
- Total profit
- $109,577
- Equity at exit
- $7,108
Cash invested: $23,020 (down + closing). Projections, not guarantees.
Landlord ↔ Tenant lean methodology
- Overall (STATE)
- 87 Strongly Landlord-Friendly
- State Florida
- 87 Strongly Landlord-Friendly · R+3
- County
- — inherits STATE
- City
- — inherits STATE
ZIP-level market 33778
- Rents YoY
- 1.4%
- Active inventory
- 139
- Price-to-rent
- 0.2×
Monthly cashflow live
- Estimated rent
- $1,975 high interval (Pro) →
- Mortgage (P&I)
- −$431
- Tax est. 1.5%
- −$103 /mo · $1,233/yr
- Insurance
- −$34
- HOA
- −$0
- Vacancy / Maint / Mgmt
- −$415
- Net cashflow
- $992
Break-even live
UW: 25.0% down · 7.5% · 30yr · 1.5% tax · 5.0% vac · 8.0% maint · 8.0% mgmt
Financing live
Cash to close
- Down payment
- $20,554
- Closing costs
- $2,466
- Reserves months
- —
- Total cash needed
- —
Loan-product check · same deal, 3 products live
Conventional
25% down · 7.5% · 30yr
- Down + closing
- —
- Monthly P&I
- —
- Monthly cashflow
- —
- DSCR
- —
- Eligible?
- —
Personal DTI + credit; lowest rate.
DSCR
20% down · 8.5% · 30yr
- Down + closing
- —
- Monthly P&I
- —
- Monthly cashflow
- —
- DSCR
- —
- Eligible?
- —
No personal income docs; deal must DSCR.
Hard money
10% down · 12.0% · 12mo
- Down + closing
- —
- Monthly P&I
- —
- Monthly cashflow
- —
- DSCR
- —
- Eligible?
- —
Short-term bridge; refi at stabilization.
Rent comps 27 comps
| Address | Beds | Baths | Sqft | Rent | $/sqft | DOM | Units | Dist |
|---|---|---|---|---|---|---|---|---|
| 2098 Seminole Blvd Largo, FL | 1.0–3.0 | 1.0–2.0 | 1018 | $2,395 | $2.35 | 2d | 23 | 0.13mi |
| 2131 Ridge Rd S #105 Largo, FL | 2.0 | 1.5 | 1035 | $1,850 | $1.79 | 24d | 1 | 0.13mi |
| 775 Royal Palm Cir Largo, FL | 2.0 | 2.0 | 1008 | $1,700 | $1.69 | 4d | 1 | 0.16mi |
| 253 Sago Palm St Largo, FL | 2.0 | 2.0 | 1000 | $1,295 | $1.29 | 24d | 1 | 0.18mi |
| 1201 Seminole Blvd Largo, FL | 1.0–3.0 | 1.0–2.0 | 1067 | $1,870 | $1.75 | 2d | 1 | 0.48mi |
| 13333 Ridge Rd Largo, FL | 1.0–2.0 | 1.0–1.5 | 860 | $1,765 | $2.05 | 7d | 1 | 0.53mi |
| 1448 Oak St Largo, FL | 2.0 | 2.0 | 1070 | $2,300 | $2.15 | 4d | 1 | 0.79mi |
| 910 9th Ave SW Largo, FL | 3.0 | 2.0 | 1120 | $2,100 | $1.88 | 4d | 1 | 0.84mi |
| 12651 Seminole Blvd #44 Largo, FL | 2.0 | 1.5 | 1000 | $1,450 | $1.45 | 24d | 1 | 0.91mi |
| 705 Redbud LN Largo, FL | 1.0–2.0 | 1.0–2.0 | 986 | $2,615 | $2.65 | 1d | 189 | 0.94mi |
| 11960 133rd Ave Largo, FL | 3.0 | 1.0 | 936 | $2,150 | $2.30 | 7d | 1 | 0.96mi |
| 11666 126th Ter Largo, FL | 3.0 | 1.0 | 1056 | $2,183 | $2.07 | 24d | 1 | 1.00mi |
| 1825 134th Ave Largo, FL | 3.0 | 2.0 | 1005 | $2,200 | $2.19 | 24d | 1 | 1.00mi |
| 1517 16th Cir SE Largo, FL | 1.0 | 1.0 | 625 | $1,250 | $2.00 | 4d | 1 | 1.01mi |
| 13001 120th St Largo, FL | 3.0 | 1.0 | 1044 | $1,950 | $1.87 | 7d | 1 | 1.01mi |
| 11201 122nd Ave Largo, FL | 1.0–2.0 | 1.0–2.0 | 867 | $2,300 | $2.65 | 4d | 2 | 1.03mi |
| 157 2nd Ave SW Unit A Largo, FL | 2.0 | 1.0 | 678 | $1,600 | $2.36 | 24d | 1 | 1.06mi |
| 911 Washington Ave #212 Largo, FL | 2.0 | 2.0 | 885 | $1,675 | $1.89 | 4d | 1 | 1.15mi |
| 12100 Seminole Blvd Largo, FL | 2.0 | 2.0 | 1050 | $1,750 | $1.67 | 24d | 1 | 1.17mi |
| 2272 16th Ave SW Unit C Largo, FL | 2.0 | 1.0 | 1031 | $2,600 | $2.52 | 24d | 1 | 1.28mi |
| 1741 Trotter Rd Unit A Largo, FL | 2.0 | 1.0 | 800 | $1,350 | $1.69 | 24d | 1 | 1.33mi |
| 417 Woodrow Ave Largo, FL | 1.0 | 1.0 | 650 | $1,175 | $1.81 | 18d | 1 | 1.38mi |
| 264 Ridge Rd N Largo, FL | 3.0 | 1.5 | 981 | $2,400 | $2.45 | 24d | 1 | 1.41mi |
| 10155 Sailwinds Blvd S #204 Largo, FL | 2.0 | 2.0 | 1018 | $1,750 | $1.72 | 3d | 1 | 1.44mi |
| 10160 Sailwinds Blvd S Largo, FL | 2.0 | 2.0 | 901 | $1,950 | $2.16 | 24d | 2 | 1.46mi |
| 605 4th Ave NW Largo, FL | 1.0–2.0 | 1.0–2.0 | 1032 | $2,350 | $2.28 | 3d | 6 | 1.48mi |
| 1320 1st Ave NW Largo, FL | 2.0 | 1.0 | 1100 | $2,100 | $1.91 | 24d | 1 | 1.49mi |
Listing history 5 events
-
2026-06-09days on market $5,000 Active 6 DOM
-
2026-06-08days on market $5,000 Active 5 DOM
-
2026-06-07days on market $5,000 Active 4 DOM
-
2026-06-04remarks 305-char remark
-
2026-06-04$5,000 Active 1 DOM
ⓘ Source: listings_history table (triggers on properties + properties_extension) + one-shot
backfill from property_details.listing_events for pre-trigger history.
Climate risk First Street
- Flood 1/10 Low FEMA zone X (unshaded) · 0% chance over 30 yrs
- Wildfire 1/10 Low
- Heat 10/10 Extreme 6 d/yr ≥108°F today · 18 d/yr by 30 yrs out
- Wind 10/10 Extreme 99% chance of damaging wind over 30 yrs
- Air quality 3/10 Moderate 2 unhealthy d/yr today · 3 by 30 yrs out
Nearby sold comps map
Loading sold comps map…
Walkable amenities ~0.75 mi
Loading nearby amenities…
Taxation est. · year 1
- Rental income
- $23,699
- − Mortgage interest
- −$4,605
- − Property taxes
- −$1,233
- − Insurance
- −$411
- − Repairs & maintenance
- −$1,896
- − Management
- −$1,896
- − Depreciation
- −$2,392
- Taxable income
- $11,266
- Est. tax owed @ 24.0%
- −$2,704
- After-tax cash flow
- $9,200/yr
For passive investors: Depreciation is non-cash, so a rental often shows a tax loss while cash-flowing — sheltering income. Rental losses are passive: they offset passive income freely, and up to $25,000/yr can offset ordinary (W-2) income if you actively participate and your MAGI is under $100k (phasing out to $0 by $150k); unused losses carry forward. On sale, claimed depreciation is recaptured at up to 25%, and gains may owe capital-gains tax (a 1031 exchange can defer both). Figures are a year-1 estimate at your 24.0% rate — not tax advice; consult a CPA.
Schools (NCES district)
- District
- Pinellas
- NCES district ID
- 1201560
- Math proficiency
- 51% ▼ -5.00%
- Reading proficiency
- 51% ▼ -3.00%
- Median HH income
- $46,270
- Composite
- 43.27/100
- National rank
- #3046
- State rank
- #31 of 73 in FL
Livability — Largo
- Score
- 82/100
- State rank
- #82
- US rank
- #1240
Category grades
Schools grade is shown separately in the Schools card above.
Census & demographics
- Census place
- Largo, FL
- County
- Pinellas County · 939,478 people
- City population
- 106,311
- Metro
- Tampa-St. Petersburg-Clearwater, FL
- Population (ZIP)
- 16,807
- Household income
- $65,355
- Rent vs Own
- Severe rent burden
- 261.0
Population outlook (Pinellas County) Hauer SSP2
- Today (2025)
- 1,027,532 people
- By 2030
- 1,063,586 · +3.5%
- By 2040
- 1,125,020 · +9.5%
- By 2050
- 1,168,637 · +13.7%
- By 2075
- 1,265,188 · +23.1%
- By 2100
- 1,260,357 · +22.7%
Race, ethnicity, and origin ACS 2023
- Neighborhood character
- Predominantly White (72%)
- Race & ethnicity
- White 72% Hispanic / Latino 15% Two or more races 11% Black 9% Asian 2%
- Hispanic origin (detail)
- Puerto Rican 3% Cuban 6%
- Common ancestry
- Romanian 3% Italian 3% Lithuanian 3%
- Foreign-born
- 13% · Canada, Vietnam, Jamaica
- Languages at home
- 85% English-only · Spanish 10% Vietnamese 1% French/Haitian/Cajun 1%
Political lean MEDSL · Pinellas
- 2024 margin
- Lean R (+5.2) · D 46.9% · R 52.1%
- 2008→2024 swing
- -13.5pp toward R · 2008: 8.3pp · 2024: -5.2pp
- All cycles
- 2024: R+5.2 2020: D+0.2 2016: R+1.1 2012: D+5.6 2008: D+8.3
Not yet ingested
- Civics
- —
Market trends
- HPI YoY
- ▼ -320.64%
- Current HPI
- 369.3008
- Rent YoY
- ▲ 1.38%
- Metro
- Tampa-St. Petersburg-Clearwater, FL
- State GDP YoY
- ▲ 3.28%
- F500 in state
- 36
Industry mix (Fortune 500 HQ in FL)
| Industry | F500 HQs | Revenue |
|---|---|---|
| Industrial Technology | 2 | $29B |
|
||
| Insurance | 2 | $17B |
|
||
| Retail | 1 | $60B |
|
||
| Technology Distribution | 1 | $58B |
|
||
| Homebuilding | 1 | $35B |
|
||
| Technology Manufacturing | 1 | $35B |
|
||
Price history
-86.8% since first listed21 events — show timeline
- 2026-06-03 Listed $5,000 NFMLS
- 2026-03-31 Listing Removed — Stellar MLS as Distributed by MLS Grid
- 2025-09-13 Price Changed $105,900 Stellar MLS as Distributed by MLS Grid
- 2025-05-23 Listed $125,000 Stellar MLS as Distributed by MLS Grid
- 2025-03-02 Listing Removed — Stellar MLS as Distributed by MLS Grid
- 2025-01-22 Price Changed $125,000 Stellar MLS as Distributed by MLS Grid
- 2024-12-06 Listed $135,000 Stellar MLS as Distributed by MLS Grid
- 2023-11-27 Listing Removed — Stellar MLS as Distributed by MLS Grid
- 2023-11-21 Price Changed $139,000 Stellar MLS as Distributed by MLS Grid
- 2023-09-08 Price Changed $149,880 Stellar MLS as Distributed by MLS Grid
- 2023-06-05 Relisted — Stellar MLS as Distributed by MLS Grid
- 2023-06-03 Listing Removed — Stellar MLS as Distributed by MLS Grid
- 2023-05-19 Price Changed $154,880 Stellar MLS as Distributed by MLS Grid
- 2023-03-03 Listed $164,880 Stellar MLS as Distributed by MLS Grid
- 2022-05-21 Sold (Public Records) $150,880 Public Records
- 2022-05-06 Sold (MLS) $150,880 Stellar MLS as Distributed by MLS Grid
- 2022-03-23 Pending — Stellar MLS as Distributed by MLS Grid
- 2022-02-17 Listed $159,880 Stellar MLS as Distributed by MLS Grid
- 2005-04-01 Sold (Public Records) $66,500 Public Records
- 2002-05-16 Sold (Public Records) $59,500 Public Records
- 1999-04-01 Sold (Public Records) $38,000 Public Records
Property tax history
+4.8%/yrLatest (2025): $1,356 · -16.6% YoY. Source: county tax records.
Cash-flow waterfall
monthlySold comps — $/sqft
last 12 mo · ≤1 miLoading sold comps…