8788 Shoreham Dr #23 · West Hollywood, CA
Flood risk 1/10 · Minimal
- FEMA flood zone
- X (unshaded)
- Chance of flooding over 30 yrs
- 0.0%
- Est. flood insurance / yr
- $507 – $1,088
Fire risk 1/10 · Minimal
- Est. fire insurance / yr
- $659 – $1,223
Heat risk 6/10 · Moderate
- Hot days now (above 88°F)
- 8 days/yr
- Hot days in 30 yrs
- 23 days/yr
Wind risk 1/10 · Minimal
- Chance of severe wind over 30 yrs
- —
Air-quality risk 5/10 · Moderate
- Unhealthy air days now
- 7 days/yr
- Unhealthy air days in 30 yrs
- 7 days/yr
Risk factors via First Street. Map © Google.
Why this score? — see what drove the D grade
The composite is a weighted blend of 9 inputs, each scored 0–100. Each bar is that input's sub-score; the figure is the points it added to the 100-point composite (weight × sub-score).
- ARV discount +15.0/15.0
- Appreciation +5.4/10.0
- Cash flow +5.3/30.0
- Schools +3.6/10.0
- Livability +3.5/5.0
- 1% rule +3.1/10.0
- Condition / age +2.5/5.0
- Rent growth +2.4/5.0
- DSCR +0.0/10.0
$999,000
🖨 Deal sheet (PDF) 📄 Offer letter ✓ Due diligence
Listing remarks
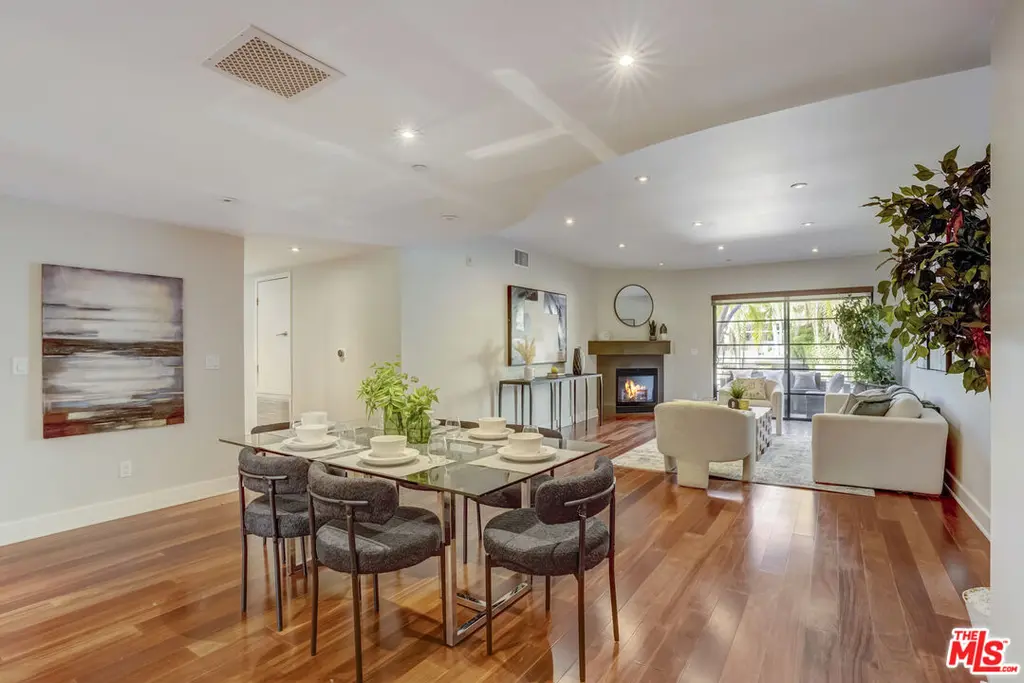
Immerse yourself in the glamour and excitement of West Hollywood while enjoying the comforts of a private, luxurious retreat. This sought after Shoreham Villas condominium includes immaculate living spaces adorned with high end finishes, featuring a gourmet Italian kitchen with top of the line Viking appliances, sleek cabinetry, elongated hallways, spa like bathrooms, multiple spacious closets and a lofty living area with a switch activated fireplace that is perfect for entertaining. Brazilian hardwood floors throughout adorn the open floor plan with high ceilings and city views from all angles. Furthermore, this unit includes two entrances with an elevator steps away from each front door g
Key facts
- Open floor plan
- Lofty living area
- Spa like bathrooms
Tags
Property features AI
Finance
- Other: Complex name: The Shoreham Villas
- HOA & community: Monthly HOA dues; HOA fee billed monthly; Community of 15 units; Pets allowed per association rules
Exterior
- Parking: Gated, side-by-side 2-car garage; 2 covered parking spaces
- Security: Gated parking; Alarm system
- Utilities: Standard municipal utilities
- Home design: Residential condo/co-op; Attached condominium; One level; Unit located on the 2nd floor
- Construction: Attached/common walls
- Exterior features: Sun deck; City view
Interior
- Kitchen: Dishwasher; Range/oven; Refrigerator; Freezer; Trash compactor
- Bedrooms: Entry floor number 2
- Flooring: Hardwood floors
- Bathrooms: 3 full bathrooms
- Heating & cooling: Central heat; Central cooling
- Interior features: Den/office; Breakfast room; Gas fireplace; Alarm system; Has city view
- Laundry & utility: In-unit laundry
Neighborhood map
What this means for you Summary
Snapshot
- This is a 2-bed/3.0-bath condo listed at $999k.
Deal economics
- At list price, monthly cash flow is $-2k ($-27k/yr) — negative.
- To cash-flow at today's rent, offer at most $609k (39.1% below list).
- To meet the 1% rule (rent ≥ 1% of price), the offer needs to be $807k (19.2% below list).
- Recommended offer: $609k (39.1% below list) — sets the bar for cash-flow.
- Cap rate 3.6% vs local median 1.5% in West Hollywood — top-decile yield for the area; either an underpriced asset or a hidden risk that comps aren't pricing in. Stress-test before assuming the spread holds.
Location & tenants
- Location reads 70/100 on livability (#239 in CA) — a middle-class / working-renter tenant base. Strengths: amenities A+, commute A+, employment B+; Watch: health & safety C-, crime F, cost of living F.
- Los Angeles Unified (urban): math 29% / reading 54% proficiency, ranked #223 of 517 in CA (top 43%) — families likely to look elsewhere, expect single-tenant / working-renter base with shorter leases; 67% free/reduced lunch — lower-income household profile, screen leases tightly.
- Zoned schools: West Hollywood Elementary (307 students, 30% FRL); Hubert Howe Bancroft Middle (446 students, 92% FRL); Fairfax Senior High (math 40% / reading 61%, grade D+, #324 of 1,170 statewide, top 28%, 1,632 students, 81% FRL) — zoned schools at 68% FRL track the district average.
- Market conditions: Rents soft (-0.5%/yr); 384 active listings in the ZIP; 40 comparable units currently listed for rent nearby; rentals at typical pace (median 22d on market — plan ~3-4 weeks tenant-placement turnaround); solid renter incomes; 19,697 units permitted in Los Angeles County in 2024 (9,426 in 5+ unit buildings).
- At $8,067/mo this rent would consume 90% of the median local household income ($108k/yr) (locally 2412% of renters already pay >50% of income on rent) — very limited rent-growth headroom before tenants either downsize or default.
Forward outlook
- In year one you build about $15k of equity ($7k loan paydown + $8k appreciation (0.8% local appreciation)).
- Los Angeles County population projected at +9% by 2050 — modest demand growth; plan on rents tracking national, not racing it.
- By year 5, paydown + projected appreciation supports a ~$69k cash-out refi (75% LTV) — recoverable capital for the next deal without selling this one.
Negotiation context
- Only 5 days on market — expect competitive offers; lowballing is unlikely to land.
- 18 sale attempts since 11y ago with the ask held roughly flat each time — persistent listings suggest the price (not the market) is what's stuck; bring a comps-based counter.
Risks & watch-outs
- Climate carrying-cost: extreme-heat days projected 8→23/yr by 2055 (HVAC capex compounding) — expect insurance premiums to compound above CPI over the hold.
Questions for the listing agent
- What do current leases actually rent for vs. the listed asking? Can we see a recent rent roll and the last 12 months of T-12 income?
- What does the HOA fee cover, when was the last increase, and are there any pending special assessments or reserve-fund shortfalls?
- Any open or pending special assessments — roof, HVAC, plumbing, elevator, façade? What's the per-unit balance and payoff schedule, and is the seller paying it off at close or rolling it to the buyer?
- Is there a deadline driving the sale (1031 exchange, divorce, estate, relocation)? That informs how much negotiation room exists.
- Schools are A-rated — typically a magnet for longer-tenancy family renters. What's the average tenant stay here, and is there a school-zone premium baked into asking?
- Crime grade is F in this area — have there been break-ins, vandalism, or insurance claims at this property in the last 3 years? What carrier currently insures it and at what premium?
- The area grade is low — what's the realistic commute time and amenity access for the typical tenant pool here? Any planned neighborhood developments (good or bad) we should know about?
- What's the average days-on-market for RENTAL listings here right now (not sales)? A rising rental-DOM trend means longer vacancies and softer asking-rent achievability than the comps imply.
- What's the recent tenant-quality profile in this submarket — average credit score on applications, eviction rate, late-payment / NSF rate, and stable-employment percentage? A property-management company in the area should have these aggregated.
- How much new apartment / multifamily construction is in the pipeline within 1–3 miles? Heavy new supply (>2% of stock underway) typically softens rents 12–24 months out; light construction supports rent growth.
Investment metrics
- 1% rule
- 0.81% ✗
- Cap rate
- 3.64%
- Cash-on-cash
- -9.48%
- DSCR
- 0.58
- GRM
- 10.3
CMA / ARV
- ARV (median comp)
- $1,618,380
- List price
- $999,000
- Delta
- -16.65%
- Verdict
- UNDERPRICED
- Comps
- 20 within 1.0 mi
Projected returns pro-forma
0.76% appreciation · 0.0% rent growth · sell at horizon
- IRR
- -11.5%
- Equity multiple
- 0.44×
- Total profit
- $-156,081
- Equity at exit
- $328,746
- IRR
- -7.4%
- Equity multiple
- 0.18×
- Total profit
- $-230,276
- Equity at exit
- $427,519
Cash invested: $279,720 (down + closing). Projections, not guarantees.
Landlord ↔ Tenant lean methodology
- Overall (STATE)
- 18 Strongly Tenant-Friendly
- State California
- 18 Strongly Tenant-Friendly · D+13
- County
- — inherits STATE
- City
- — inherits STATE
ZIP-level market 90069
- Home prices YoY
- 0.2%
- Rents YoY
- -0.5%
- Active inventory
- 384
- Price-to-rent
- 10.3×
Monthly cashflow live
- Estimated rent
- $8,067 high interval (Pro) →
- Mortgage (P&I)
- −$5,239
- Tax from tax record
- −$1,852 /mo · $22,226/yr
- Insurance
- −$416
- HOA
- −$1,075
- Vacancy / Maint / Mgmt
- −$1,694
- Net cashflow
- $-2,209
Break-even live
Sensitivity live
| Price | -10% $-1,644 | -5% $-1,927 | +0% $-2,209 | +5% $-2,492 | +10% $-2,775 |
|---|---|---|---|---|---|
| Rent | -10% $-2,847 | -5% $-2,528 | +0% $-2,209 | +5% $-1,891 | +10% $-1,572 |
| Rate | -1.0pp $-1,706 | -0.5pp $-1,955 | base $-2,209 | +0.5pp $-2,468 | +1.0pp $-2,732 |
UW: 25.0% down · 7.5% · 30yr · 1.5% tax · 5.0% vac · 8.0% maint · 8.0% mgmt
Financing live
Cash to close
- Down payment
- $249,750
- Closing costs
- $29,970
- Reserves months
- —
- Total cash needed
- —
Loan-product check · same deal, 3 products live
Conventional
25% down · 7.5% · 30yr
- Down + closing
- —
- Monthly P&I
- —
- Monthly cashflow
- —
- DSCR
- —
- Eligible?
- —
Personal DTI + credit; lowest rate.
DSCR
20% down · 8.5% · 30yr
- Down + closing
- —
- Monthly P&I
- —
- Monthly cashflow
- —
- DSCR
- —
- Eligible?
- —
No personal income docs; deal must DSCR.
Hard money
10% down · 12.0% · 12mo
- Down + closing
- —
- Monthly P&I
- —
- Monthly cashflow
- —
- DSCR
- —
- Eligible?
- —
Short-term bridge; refi at stabilization.
Rent comps 40 comps
| Address | Beds | Baths | Sqft | Rent | $/sqft | DOM | Units | Dist |
|---|---|---|---|---|---|---|---|---|
| 1217 Horn Ave #104 West Hollywood, CA | 2.0 | 2.5 | 2500 | $6,395 | $2.56 | 16d | 1 | 0.07mi |
| 1217 Horn Ave #101 West Hollywood, CA | 2.0 | 2.5 | 2600 | $6,750 | $2.60 | 45d | 1 | 0.07mi |
| 1211 Sunset Plaza Dr West Hollywood, CA | 2.0 | 2.0 | 1594 | $5,800 | $3.64 | 14d | 1 | 0.12mi |
| 1285 Sunset Plaza Dr Los Angeles, CA | 3.0 | 3.5 | 2691 | $19,000 | $7.06 | 45d | 1 | 0.21mi |
| 1328 Londonderry View Dr Los Angeles, CA | 3.0 | 3.0 | 3000 | $11,995 | $4.00 | 45d | 1 | 0.30mi |
| 1326 Londonderry View Dr Unit 3 Los Angeles, CA | 2.0 | 2.0 | 2500 | $4,500 | $1.80 | 45d | 1 | 0.30mi |
| 1326 Londonderry View Dr Unit 5 Los Angeles, CA | 2.0 | 2.0 | 1600 | $6,795 | $4.25 | 45d | 1 | 0.30mi |
| 1326 Londonderry View Dr Unit 7 Los Angeles, CA | 2.0 | 2.0 | 1800 | $7,850 | $4.36 | 45d | 1 | 0.30mi |
| 1100 Alta Loma Rd #1405 West Hollywood, CA | 2.0 | 3.0 | 2246 | $13,000 | $5.79 | 45d | 1 | 0.34mi |
| 1100 Alta Loma Rd #1103 West Hollywood, CA | 2.0 | 2.5 | 1607 | $9,450 | $5.88 | 1d | 1 | 0.34mi |
| 9014 Harratt St West Hollywood, CA | 3.0 | 2.0 | 2000 | $7,995 | $4.00 | 45d | 1 | 0.35mi |
| 8641 Metz Pl Los Angeles, CA | 3.0 | 3.5 | 2244 | $10,800 | $4.81 | 26d | 1 | 0.36mi |
| 1155 N La Cienega Blvd West Hollywood, CA | 1.0–3.0 | 1.0–3.0 | 1449 | $7,300 | $5.04 | 16d | 4 | 0.36mi |
| 832 Palm Ave #305 West Hollywood, CA | 3.0 | 2.5 | 1790 | $5,100 | $2.85 | 45d | 1 | 0.36mi |
| 8500 Sunset Blvd Unit E801 West Hollywood, CA | 2.0 | 2.0 | 2034 | $14,000 | $6.88 | 45d | 1 | 0.40mi |
| 8500 W Sunset Blvd West Hollywood, CA | 2.0 | 1.0–2.5 | 1197 | $11,460 | $9.57 | 1d | 10 | 0.40mi |
| 9042 Phyllis Ave Unit A West Hollywood, CA | 3.0 | 4.0 | 1780 | $7,250 | $4.07 | 12d | 1 | 0.43mi |
| 8455 Fountain Ave #308 West Hollywood, CA | 2.0 | 2.0 | 1636 | $5,900 | $3.61 | 3d | 1 | 0.46mi |
| 831 Westbourne Dr West Hollywood, CA | 3.0 | 2.5 | 1858 | $6,500 | $3.50 | 45d | 1 | 0.46mi |
| 1146 Hacienda Pl Unit 2 West Hollywood, CA | 3.0 | 3.0 | 1900 | $7,200 | $3.79 | 26d | 1 | 0.47mi |
| 1146 Hacienda Pl Unit 3 West Hollywood, CA | 3.0 | 2.5 | 1900 | $7,200 | $3.79 | 9d | 1 | 0.47mi |
| 1146 Hacienda Pl Unit 4 West Hollywood, CA | 3.0 | 2.5 | 1900 | $7,500 | $3.95 | 45d | 1 | 0.47mi |
| 1146 Hacienda Pl Unit 3 West Hollywood, CA | 3.0 | 2.5 | 1900 | $7,200 | $3.79 | 19d | 1 | 0.47mi |
| 1146 Hacienda Pl Unit 7 West Hollywood, CA | 3.0 | 2.0 | 1700 | $7,000 | $4.12 | 5d | 1 | 0.47mi |
| 8730 Hollywood Blvd Los Angeles, CA | 3.0 | 2.0 | 2000 | $8,000 | $4.00 | 45d | 1 | 0.48mi |
| 824 Westmount Dr #2 West Hollywood, CA | 3.0 | 2.5 | 1885 | $6,500 | $3.45 | 13d | 1 | 0.51mi |
| 1528 Rising Glen Rd Los Angeles, CA | 2.0 | 2.0 | 1676 | $7,550 | $4.50 | 1d | 1 | 0.52mi |
| 8706 Sunset Plaza Pl Los Angeles, CA | 3.0 | 3.0 | 2359 | $18,000 | $7.63 | 22d | 1 | 0.53mi |
| 1541 Rising Glen Rd Los Angeles, CA | 3.0 | 4.0 | 2698 | $20,000 | $7.41 | 6d | 1 | 0.54mi |
| 8998 Lloyd Pl West Hollywood, CA | 3.0 | 3.0 | 1800 | $8,500 | $4.72 | 20d | 1 | 0.57mi |
| 8810 Hollywood Blvd Los Angeles, CA | 3.0 | 3.0 | 1852 | $13,000 | $7.02 | 5d | 1 | 0.58mi |
| 1210 N Kings Rd #203 West Hollywood, CA | 2.0 | 3.0 | 2500 | $5,495 | $2.20 | 21d | 1 | 0.60mi |
| 1210 N Kings Rd #203 West Hollywood, CA | 2.0 | 3.0 | 2500 | $5,495 | $2.20 | 26d | 1 | 0.60mi |
| 652 Huntley Dr Unit 103 West Hollywood, CA | 2.0 | 2.5 | 1719 | $11,750 | $6.84 | 45d | 1 | 0.60mi |
| 755 N Alfred St Los Angeles, CA | 3.0 | 4.0 | 2335 | $12,500 | $5.35 | 5d | 1 | 0.63mi |
| 755 N Alfred St Unit B Los Angeles, CA | 3.0 | 3.5 | 2335 | $12,500 | $5.35 | 7d | 1 | 0.63mi |
| 850 N Croft Ave Los Angeles, CA | 2.0 | 2.0 | 1573 | $6,098 | $3.88 | 45d | 2 | 0.64mi |
| 850 N Croft Ave #203 Los Angeles, CA | 2.0 | 2.0 | 1606 | $6,200 | $3.86 | 17d | 1 | 0.64mi |
| 9001 Santa Monica Blvd West Hollywood, CA | 3.0 | 2.5–3.5 | 2121 | $15,649 | $7.38 | 0d | 2 | 0.66mi |
| 1472 N Kings Rd West Hollywood, CA | 3.0 | 2.5 | 3360 | $20,000 | $5.95 | 13d | 1 | 0.67mi |
HOA detail condo
- Monthly dues
- $1,075 · $12,900/yr
- Likely covers
- security
- Assessments
- None detected in remarks — confirm with the listing agent.
Listing history 48 events
-
2026-06-21days on market $999,000 Active 5 DOM
-
2026-06-18days on market $999,000 Active 2 DOM
-
2026-06-17pricedays on market $999,000 Active 1 DOM
-
2026-06-16days on market $1,349,000 Active 111 DOM
-
2026-06-15days on market $1,349,000 Active 110 DOM
-
2026-06-13days on market $1,349,000 Active 108 DOM
-
2026-06-09days on market $1,349,000 Active 104 DOM
-
2026-06-08days on market $1,349,000 Active 103 DOM
-
2026-06-07days on market $1,349,000 Active 102 DOM
-
2026-06-04days on market $1,349,000 Active 99 DOM
-
2026-06-03days on market $1,349,000 Active 98 DOM
-
2026-06-02days on market $1,349,000 Active 97 DOM
-
2026-06-01days on market $1,349,000 Active 96 DOM
-
2026-05-31days on market $1,349,000 Active 95 DOM
-
2026-02-25$1,349,000 Active 1311-char remark
-
2026-01-13Active
-
2025-10-20Active
-
2025-08-06Active
-
2025-06-23Active
-
2025-06-16Active
-
2025-05-27Active
-
2023-12-04Active
-
2022-06-06soldstatus $1,732,500 Sold
-
2022-06-06soldstatus $1,732,500
-
2022-05-09status Pending
-
2022-04-11historical Backup Offers Accepted
-
2022-03-25$1,750,000
-
2022-03-25$1,750,000 Active
-
2020-03-02soldstatus $1,560,000 Sold
-
2020-03-02soldstatus $1,560,000
-
2020-02-27status Pending
-
2020-02-03$1,595,000 Active
-
2019-08-14historical Withdrawn
-
2019-08-14historical
-
2019-07-19Active
-
2019-07-19historical Canceled
-
2019-07-19$1,649,000
-
2019-07-09price
-
2019-07-08status Active
-
2019-07-03historical Backup Offers Accepted
-
2019-04-25Active
-
2018-12-03historical Withdrawn
-
2018-08-16Active
-
2015-06-23soldstatus $1,395,000 Closed
-
2015-06-23soldstatus $1,395,000
-
2015-06-20status Pending
-
2015-05-18status Backup Offers Accepted
-
2015-04-09$1,395,000 Active
ⓘ Source: listings_history table (triggers on properties + properties_extension) + one-shot
backfill from property_details.listing_events for pre-trigger history.
Tax reassessment forecast CA · Resets to sale price
- Current annual tax
- $22,226 · $1,852/mo
- Projected year-2 tax
- $22,226 · $1,852/mo
- Expected delta
- $0/yr ($0/mo · 0.0%)
ⓘ Screening estimate from a state-policy table — verify with the county assessor before closing.
Climate risk First Street
- Flood 1/10 Low FEMA zone X (unshaded) · 0% chance over 30 yrs
- Wildfire 1/10 Low
- Heat 6/10 Major 8 d/yr ≥88°F today · 23 d/yr by 30 yrs out
- Wind 1/10 Low
- Air quality 5/10 Major 7 unhealthy d/yr today · 7 by 30 yrs out
Nearby sold comps map
Loading sold comps map…
Walkable amenities ~0.75 mi
Loading nearby amenities…
Taxation est. · year 1
- Rental income
- $96,803
- − Mortgage interest
- −$55,960
- − Property taxes
- −$22,226
- − Insurance
- −$4,995
- − Repairs & maintenance
- −$7,744
- − Management
- −$7,744
- − HOA
- −$12,900
- − Depreciation
- −$29,062
- Taxable loss
- −$43,827
- Est. tax savings @ 24.0%
- +$10,519
- After-tax cash flow
- $-15,994/yr
For passive investors: Depreciation is non-cash, so a rental often shows a tax loss while cash-flowing — sheltering income. Rental losses are passive: they offset passive income freely, and up to $25,000/yr can offset ordinary (W-2) income if you actively participate and your MAGI is under $100k (phasing out to $0 by $150k); unused losses carry forward. On sale, claimed depreciation is recaptured at up to 25%, and gains may owe capital-gains tax (a 1031 exchange can defer both). Figures are a year-1 estimate at your 24.0% rate — not tax advice; consult a CPA.
Schools (NCES district)
- District
- Los Angeles Unified
- NCES district ID
- 0622710
- Math proficiency
- 29% ▼ -4.00%
- Reading proficiency
- 54% ▲ 10.00%
- Median HH income
- $50,403
- Composite
- 35.67/100
- National rank
- #4875
- State rank
- #223 of 517 in CA
Livability — West Hollywood
- Score
- 70/100
- State rank
- #239
- US rank
- #7852
Category grades
Schools grade is shown separately in the Schools card above.
Census & demographics
- Census place
- West Hollywood, CA
- County
- Los Angeles County · 9,444,647 people
- City population
- 20,961
- Metro
- Los Angeles-Long Beach-Anaheim, CA
- Population (ZIP)
- 20,961
- Household income
- $107,987
- Rent vs Own
- Severe rent burden
- 2412.0
Population outlook (Los Angeles County) Hauer SSP2
- Today (2025)
- 10,940,515 people
- By 2030
- 11,256,481 · +2.9%
- By 2040
- 11,729,929 · +7.2%
- By 2050
- 11,948,407 · +9.2%
- By 2075
- 11,818,114 · +8.0%
- By 2100
- 10,842,928 · -0.9%
Race, ethnicity, and origin ACS 2023
- Neighborhood character
- Predominantly White (77%)
- Race & ethnicity
- White 77% Hispanic / Latino 8% Two or more races 8% Asian 6% Black 3%
- Hispanic origin (detail)
- Mexican 4%
- Common ancestry
- Scotch-Irish 6% Lithuanian 4% Italian 4%
- Foreign-born
- 21% · Canada, China, Jamaica
- Languages at home
- 77% English-only · Spanish 7% Other Indo-European 4% Russian/Polish/Slavic 3%
Political lean MEDSL · Los Angeles
- 2024 margin
- Solid D (+32.9) · D 64.8% · R 31.9% · Other 3.3%
- 2008→2024 swing
- -7.4pp toward R · 2008: 40.4pp · 2024: 32.9pp
- All cycles
- 2024: D+32.9 2020: D+44.2 2016: D+48.0 2012: D+40.0 2008: D+40.4
Not yet ingested
- Civics
- —
Market trends
- HPI YoY
- ▲ 0.76%
- Current HPI
- 323.1842
- Rent YoY
- ▼ -0.54%
- Metro
- Los Angeles-Long Beach-Anaheim, CA
- State GDP YoY
- ▲ 3.21%
- F500 in state
- 116
Industry mix (Fortune 500 HQ in CA)
| Industry | F500 HQs | Revenue |
|---|---|---|
| Technology | 27 | $1,492B |
|
||
| Financial Services | 3 | $174B |
|
||
| Retail | 3 | $44B |
|
||
| Insurance | 3 | $26B |
|
||
| Media / Entertainment | 2 | $115B |
|
||
| Pharmaceuticals / Biotech | 2 | $62B |
|
||
Price history
-28.4% since first listed35 events — show timeline
- 2026-06-16 Listed $999,000 TheMLS
- 2026-02-25 Listed — TheMLS
- 2026-01-13 Listed — TheMLS
- 2025-10-20 Listed — TheMLS
- 2025-08-06 Listed — TheMLS
- 2025-06-23 Listed — TheMLS
- 2025-06-16 Listed — TheMLS
- 2025-05-27 Listed — TheMLS
- 2023-12-04 Listed — TheMLS
- 2022-06-06 Sold (Public Records) $1,732,500 Public Records
- 2022-06-06 Sold (MLS) $1,732,500 TheMLS
- 2022-05-09 Pending — TheMLS
- 2022-04-11 Contingent — TheMLS
- 2022-03-25 Listed $1,750,000 TheMLS
- 2022-03-25 Listed $1,750,000 SDMLS
- 2020-03-02 Sold (Public Records) $1,560,000 Public Records
- 2020-03-02 Sold (MLS) $1,560,000 TheMLS
- 2020-02-27 Pending — TheMLS
- 2020-02-03 Listed $1,595,000 TheMLS
- 2019-08-14 Listing Removed — SDMLS
- 2019-08-14 Delisted — TheMLS
- 2019-07-19 Listed $1,649,000 SDMLS
- 2019-07-19 Delisted — TheMLS
- 2019-07-19 Listed — TheMLS
- 2019-07-09 Price Changed — TheMLS
- 2019-07-08 Relisted — TheMLS
- 2019-07-03 Contingent — TheMLS
- 2019-04-25 Listed — TheMLS
- 2018-12-03 Delisted — TheMLS
- 2018-08-16 Listed — TheMLS
- 2015-06-23 Sold (Public Records) $1,395,000 Public Records
- 2015-06-23 Sold (MLS) $1,395,000 TheMLS
- 2015-06-20 Pending — TheMLS
- 2015-05-18 Pending — TheMLS
- 2015-04-09 Listed $1,395,000 TheMLS
Property tax history
+7.5%/yrLatest (2025): $22,226 · +1.7% YoY. Source: county tax records.
Cash-flow waterfall
monthlySold comps — $/sqft
last 12 mo · ≤1 miLoading sold comps…